Perturbation in linker histone content has no effect on the cell
cycle but affects the cell size of suspension grown tobacco BY-2
cells
Tomasz Calikowski
a, Piotr Koz´bial
*
b, Mieczysl
*
aw Kuras´
c, Andrzej Jerzmanowski
a,b,*
aInstitute of Biochemistry and Biophysics,Polish Academy of Sciences,Pawin´skiego5A,02-106Warsaw, Poland bLaboratory of Plant Molecular Biology,Warsaw Uni6ersity,Pawin´skiego5A,02-106Warsaw, Poland
cLaboratory of Plant Morphogenesis,Warsaw Uni6ersity,Pawin´skiego5A,02-106 Warsaw, Poland
Received 14 February 2000; received in revised form 17 March 2000; accepted 30 March 2000
Abstract
Histone H1, a key structural element of eukaryotic chromosomes can be perturbed in plants in vivo by overexpression or by a change in the proportion of native H1 variants (Prymakowska-Bosak M., Przewl*oka M., Iwkiewicz J., Egierszdorff S., Kuras´
M., Chaubert N., Gigot C., Spiker S., Jerzmanowski A., Histone H1 overexpressed to high level in tobacco affects certain developmental programs but has limited effect on basal cellular functions, Proc. Natl. Acad. Sci. U.S.A. 93 (1996) 10250-10255; Prymakowska-Bosak M., S´lusarczyk J., Przewl*oka M., Kuras´ M., Lichota J., Kilian´czyk B., Jerzmanowski A., Linker Histones
Play a Role in Male Meiosis and the Development of Pollen Grains in Tobacco, Plant Cell 11 (1999) 2317-2330). In order to analyze the possible causes of the specific phenotypic changes observed in whole plants we employed a simpler system of tobacco BY-2 cell line. We show that the BY-2 cells engineered to overexpress a major variant ofArabidopsisH1 or with the level of native major variants of H1 decreased by antisense strategy maintain the normal ability to grow and the normal length of the cell cycle. In the cells with perturbed H1 histones no change was observed in the organization of mitotic spindle or actin filaments of the cytoskeleton. The only visible phenotypic change occurred in cells overexpressing H1 that showed an increased frequency of cells with unusually large size. This phenotype was correlated with subtle but reproducible changes in the organization of cortical microtubules. © 2000 Elsevier Science Ireland Ltd. All rights reserved.
www.elsevier.com/locate/plantsci
1. Introduction
Eukaryotic DNA is assembled into chromatin in which it is packed by histone proteins into nu-cleosomes. The basic nucleosomal fiber is com-posed of nucleosome cores (146 bp of DNA wrapped around an octamer of core histones) connected by DNA of variable length to which linker histones (H1 histones) bind [3,4]. Linker histones are basic proteins with centrally placed globular domain and extended and highly charged N- and C-terminal tails. They are the most diver-gent group of histones with numerous cell-type
and stage-specific variants described. The somatic-type histone H1 occurs in chromatin on average at one molecule per nucleosome. In the model based on recent experiments, the globular domain of H1 is placed asymmetrically near the dyad axis of the nucleosome [5]. The extended tails of H1 interact mostly with the linker DNA [6].
Surprisingly, recent experiments examining the effects of knock-outs of genes for histone H1-like
proteins in Tetrahymena and Aspergillus and for
some special H1 variants in higher eukaryotes (like
H10variant in mouse) revealed that linker histones
may not be essential for proliferation and differen-tiation of cells [7 – 9]. Although none of the above experiments contained a rigorous test showing the lack of compensation of H1 function by other similar proteins (like the structurally more distant
* Corresponding author. Tel.: +48-22-6596072, ext. 3234; fax: +48-22-6584636.
E-mail address:[email protected] (A. Jerzmanowski).
variants of H1 or the proteins of the HMG group), these works have seriously undermined an earlier paradigm about H1 as an indispensable architectural element of chromatin and a key gen-eral repressor of transcription.
In an attempt to examine the function of linker histones in plants we have overexpressed in to-bacco a typical major variant of plant H1 from
Arabidopsis thaliana [1]. Despite greatly elevated level of major H1 variants in chromatin of the transgenic plants, these plants did not show seri-ous disturbances in growth and differentiation. We interpreted this result as indicating that the satura-tion of the available chromatin sites with H1 does not lead to marked changes in the expression of essential genes. This is in keeping with the view that linker histones are not general repressors of transcription in vivo. However, we have observed specific effects of H1 overexpression on plant mor-phology and ultrastructure. They manifested as anomalies in the growth rate and size of the cells
and in nuclei/chloroplast proportions [10]. In
an-other attempt to examine the function of H1 we used antisense strategy in order to decrease the level of the major variants of H1 (H1A and H1B) in tobacco. In the resulting transgenic plants these two major variants were indeed decreased, how-ever their lack was almost fully compensated by the increase of the four minor variants of H1, namely H1C to H1 F [2]. The major phenotypic effect of this change in the profile of chromatin variants of linker histones was restricted to flower-ing stage and manifested as the inability to de-velop the viable pollen grains.
In the present work we analyzed the effects of linker histone perturbations in a simpler model of tobacco BY-2 suspension cells. These cells un-dergo normal growth and division but are unable to differentiate. We conclude that perturbations in linker histones (either by overexpression of a ma-jor variant or by the change of the usual propor-tion of H1 variants) have no effect on the viability of the transgenic cells and the duration of the cell cycle. Also no changes were observed in these cells in the organization of the mitotic spindle or the actin filaments of the cytoskeleton. However, we noticed an unusual distribution of sizes in the population of cells overexpressing H1, correlated with the subtle but reproducible changes in the organization of cortical microtubules.
2. Material and methods
2.1. Transformation of tobacco plants and BY-2
cell lines
N. tobacum seedlings were transformed via
Agrobacterium tumefaciens bearing the binary
plasmid pRok2 containing either the cDNA of A.
thaliana histone H1-2 gene truncated at 3%UTR
(construct RFH1-3%) or the cDNA of N. tobacum
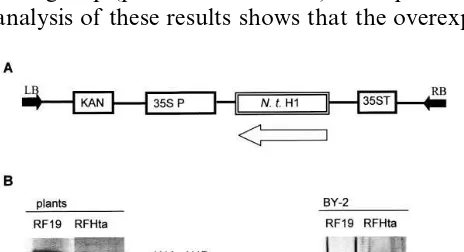
histone H1B gene placed in the reverse orientation in respect to the promoter (construct RFHta) [1]. The control plasmid RF19 conferred only the kanamycin resistance. The methods of transforma-tion, selection and regeneration of plants were as described before [2].
Tobacco BY-2 cells were grown in 3% sucrose medium as described [30,11] at 28°C on the shak-ing platform (150 rpm) and subcultured every 7 days by 1:16.7 ratio (3 ml of cell suspension added to 50 ml of fresh medium). The cells were
trans-formed via Agrobacterium tumefaciens with the
same binary plasmid constructs as used for plant transformation (see above). Four ml of 3-day-old cell suspension were used for each transformation.
First, 1 ml of 20 mM acetosyringone
(3,5-dimethoxy-4-hydroxyacetophenon, Aldrich) in
ethanol was added for each ml of cell suspension
(to a final concentration of 20 mm) and the whole
mixture was pipetted 20 times with the sterile
sharp edged glass pipette. Next, 75 ml of the
overnight Agrobacterium culture were mixed with
the cell suspension on a sterile plastic Petri dish and incubated in darkness for 4 days at 28°C. A separate dish with cells treated as above, but with no bacteria was a control. Cells were then washed three times with the MS medium supplemented
with 500 mg/ml carbenicillin (Sigma). Finally, the
cells were sown on the solid MS medium
contain-ing kanamycin (100 mg/ml) and carbenicillin (500
mg/ml) and grown at 28°C for 3 – 4 weeks. The cell
viability was confirmed by the 2,3,5-triphenyltetra-zolium chloride (TTC) reduction method [12].
2.2. Isolation and analysis of histones
essen-tially as described [13], with minor differences. The extraction continued for 18 h on the laboratory shaker at 4°C followed by double centrifugation of the homogenate for 10 min at 10 000 rpm at 4°C, pellet removal and supernatant filtration through two layers of Miracloth (Calbiochem). From this filtrate histone H1 was precipitated with the final concentration of 18% of trichloroacetic acid (TCA, Sigma). The H1-containing pellet was re-covered by centrifugation at 12 500 rpm for 40 min at 4°C followed by dialysis against 0.01 M
H2SO4 and 0.1 mM phenylmethylsulphonyl
fluoride (PMSF, Sigma). To isolate total chro-matin histones we adopted the described method [29]. The cells were homogenized in a Waring blender in buffer 1 (0.4 M sucrose, 10 mM Tris –
HCl, pH 8.0, 10 mM MgCl2, 5 mM
2-mercap-toethanol, 2 mM PMSF) and filtrated through two layers of Miracloth (Calbiochem). The filtrate was spun for 10 min at 10 000 rpm at 2°C and the pellet was suspended in buffer 2 (0.25 M sucrose,
10 mM Tris – HCl, pH 8.0, 10 mM MgCl2, 1%
TritonX-100, 2 mM 2-mercaptoethanol, 2 mM PMSF). After centrifugation in the same condi-tions as above the pellet was suspended in a Potter homogenizer and extracted with 0.4 M sulphuric acid for 2 h at 4°C. Following the centrifugation at 18 000 rpm for 30 min the pellet was discarded and the extracted proteins precipitated overnight with cold acetone and than saved after centrifuga-tion at 18 500 rpm for 30 min by suspending in a small volume of water. After dialysis samples were resolved on the acetic acid – urea polyacrylamide gels as previously described [14]. Histone H4 was used as the internal control for histone H1 level calculations. All polyacrylamide gels were stained with Coomassie Brilliant Blue dye.
2.3. Analysis of histone H1 phosphorylation in
6i6o
To test the phosphorylation of linker histones in plants, seeds of the transgenic plants were placed in liquid MS medium [15] with kanamycin (100
mg/ml) and grown on the rotary platform for 7
days at 22°C under 16-h photoperiod. The selected transgenic seedlings were washed with the phos-phate-free MS medium and grown in the same
medium supplemented with 1.6 mCi 32
P-or-thophosphate (Amersham) (16 mCi/ml) for further
7 days. The extraction of histone H1 with 5%
perchloric acid was performed as described previ-ously [13]. To study H1 phosphorylation in BY-2 cell lines, cells were grown for 3 days after subcul-ture, washed with phosphate-free medium and grown for 5 h without phosphates. After phate starvation the cells were transferred to
phos-phate-free medium containing 0.83 mCi
32P-orthophosphate (Amersham) (9.3
mCi/ml) and cultured for further 4 days before H1 isolation. Proteins were visualized on 12% SDS-PAGE [16]
and autoradiographed using the PhosphorImager®
(Molecular Dynamics, CA) equipment.
2.4. DNA isolation, PCR and Southern hybridizations
DNA from plant material was isolated as de-scribed before [1]. DNA from BY-2 cells was isolated with the SDS-miniprep method [17]. Four g of frozen BY-2 cells were homogenized in a T25 homogenizer for 30 s at 24 000 rpm in 15 ml homogenization buffer (100 mM EDTA, 500 mM NaCl, 10 mM 2-mercaptoethanol). One ml of 20% SDS was added, sample mixed thoroughly and incubated at 65°C for 10 min. Five ml of 5 M potassium acetate was added and the sample chilled at 0°C for 20 min followed by centrifuga-tion (15 000 rpm, 20 min, 4°C) and filtracentrifuga-tion through one layer of Miracloth. DNA was pelleted with cold isopropanol, washed and resuspended in water.
The polymerase chain reaction (PCR) was em-ployed to confirm the transgenicity of the BY-2 cells. One U of Deep Vent DNA polymerase (New England, Biolabs) was used for each
reac-tion (50 ml). The PCR conditions were as follow: 3
min at 94°C, 30 cycles (30 s 94°C, 30 s 60°C, 2 min 72°C), 5 min 72°C. The following primers were used:
1. For the nptII (neomycin phosphotransferase gene) giving the product length of 700 bp
NP1:
5%GAGAGGCTATTCGGCTATATGACTG
3% NP2:
5%CTGATGCTCTTCGTCCAGATCATC3%
2. For A. thaliana histone H1 gene giving the
product length of 804 bp H1-44:
5%GTTTCTGAGAGAGAAGAAGATG3%
PCR products were resolved on 1% agarose gel containing ethidium bromide and photographed under the UV. The transgenicity of the cell lines as well the number of integration events were tested by Southern hybridization using the A. thaliana histone H1 cDNA insert (in the case of the
RFH1-3%cell lines) and theN.tobacum histone cDNA (in
the case of the RFHta lines) as probes. The South-ern hybridizations were performed as described [18].
3. BY-2 cell synchronization and determination of mitotic index
BY-2 cells were synchronized as described [19,20]. For the synchronization experiments no kanamycin was added to the medium. Cell
divi-sions were stopped at the G1 S transition with
aphidicolin (Sigma) at the final concentration of 5
mg/l or with hydroxyurea (Sigma) at the final
concentration of 60 mM. After 24-h blockage the cells were washed with 400 ml of fresh medium on
the sterile 50-mm steel mesh filter and transferred
to a fresh medium for further culture. Cell samples were taken at regular 1-h intervals and stained with either 1% acetoorcein (Sigma) (for observa-tion under a bright field microscope) or with
4,6-diamididino-2-phenylidole (DAPI, Sigma) for
observation under the epifluorescence microscope). The mitotic index was calculated as the percentage of mitotically active cells in the population of cells counted (typically more than 500 cells).
3.1. Determination of ploidy of the BY-2 cells by flow cytometry
Samples of the BY-2 cell suspensions were pre-pared according to [21] with some minor modifica-tions. The cells were chopped in a Petri dish with
250 ml of the nuclei isolation buffer (NIB: 0.1 M
Tris – HCl, pH 7.0, 25 mM MgCl2, 85 mM NaCl,
0.1% TritonX-100), supplemented by
4,6-di-amidino-2-phenylidole (DAPI, 2 mg/ml). After
chopping, the suspension was passed through 50
mm nylon mesh filter. For each sample, 3000 – 6000
nuclei were analyzed by means of Partec CCC (Mu¨nster, Germany) flow cytometer. Histograms obtained were analyzed using DPAC v. 2.2 com-puter software
3.2. Light, immunofluorescence and transmission electron microscopy
To measure the basic cellular and nuclear di-mensions, cells were stained with 1% neutral red (Sigma) and observed under the light microscope (Olympus). For immunofluorescence microscopy cells were placed for 2 h in 4% paraformaldehyde in PIPES buffer (0.05 M PIPES, pH 7.0) at 22°C. Following rinsing, the material was digested for 30 min with 0.5% cellulase and transferred for 15 min to 1% TritonX-100 in PIPES buffer. Following a 15-min rinse with buffer, the cells were squashed on the polylysine coated slides. The preparations were incubated with mouse monoclonal
antitubu-lin antibody (anti a-tubulin, Sigma) diluted 1:200
in phosphate buffered saline (PBS) for 12 h at 4°C and FITIC (fluoresceine-coupled) goat anti mouse secondary antibody diluted 1:150 in PBS. Finally
the preparations were stained with DAPI (1mg/ml)
and embedded in citifluor glycerol mixture. For the epifluorescence microscopy of actin microfila-ments [22], cells were fixed with 3% formaldehyde for 1 h, washed with phosphate buffered saline
and stained for 1 h in 0.1 mg/ml (6.6 mM) of
rhodamin-phalloidin conjugate (Sigma) followed by extensive washes with phosphate buffered sa-line. The observations were made using Optiphot 2 Nikon microscope with epifluorescence and stan-dard excitation and barrier filters. For transmis-sion electron microscopy the material was fixed in a mixture of 2.5% glutaraldehyde with 4% paraformaldehyde (pH 7.2 in phosphate buffer) according to [23]. After dehydrating in a series of alcohols and propylene oxide the samples were
embedded in Spurr resin [24]. Semi-thin (1 – 2 mm)
and ultrathin (about 80 nm) sections were cut with an LKB ultramicrotome. Semi-thin sections were stained with 0.1% toluidine blue and used for light microscopy (Nikon). The ultrathin sections were stained for contrast with uranyl acetate and lead citrate as described before [25] and analyzed with
JEOL JEM 100C transmission electron
microscope.
4. Results
4.1. Comparison of histone H1 le6els in transgenic
tobacco plants and BY-2 cell lines o6erexpressing
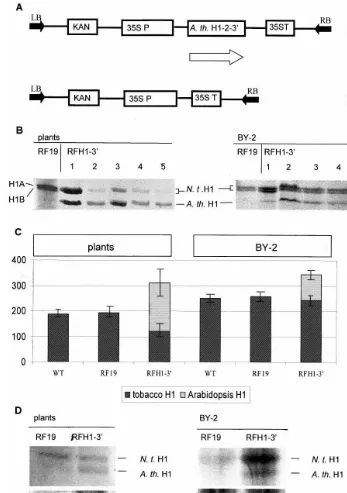
Fig. 1. Construction and analysis of transgenic tobacco plants and BY-2 cell lines overexpressing histone H1 fromArabidopsis. (A) Genetic constructs used for transformation of tobacco plants and tobacco BY-2 cell line. RFH1-3%confers the kanamycin
resistance (KAN) and contains theArabidopsis thalianahistone H1-2 cDNA (A.th. H1-2-3%) under the control of the cauliflower mosaic virus 35S RNA gene promoter (35S P) and terminator (35S T), RF19 (control) confers only the kanamycin resistance. (B) Polyacrylamide SDS gel electrophoretic analysis of H1 histones extracted from leaves of individual tobacco plants (left) and BY-2 cell lines (right). RF19, control transformations; RFH1-3%, plants and cell lines transformed with the RFH1-3%construct. H1A and
H1B-major variants of tobacco histone H1 (N. t. H1). (C) Comparison of tobacco (darkly streaked) and A. thaliana (lightly shaded) histone H1 levels (in arbitrary units) in tobacco plants (left) and BY-2 cell lines (right) based on the densitometric analysis of total histones extracted from chromatin. WT, wild type tobacco plants and BY-2 cell lines. (D) Autoradiographic analysis of histone H1 phosphorylation in vivo in tobacco plants (left) and BY-2 cell lines (right) transformed with FR19 (control) and RFH1-3% vector. N.t. H1, tobacco histone H1, A. th. H1, A. thaliana histone H1. Top panels, SDS-PAGE; bottom panels,
Transgenic tobacco plants and BY-2 cell lines overexpressing histone H1 were generated by
transformation with the plasmid RFH1-3%carrying
a gene for a major somatic form ofA. thaliana H1
(Fig. 1A). The characterization of tobacco linker histones and the identification by immunoanalysis
of the transgene-coded Arabidopsis histone H1
have been described before [1,2]. It was shown earlier that transgenic plants obtained upon
trans-formation with the RFH1-3% construct contained
high level of overexpressed histone H1 [1]. These data were confirmed by the present results with the whole plants (Fig. 1B, left). The pattern of linker histones characteristic for the majority of individ-ual transgenic plants consisted of a dominant
band of the transgene-coded Arabidopsis histone
H1 and the less intense bands of the major vari-ants (H1A and H1B) of the native tobacco H1. The pattern of linker histones was different in transformed BY-2 cell lines. In all individual transformed cell lines the band corresponding to
transgene-coded Arabidopsis histone H1 was
al-ways less intense than the bands of the major variants of native tobacco H1 (Fig. 1B, right). We
obtained 35 individual RFH1-3%-transformed
plants and 15 separate RFH1-3%-transformed BY-2
cell lines and analyzed H1 levels in five of them for each group (plants and cell lines). The quantitative analysis of these results shows that the
overexpres-sion of transgene-coded H1 in whole plants is correlated with the decrease of native H1 com-pared to its level in wild type or control trans-formed plants (Fig. 1C, left). No such decrease of native H1 was seen in transformed BY-2 cell lines. The overall level of the major variants of tobacco H1 in these cells was about 25% higher than in the leaf tissue of the whole plants. The overexpressed
Arabidopsis H1 was simply added to this basic level without any decrease in the major variants of native tobacco H1 (Fig. 1C, right). We have also found that the level of endogenous histone H1 varied between whole plants and BY-2 cells (with BY-2 cell having higher level of H1 protein), and we noted that the tobacco plants showed a much higher level of the transgenic H1 histone overex-pression than the BY-2 cells. Moreover, this level of overexpression was much more variable in plants, than it was in cells.
For all experiments involving BY-2 cells, the same line was used, and the experiments were repeated with both the respective lines from the same transformations and later with the other respective lines from the following transformation. For the H1 phosphorylation and further studies
(Figs. 3 – 6) we have used the RFH1-3% line with
the most pronounced overexpression of the A.
thaliana histone H1, numbered RFH1-3%-2, as seen on the left-side panel of Fig. 2B. This line was used also for subsequent observations. The same rule was also adopted for the control line (RF19, seen on the same picture), and — when appropri-ate — the RFHta line (RFHta on the left-side panel of Fig. 2). We have obtained very similar results with all respective cell lines tested.
The analysis of the phosphorylation of linker histones in transformed plants and cell lines re-vealed that both the native and the transgene-coded H1 undergo phosphorylation, and that there is a noticeable difference in degree of phos-phorylation between histones from the whole plant and the histones from the cell suspension (Fig. 1D). Moreover, we observed that there is also a difference in the way histone H1 becomes phos-phorylated between plants and BY-2 cells. In the case of cell suspension the amount of labeling seen on autoradiogramm was roughly proportional to the amount of protein on the corresponding gel (Figure D, left bottom vs. top). Whereas for the whole plants the comparison of the bands on autoradiogramm with those of corresponding
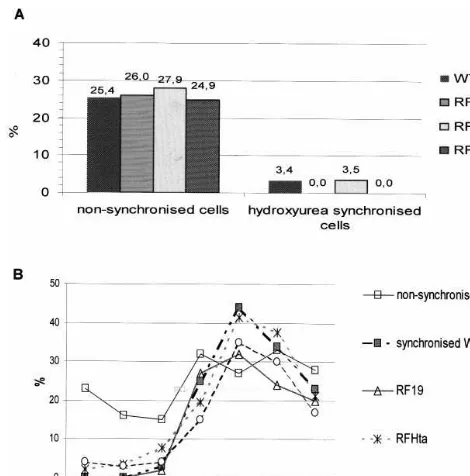
Fig. 3. Cell cycle synchronization of BY-2 cell lines. (A) Effect of hydroxyurea on the mitotic index. WT, wild type; RF19, transformed with control plasmid; RFHta, transformed with RFHta plasmid; RFH1-3%, transformed with RFH1-3%
plas-mid. (B) Cell-cycle progression after release of cells from the aphidicolin block. Description of cell lines as in (A).
4.3. Perturbations of physiological le6els and
complement of linker histones in BY-2 cells ha6e no effect on the duration of the cell cycle
To check the effect on the BY-2 cell cycle of the perturbations (by overexpression or antisense strategy) of the physiological levels and comple-ment of linker histones, different cell lines were synchronized with aphidicolin treatment. After re-lease of the cells from the aphidicolin block the mitotic index was measured at different time points. The data on Fig. 3B indicate that neither
the overexpression of Arabidopsis H1, nor the
decrease of the major variants of the native H1 affect in any way the length of the cell cycle in the perturbed BY-2 cells compared to the wild-type or control transformed cells. The mitotic index of the transformed non-synchronized cells oscillated be-tween 25 and 28% and was similar to that of the wild-type cells (Fig. 3A, left). Moreover, we estab-lished that the cellular response to the other known synchronizing agent, hydroxyurea, was similar in all lines tested and involved almost complete block in the mitotic divisions (Fig. 3A, right). We have not, however, tested further phases of the cell cycle, including the G1 phase (see Section 5 for reasons).
4.4. Effects of the perturbations of H1 le6els on morphology and ultrastructure of the BY-2 cells
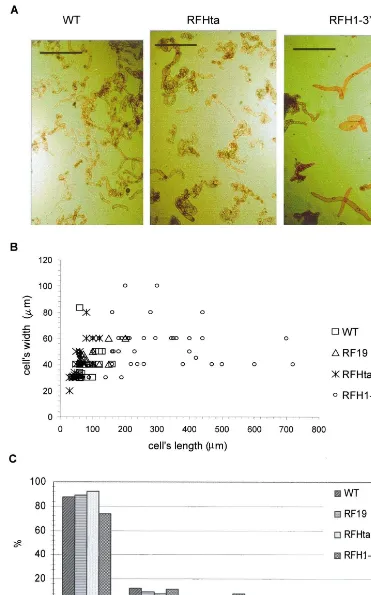
To compare the wild-type BY-2 cells with the BY-2 cells transformed with different constructs (Fig. 4A) we measured the dimensions of the cells in all cell lines. Whereas the general appearance of cells with decreased level of major somatic H1s (RFHta lines) was very similar to that of control-transformed (not shown) and wild-type cells, in
the lines overexpressing Arabidopsis histone H1
(RFH1-3%) we consistently noted a subpopulation
of cells that were considerably wider or longer than normal cells (Fig. 4B). In the total
popula-tion of the BY-2 cells overexpressing Arabidopsis
histone H1, about 20% consisted of cells that were two-to-four times longer than an average wild-type cell (Fig. 4C).
Since the cause of an altered cellular morphol-ogy could be the enlargement of the nucleus
result-ing from replication of DNA without the
following kario- and cytokinesis [26], we mea-sured, using a light microscope, the dimensions of proteins on Coomassie stained gel indicates that
the transgene-coded H1 was on average less phos-phorylated than the native H1 (Fig. 1D, left, bot-tom vs. top).
4.2. Decrease of nati6e H1 by antisense strategy
in both the transgenic tobacco plants as well as in BY-2 cell lines
Fig. 4. Morphological features of transgenic BY-2 cell lines with disturbed profile of histone H1. (A) Bright field photographs of 1-day-old cell cultures: description of cell lines as in Fig. 3A. The bar equals 500mm. Note the extreme elongation of some of the
nuclei in cells from different BY-2 cell lines. We did not find any statistically significant differences among the lines (results not shown). We also performed the flow cytometry analysis of the ploidy and the length of the DNA replication phase. No differences in these two parameters were found for wild type, control-transformed,
RFHta and RFH1-3%cell lines (results not shown).
We thus conclude that the changed morphology of the fraction of cells in BY-2 lines overexpressing H1 does not result from polyploidyzation.
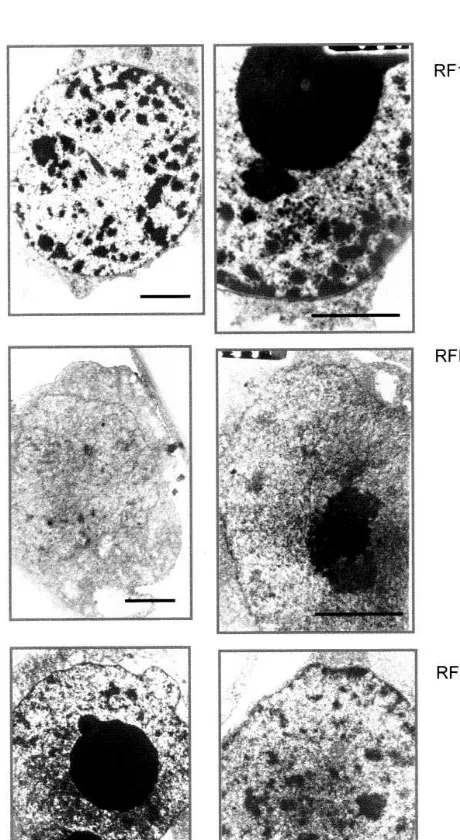
The comparison of nuclear ultrastructure using electron microscopy revealed a considerable un-dercondensation of nuclear chromatin in almost all of the RFHta cells compared to control-trans-formed cells (Fig. 5, middle vs. top). This is in keeping with the observation that chromatin from plants with decreased level of major somatic vari-ants of H1 is less condensed than chromatin from control-transformed plants [2]. Strikingly, the nu-clei of the BY-2 cells overexpressing histone H1 did not show any increase in heterochromatin content, though in some 30% of them the nuclear structure was markedly changed as compared to the nuclei from control cells (Fig. 5, bottom vs. top). The appearance of chromatin in the rest of the nuclei from this cell line resembled that of control. It was reported earlier that in plants overexpressing H1 the nuclei of the leaf cells had an unusually high content of heterochromatin [1]. These differences in the appearance of nuclei of cells in the whole plants and in the BY-2 lines may reflect a more basic difference in the intranuclear distribution of the overexpressed histone H1 (com-pare with data of Fig. 1). However, in case of the
H1 overexpressing line (RFH1-3%), we did not
attempt — for purely technical reasons — to fraction the mixed population of cells. Therefore, as the samples used for electron microscopy pro-vided sections to thin for the determination whether they came from large or ‘normal’ cells, we could not be sure about the origin of each particu-lar nuclei, which we observed under the electron microscope.
In order to analyze the features of actin- and tubulin containing cytoskeletal elements in the BY-2 cells we used fluorescent microscopy. For detection of actin microfilaments cells were stained
with phalloidin conjugated with rodamin
(TRITC). For visualization of microtubules cells were treated with mouse anti-tubulin antibodies complexed with fluoresceine. DAPI was used as a counterstain for DNA, allowing the observation of mitotic events taking place within the cell. We have not discovered any significant differences in the appearance of actin microfilaments or mitotic spindle microtubules in wild type or control trans-formed cells and cells with perturbed linker his-tones (results not shown). However, the staining with anti-tubulin antibodies revealed a subtle but highly reproducible changes in the organization of cortical microtubules in the H1 overexpressing and
Fig. 5. Transmission electron microphotographs of nuclei of different BY-2 cell lines. Magnification: left side, 8000×; right side, 14 000×. Bar equals 5mm. Note the
decondensa-tion of chromatin in the nuclei of RFHta cells and the changed chromatin morphology in the nuclei of RFH1-3%cells
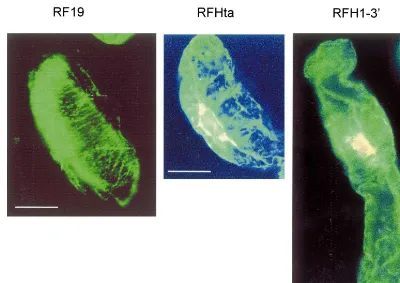
Fig. 6. Immunofluorescence microphotographs of the BY-2 cells of treated with anti-tubulin mouse antibody and FITIC. Description of cell lines as in Fig. 3A. Bar equals 30 mm. Note the disorganization and relatively small number of cortical
microtubules crossing the cell transversally in the RFHta and RFH1-3%cell lines as compared to the RF19 cell line.
H1A/H1B deficient lines as compared to wild type
and control-transformed lines. These changes were most pronounced in cells with abnormal shape found in the H1 overexpressing cell line and in-cluded a slight but evident decrease in the number of cortical microtubules crossing the cell trans-versely beneath the cell wall as well as a more frequent occurrence of the long cable-like micro-tubules (Fig. 6).
5. Discussion
We have reported earlier that transgenic to-bacco plants with perturbed level of linker his-tones were capable of normal vegetative growth, but showed characteristic anomalies in flower de-velopment [1,2]. These anomalies were most strongly manifested in plants with decreased level of the major variants of H1 (H1A and H1B) and abnormally high level (due to a compensation effect) of the minor and less charged variants of H1 (H1C to H1F). The characteristic feature of these plants was a defective male gametogenesis resulting in the male sterility. We have also
no-ticed that in certain plants that overexpressed the major variants of H1, the defects in the normal development of flower were accompanied by anomalies in growth rate and size of the cells and
in nuclei/chloroplast proportion [10]. In order to
identify the possible causes of the mutant pheno-types observed in whole plants, we decided hereby to analyze the effects of perturbation of linker histone level in tobacco BY-2 suspension-cultured cells. By using non-differentiating cells rather than organisms, we hoped to establish to what extent the underlying cause of the organismal defects could be the aberrations occurring already on the level of basic cellular functions.
Similarly as in the case of tobacco plants, trans-formation with appropriate vectors resulted in the viable transgenic BY-2 cell lines that overex-pressed the major variants of H1 or showed a decreased level of the major variants, partially compensated by an increased level of the smaller minor variants. However, there was an important difference between tobacco plants and cell lines
that overexpressed the major variant of Arabidop
-sis H1. In plants the overexpression of the Ara
corresponding native variants, whereas in cell lines the overexpression of the transgene had no effect on the level of native variants (Fig. 1). This could reflect a difference in the location of the
overex-pressed protein in chromatin depending on
whether the cells are part of the whole plant or form the individual cell lines. Supporting such conclusion is the different appearance of nuclei of cells from H1 overexpressing plants and BY-2 lines (Fig. 5). In parenchymal cells from the whole plants the overexpression of H1 results in consid-erable increase in heterochromatin density but only in the selected areas of the nuclei. A more diffuse appearance of heterochromatin in BY-2 cells could indicate that an extra H1 is more evenly distributed between chromatin binding
sites. The noticeable difference between the
changed nuclear structures within the morphologi-cally varied population of cells overexpressing his-tone H1 (with approximately 30% of them showing changes, and the rest resembling controls) could be one of the factors contributing to the phenotype of this cell line. The value of 30% coincides with the approximate percentage of the morphologically altered cells in this line, although this is only a rough correlation, and not a firm evidence. At the same time, almost all nuclei of the other cell line, RFHta, did show an altered chro-matin structure under the electron microscope (Fig. 5, middle), though in this line there was no marked morphological aberration. In order to in-vestigate the link between the changed nuclear structure and altered cellular morphology, one needs more through analysis of the identity of
RFH1-3% cell’s nuclei.
The difference in location could also explain the lower susceptibility to phosphorylation of the H1 overexpressed in plants compared to the H1 over-expressed in BY-2 cells (Fig. 1D), although this effect could also result from apparently stronger H1 phosphorylation in BY-2 cell cultures than in corresponding whole plants.
We did not see any effect of the perturbation (either by overexpression or by antisense strategy) of the proportion of linker histone variants on the cell cycle of BY-2 cells. There was no change in the mitotic index of the non-synchronized cells or in the duration of the cell cycle measured after synchronization of the cell lines, as well as in their initial response to the blocking agent (Fig. 2). One should note, that the aphidicolin synchronization
of the BY-2 cells provided only partial data on the cell cycle. For instance, the G1 phase that follows the mitotic phase is not at all investigated by this method. However, our intention was to ascertain, whether the perturbation of the linker histone content would bring about the change in the tim-ing of the onset on and the exit from mitotic divisions, as it is theoretically possible, that H1 would interfere with those processes. The aphidi-colin treatment allowed for the observation of both the onset of and the exit from mitoses, as well their duration, for all experimental cell lines. We did not see any changes in this respect between cell lines with perturbed levels of histone H1, and control cell lines. For the reasons stated above we considered it not necessary to measure the DNA synthesis, which might be useful to delimit the later phases of the cell cycle.
We conclude that the induced perturbations in linker histone variants have no effect on the mi-totic cell cycle. This is in keeping with the lack of any observable anomalies in the appearance of the mitotic spindle microtubules in BY-2 cells that show a perturbed proportion of linker histones. The most pronounced difference between con-trol cells and cells with perturbed linker histones concerned the distribution of cell sizes. This differ-ence concerned only the BY-2 cells overexpressing
the major variant of Arabidopsis H1 and not the
cells with decreased level of native major variants of H1. In the population of BY-2 cells overex-pressing H1, due to some anomaly in cell growth, there was always a subpopulation of cells charac-terized by the increased cell size (Fig. 4). We ruled out that this could be the result of a polyploidyza-tion occurring due to H1 overexpression. How-ever, the examination of the cytoskeletal elements showed some small but reproducible decrease in the density of cortical microtubules in cells overex-pressing H1 and cells with decreased level of major variants of H1 compared to control cells (Fig. 6). While it is difficult to decide whether this is a cause or the effect of the changed type of growth, it should be remembered that H1 has been shown to affect both the assembly and the stability of microtubules [27,28].
ob-served concerned the cells that overexpressed the
major variant of Arabidopsis H1 and were
mani-fested as an aberrant type of growth in about 20% of the cells from the transgenic cell line. There are indications that the unusual size of these cells may be linked with decreased number of cortical micro-tubules, but more experiments are needed to confirm this observation. The aberrations in the growth of the cells but not in their ability to divide could account for the anomalies in the growth and size of cells observed in plants overexpressing H1. However, the effects observed on the cellular level do not explain the major feature of plants with decreased amount of major H1 variants and in-creased level of minor variants, i.e. an abnormal development of flowers due to defects in male gametogenesis. We conclude that this mutant phe-notype is probably caused by a change in the plant-specific developmental program that de-pends on the correct proportion of linker histone variants and may not occur in a much simpler cell suspension system.
Acknowledgements
This work was supported by Howard Hughes Medical Institute Grant No. 75195-543403, Polish Committee for Scientific Research Grant No. 6PO4A 02913 and a Polish – French Biotechnology
Center Grant No. 12/99.
References
[1] M. Prymakowska-Bosak, M. Przewl*oka, J. Iwkiewicz, S. Egierszdorff, M. Kuras´, N. Chaubert, C. Gigot, S. Spiker, A. Jerzmanowski, Histone H1 overexpressed to high level in tobacco affects certain developmental pro-grams but has limited effect on basal cellular functions, Proc. Natl. Acad. Sci. USA 93 (1996) 10250 – 10255. [2] M. Prymakowska-Bosak, J. S´lusarczyk, M. Przewloka,
M. Kuras´, J. Lichota, B. Kilian´czyk, A. Jerzmanowski, Linker histones play a role in male meiosis and the development of pollen grains in tobacco, Plant Cell 11 (1999) 2317 – 2330.
[3] J. Zlatanova, S.H. Leuba, K. van Holde, Chromatin structure revisited, Crit. Rev. Eukaryotic Gene Expr. 9 (1999) 245 – 255.
[4] Y.B. Zhou, S.E. Gerchman, V. Ramakrishnan, A. Travers, S. Muyldermans, Position and orientation of the globular domain of linker histone H5 on the nucleosome, Nature 395 (1998) 402 – 405.
[5] W. An, J. Zlatanowa, S.H. Leuba, K. van Holde, The site of binding of linker histone to the nucleosome does not depend upon the amino termini of core histones, Biochemie 81 (1999) 727 – 732.
[6] R.N. Smith, R.L. Rill, Mobile histone tails in nu-cleosomes. Assignments of mobile segments and investi-gation of their role in the chromatin folding, J. Biol. Chem. 25 (1989) 10574 – 10581.
[7] X. Shen, M.A. Gorovsky, Linker histone H1 regulates specific gene expression, but not global transcription in vivo, Cell 86 (1996) 475 – 483.
[8] A.M. Sirotkin, W. Edelman, G. Cheng, A. Klein-Szanto, R. Kucherlepati, A.I. Skouttchi, Mice develop normally without the H1 linker histone, Proc. Natl. Acad. Sci. U.S.A. 92 (1995) 6434 – 6438.
[9] A. Ramon, M.I. Muro-Pastor, C. Scazzocchio, R. Gon-zalez, Deletion of the unique gene encoding a typical histone H1 has no apparent phenotype in Aspergillus nidulans, Mol. Microbiol. 35 (2000) 223 – 233.
[10] J. S´lusarczyk, M. Prymakowska-Bosak, M. Przewl*oka,
A. Jerzmanowski, M. Kuras´, Ultrastructural organiza-tion of leaves of transgenic tobacco overexpressing his-tone H1 fromArabidopsis thaliana, Ann. Bot. 84 (1999) 329 – 335.
[11] H. Fan, M. Sugiura, A plant basal in vivo system supporting accurate transcription of both RNA poly-merase II- and III-dependent genes: supplement of green leaf component(s) drives accurate transcription of a light-responsiverbcSgene, EMBO J. 14 (1995) 1024 – 1031. [12] R.D. Duncan, J.M. Widholm, Plant cell and tissue
cul-ture, Methods Mol. Biol. 6 (1990) 33 – 36.
[13] L. Mazzolini, M. Vaeck, M. van Montagu, Conserved epitopes on plant H1 histones recognized by monoclonal antibodies, Eur. J. Biochem. 178 (1989) 719 – 819. [14] S. Panym, S. Chalkley, High resolution acrylamide gel
electrophoresis of histones, Arch. Biochem. Biophys. 130 (1969) 337 – 346.
[15] T. Murashige, F. Skoog, A revised medium for rapid growth and bioassays with tobacco tissue cultures, Phys-iol. Plant. 15 (1962) 473 – 497.
[16] U.K. Laemmli, Cleavage of structural proteins during the assembly of the head of bacteriophage T4, Nature 227 (1970) 680 – 685.
[17] S.L. Dellaporta, J. Wood, J.B. Hicks, Plant Mol. Biol. Rep. 1 (1983) 19 – 21.
[18] J. Sambrook, F.F. Fritsch, T. Maniatis, Molecular Cloning, Cold Spring Harbor Laboratory Press, Cold Spring Harbor, NY, 1989.
[19] Y.Y. Setiady, M. Sekine, N. Hariguchi, T. Yamamoto, H. Kouchi, A. Shinmyo, Tobacco mitotic cyclins: cloning, characterization, gene expression and functional assay, Plant J. 8 (1995) 949 – 957.
[20] W.H. Sheen, C. Gigot, Protein complexes binding tocis
elements of the plant histone gene promoters: multiplic-ity, phosphorylation and cell cycle alteration, Plant Mol. Biol. 33 (1997) 367 – 379.
[22] D.C. Amberg, Three-dimensional imaging of the yeast actin cytoskeleton through the budding cell cycle, Mol. Biol. Cell. 12 (1998) 3259 – 3262.
[23] M.J. Karnovsky, A paraformaldehyde-glutaraldehyde fixation of high osmolarity for use in electron mi-croscopy, J. Cell Biol. 27 (1965) 137.
[24] A.R. Spurr, A low-viscosity epoxy resin embedding medium for electron microscopy, J. Ultrastr. Res. 26 (1969) 31 – 43.
[25] E.S. Reynolds, The use of lead citrate at high pH as electron opaque stain for electron microscopy, J. Cell Biol. 17 (1963) 208 – 213.
[26] J. Traas, M. Hu¨lskamp, E. Gendreau, H. Ho¨fte, En-doreplication and development: rule without dividing?, Curr. Opin. Plant Biol. 1 (1998) 498 – 503.
[27] E. Unger, K.J. Bohm, H. Muller, H. Grossman, H. Fenshe, W. Vater, Formation of double-walled microtubules and multilayered tubulin sheets by basic proteins, Eur. J. Cell Biol. 46 (1988) 96 – 104.
[28] L. Multigner, J. Gagnon, A. van Dorsselaer, D. Job, Stabilization of sea urchin flagellar microtubules by his-tone H1, Nature 360 (1992) 33 – 39.
[29] C.P. Moehs, E.F. McElwain, S. Spiker, Chromosomal proteins of Arabidopsis thaliana, Plant Mol. Biol. 11 (1988) 507 – 515.
[30] T. Nagata, Y. Namoto, S. Hasezawa, Tobacco BY-2 cell line as the ‘HeLa’ cell in the cell biology of higher plants, Int. Rev. Cytol. 132 (1992) 1 – 30.