Elevated CO
2
provides protection from O
3
induced photosynthetic
damage and chlorophyll loss in flag leaves of spring wheat
(Triticum aestivum L., cv. ‘Minaret’)
Alison Donnelly
a,∗, Mike B. Jones
a, James I. Burke
b, Bert Schnieders
baBotany Department, Trinity College, University of Dublin, Dublin 2, Ireland
bTeagasc, Agricultural and Food Development Authority, Oak Park Research Centre, Carlow, Ireland
Received 21 July 1999; received in revised form 11 January 2000; accepted 3 February 2000
Abstract
Spring wheat (Triticum aestivum L., cv. ‘Minaret’) was grown in open-top chambers and exposed to two CO2concentrations (ambient and 680 ppmv) and two O3concentrations (ambient and ambient+50 or+90 ppbv) either from anthesis onwards or for the entire growing season. The aim of the experiment was to test whether elevated CO2could provide ‘protection’ to the crop against the damaging effects of elevated O3on flag leaf chlorophyll content and photosynthetic activity. The decline in flag leaf chlorophyll content following anthesis was unaffected by elevated CO2. However, the reduction in chlorophyll content brought about by elevated O3was less in elevated compared with ambient CO2. The rate of flag leaf photosynthesis was increased in elevated CO2and decreased in elevated O3. When elevated CO2and elevated O3were combined the decrease attributed to O3was smaller than in elevated O3at ambient CO2. These results confirm that elevated CO2provides some protection to a wheat crop against the damaging effects of O3on photosynthetic activity and chlorophyll content. However, the degree of protection varies between growing seasons and also appears to be related to the timing of exposure to elevated O3. © 2000 Elsevier Science B.V. All rights reserved.
Keywords: Elevated CO2; Elevated O3; Chlorophyll; Gas exchange; Triticum aestivum; Ireland
1. Introduction
The tropospheric concentrations of both carbon dioxide (CO2) and ozone (O3) are increasing because of human activity (IPCC, 1996). Photosynthesis is the major physiological process by which plants re-spond directly to changes in the concentration of
∗Corresponding author. Present address: Division of
Environmen-tal Science, School of Biological Sciences, University of Notting-ham, Sutton Bonington Campus, Nr Loughborough, Leicestershire, LE12 5RD, UK. Tel.:+44-115-951-6349; fax:+44-115-951-6247. E-mail address: [email protected] (A. Donnelly)
atmospheric gases (Long and Drake, 1992; Long et al., 1993). It is generally accepted that any short term increase in atmospheric concentrations of CO2 will increase the rate of photosynthesis of C3 plants as their photosynthetic apparatus is not fully saturated with CO2 under present day concentrations (Long, 1991; Webber et al., 1994). In addition, stomatal con-ductance tends to be lower in elevated CO2because of partial stomatal closure (Morison and Gifford, 1984) and so the water use efficiency (WUE) of the plant is increased as less water is lost through transpiration while more CO2is fixed in photosynthesis (Farquhar and Sharkey, 1982; Sage and Sharkey, 1987).
Elevated concentrations of O3 in the atmosphere tends to decrease the photosynthetic rate of C3plants (Amundson et al., 1987; Lehnherr et al., 1988) either by inducing stomatal closure (Heath, 1994) and restricting CO2 entry to the leaf or by entering the intercellular spaces of the leaf mesophyll and disrupt-ing cell metabolism (Heath, 1980). Cell metabolism is disrupted by the activated oxygen species which are produced as O3 instantaneously dismutases on entry into the leaf intercellular spaces. Subsequent metabolism of O3-derived activated oxygen species is dependent on the activities of several antioxidant enzymes (Rao et al., 1995). The effect of elevated O3 on cell metabolism is frequently associated with increased rates of leaf senescence and the loss of chlorophyll (Grandjean and Fuhrer, 1989; Fangmeier et al., 1994; Finnan et al., 1998; Ojanperä et al., 1998), thus reducing the duration for photosynthetic activity and resulting in a reduction in growth and yield (Soja and Soja, 1995; Finnan et al., 1996).
The mechanisms which explain the interactive effects of both elevated CO2and elevated O3on pho-tosynthetic processes in leaves are, as yet, unclear. One proposal suggests that elevated CO2 induces partial stomatal closure and so reduces the effective dose of O3 reaching the photosynthetic apparatus within the plant (Allen, 1990; McKee et al., 1995). A second proposal, suggested by McKee et al. (1995) and Mulholland et al. (1997), is that an increase in the amount of in vivo active Rubisco at elevated CO2 may provide some compensation for damage caused by moderately elevated O3. A third proposal from Rao et al. (1995), suggests that increased production of antioxidants in the leaf mesophyll at elevated lev-els of CO2, which increase the rate of destruction of active O3 as it enters the leaf, may account for the apparent protection from ozone damage.
Experiments were carried out as part of the Envi-ronmental Stress Physiology and Climate Change Ex-periment on wheat (ESPACE-wheat) project of the EU Environment and Climate Programme to test whether elevated CO2 protects spring wheat flag leaves from (a) ozone induced chlorophyll loss and (b) ozone in-duced damage to the photosynthetic apparatus, and that this is primarily the result of partial stomatal closure at elevated CO2 which reduces O3 flux into the leaf. In this experiment, spring wheat (Triticum asetivum L., cv. ‘Minaret’) was grown in open-top
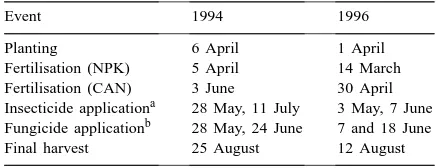
Table 1
Timetable of events during the 1994 and 1996 growing seasons
Event 1994 1996
Planting 6 April 1 April
Fertilisation (NPK) 5 April 14 March Fertilisation (CAN) 3 June 30 April Insecticide applicationa 28 May, 11 July 3 May, 7 June Fungicide applicationb 28 May, 24 June 7 and 18 June Final harvest 25 August 12 August
aInsecticide: oxydemeton-methyl (420 mls ha−1). bFungicide: flutriafol/chlorothalonil (1.5 l ha−1).
chambers at a site in Carlow, Ireland and exposed to combinations of ambient and elevated CO2 and O3. The chlorophyll content, photosynthetic activity and stomatal conductance of flag leaves of spring wheat plants exposed to elevated CO2 and elevated O3, singly and in combination, were examined over two growing seasons.
2. Materials and methods
2.1. Open top chambers and carbon dioxide and ozone treatments
1996 to include 12 OTCs and an additional (inter-mediate) CO2 treatment was added (510 ppmv). In 1996 the elevated O3 concentration was increased to ambient +90 ppbv. In 1996 there were three CO2 concentrations and two O3concentrations allowing all combinations of CO2and O3with two replicates. Fu-migation with additional CO2and O3began at anthesis in 1994 and was season-long in 1996. The exposure index, AOT40 (Accumulated Ozone exposure above a Threshold of 40 ppbv) was calculated for each grow-ing season for both ambient and elevated conditions (Table 1). The AOT40, advanced by Fuhrer (1994), is an indication of accumulated exposure to levels above a threshold which causes damage. An AOT group is the censored sum of all hourly concentrations above a certain threshold value. In this case, the threshold value is 40 ppbv which is subtracted from the value of each hourly concentration which exceeds this thresh-old before summation. However, one disadvantage of this parameter is that it masks peak O3concentrations which may have a larger effect than the AOT40 value indicates. That is, the effect of O3 is not linearly related to concentration above the threshold.
The CO2 was supplied continuously under feed-back computer control via mass flow controllers. An air sample from each OTC requiring CO2control was drawn via a diaphragm pump into an infrared gas analyser (Model WMA-2, PP Systems, Hitchin, Herts, UK) and the CO2 supply was regulated to achieve the required concentration. The O3in the elevated O3 treatment was supplied for 7 h per day and 5 days per week. O3was generated from industrial grade oxygen by electrical discharge (ABB-Ozone generator Type LN 103, Asea Brown Boveri, Baden, Switzerland) and supplied to the OTCs under manual feedback con-trol via needle valves. Air samples were taken from the chamber requiring O3control, via a Teflon mem-brane pump (Model No. N.726, KNF Neuberger, Ox-ford, UK), and lead through an ozone analyser (Model 8810, Monitor Laboratories, San Diego, CA, USA). The analyser was connected to a Campbell Scientific 21×data logger which recorded evesry 60 s and logged and averaged every 30 min.
2.2. Chlorophyll content
The chlorophyll content of 10 flag leaves, on ran-domly selected plants, was measured on a weekly
basis from full anthesis until senescence in the 1996 growing season only. Measurements were taken in the middle of the leaf using a Minolta chlorophyll meter, model SPAD-502 (Minolta Camera, 3-13, 2-Chrome, Azuchi-Machi, Chuo-Ku, Osaka 541, Japan). SPAD values were recorded from the meter and used to estimate the chlorophyll content of the leaves non-destructively. The SPAD values were con-verted to units ofmg of chlorophyll per cm2 of leaf using the following quadratic equation which best describes the relationship; Y=5.65+0.39X+0.018X2 where, Y is the extractable chlorophyll content of the leaf (mg cm−2) and X is the SPAD reading (Finnan et al., 1997).
2.3. Gas exchange measurements
The light saturated rates of photosynthesis, stom-atal conductance, transpiration and the internal (in-tercellular) concentration of CO2were determined in vivo on 10 main stem flag leaves on four occasions in 1994 and on two occasions in 1996 at times between anthesis and grain filling. Measurements were made in the middle section of leaves that did not show any visible signs of senescence. An LCA4 photosyn-thesis system (Analytical Developments Company) was used in 1994 to determine the gas exchange pa-rameters and a LI-Cor 6200 (LI-COR, Lincoln, NE) portable photosynthesis system was used in 1996. Photosynthesis measurements were carried out on dry and sunny days between 11.00 and 15.00 hours to ensure light saturation in 1994, as an artificial light source was not used during this growing season. PAR (Photosynthetically Active Radiation 400–700 nm) was in excess of 1800mmol m−2s−1 in 1994 and 2000mmol m−2s−1 in 1996 using an artificial light source (Li-Cor QB-1205LI Hybrid Lamp). There was no direct temperature control of leaves, but it was found that when using the artificial light source the leaf temperature did not fluctuate significantly during a set of measurements.
2.4. Statistical analysis
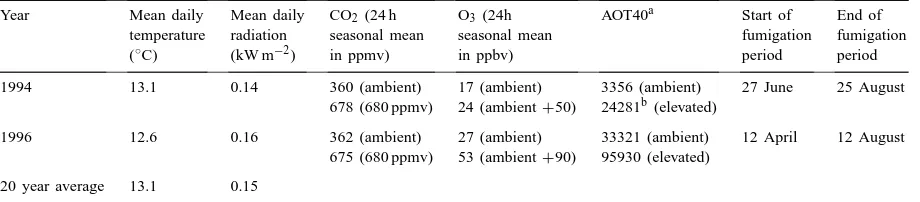
Table 2
Seasonal climate data, CO2 and O3 concentrations, exposure duration period together with AOT40 values for the 1994 and 1996 growing
seasons
Year Mean daily Mean daily CO2 (24 h O3 (24h AOT40a Start of End of
temperature radiation seasonal mean seasonal mean fumigation fumigation
(◦C) (kW m−2) in ppmv) in ppbv) period period
1994 13.1 0.14 360 (ambient) 17 (ambient) 3356 (ambient) 27 June 25 August 678 (680 ppmv) 24 (ambient+50) 24281b(elevated)
1996 12.6 0.16 362 (ambient) 27 (ambient) 33321 (ambient) 12 April 12 August 675 (680 ppmv) 53 (ambient+90) 95930 (elevated)
20 year average 13.1 0.15
aAccumulated ozone exposure above a threshold of 40 ppbv. bFumigation started at anthesis.
of variance (ANOVA) using the statistical package Minitab, version 8.3 extended, for personal comput-ers. When the multiway ANOVA showed a statis-tically significant effect of one of the parameters a oneway analysis of variance was carried out to re-veal at what level the effect was significant. In such cases a two-sided confidence interval for the differ-ences between the treatment means and the control or for all pairwise differences between level means, was constructed. Data for the intermediate CO2 con-centration (510 ppmv) in 1996 have been omitted from the results in order to make direct comparisons with the 1994 data as there was no intermediate CO2 concentration used in that year.
3. Results
3.1. Climate and CO2and O3concentrations
Table 2 shows daily mean values of temperature and radiation, in addition to the 24 h seasonal mean for CO2(ppmv) and O3(ppbv), the exposure duration period together with AOT40 (Fuhrer, 1994) values, for both growing seasons. The exposure index AOT40 was calculated for each growing season for both am-bient and elevated conditions. The 24 h seasonal mean ambient O3concentration was lower in 1994 than in 1996. The elevated O3 concentration was increased from ambient+50 to ambient+90 ppbv in 1996, re-sulting in higher mean O3 concentrations. The 1994 growing season had the lower AOT40’s, primarily
be-cause of dull weather conditions and associated low ambient O3 concentrations, as well as the fact that elevated O3 exposure did not start until anthesis (27 June). In 1996 a higher AOT40 at ambient O3 was recorded as a result of a combination of climatic con-ditions favouring O3production and the longer dura-tion of exposure. The higher AOT40 at elevated O3 was, in addition, the result of the elevated treatment being raised to ambient+90 ppbv. Neither the mean daily temperature nor the mean daily radiation values differed greatly from the long term average (Table 2). The 24 h seasonal mean CO2 concentration did not differ from the desired concentrations during either of the growing seasons.
3.2. Chlorophyll content
Fig. 1. The flag leaf chlorophyll content (mg cm−2) in the 1996 growing season. (d) ambient CO2/ambient O3, (j) 680
CO2/ambient O3, (s) ambient CO2/elevated O3, (h) 680
CO2/elevated O3. Each point represents 10 measurements and bars
are±1 standard error of the mean. ** denotes a significant dif-ference between the control and the ambient CO2/elevated O3
treatment at p<0.01.
3.3. Flag leaf photosynthesis
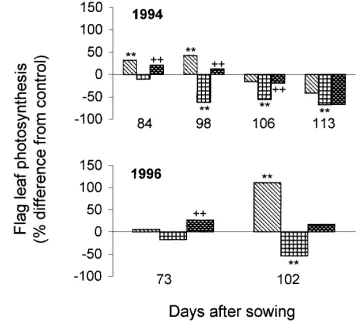
The light saturated rate of flag leaf photosynthe-sis was measured under ambient light conditions (>1800mmol m−2s−1) in 1994 and under artificial light conditions (>2000mmol m−2s−1) in 1996. After anthesis in both growing seasons, flag leaf photosyn-thetic rates were increased in elevated CO2 (p<0.01) in ambient O3 compared with the control (Fig. 2, Table 4) irrespective of the timing of exposure. How-ever, in 1994, from 106 days after sowing onwards this effect is absent. Elevated CO2also increased the photosynthetic rate in elevated O3 compared with the control in both growing seasons, but this effect persists for a longer period in 1994. The decline in photosynthetic rates in response to elevated O3 was apparent, irrespective of whether exposure started at anthesis (1994) or was season-long (1996) (Fig. 2). The effect of O3 became greater as senescence pro-gressed. In the 1994 growing season, the CO2×O3
Table 3
Effects of elevated CO2 and elevated O3on the chlorophyll content (mg cm−2) of spring wheat flag leaves in the 1996 growing seasona
ANOVA d.f. Chlorophyll content (mg cm−2)
1996 (days after sowing) 66 78 85 92 99 106 113 121
CO2 1 n.s. n.s. n.s. n.s. n.s. n.s. n.s. n.s.
O3 1 n.s. n.s. n.s. n.s. n.s. p<0.05 p<0.01 p<0.05
CO2×O3 1 n.s. n.s. n.s. n.s. p<0.01 p<0.001 n.s. n.s.
aResults of ANOVA test. Note: significance represents an overall treatment effect. Anthesis was recorded at 81 days after sowing.
Fig. 2. The percentage change from control (ambient CO2,
am-bient O3) of the light saturated rate of flag leaf photosynthesis
(mmol m−2s−1) in the 1994 and 1996 growing seasons. Elevated O3 concentrations were ambient+50 ppbv in 1994 and ambient
+90 ppbv in 1996. 680 CO2/ambient O3,
ambi-ent CO2/elevated O3, 680 CO2/elevated O3. ** denotes
a significant difference between the control and any mean indi-vidual treatment at p<0.01 and ++denotes a significant differ-ence between the elevated O3 treatment and any other treatment
at p<0.01. Anthesis occurred at 81 days after sowing in both the growing seasons.
interaction was significant from 98 days after sowing onwards but there was no CO2×O3 interaction in 1996 when fumigation was season-long (Table 4).
3.4. Stomatal conductance
Table 4
Effects of elevated CO2 and elevated O3 on the photosynthetic rate, stomatal conductance and water use efficiency of spring wheat flag
leavesa
ANOVA d.f. Photosynthetic rate (mmol m−2s−1) Stomatal conductance (mmol m−2s−1) Water use efficiency
84 98 106 113 84 98 106 113 84 98 106 113
1994 (days after sowing)
CO2 1 p<0.01 p<0.001 n.s. n.s. p<0.01 p<0.01 n.s. p<0.01 n.s. n.s. n.s. n.s. O3 1 n.s. p<0.01 p<0.01 p<0.001 n.s. p<0.01 p<0.01 p<0.001 n.s. n.s. n.s. n.s. CO2×O3 1 n.s. p<0.05 p<0.001 p<0.05 n.s. p<0.001 p<0.001 p<0.05 n.s. n.s. n.s. n.s.
1996 (days after sowing) 73 102 73 102 73 102
CO2 1 n.s. p<0.01 p<0.01 n.s. p<0.05 p<0.01
O3 1 n.s. p<0.01 n.s. p<0.01 n.s. p<0.05
CO2×O3 1 n.s. n.s. n.s. n.s. n.s. n.s.
aResults of ANOVA test. Note: significance represents an overall treatment effect
response to elevated O3 at ambient CO2 was greater than the decline attributed to elevated CO2 at the latter stages of senescence (Fig. 3). The CO2×O3 in-teraction (Table 4) was apparent in the 1994 growing season only, and was such that the decrease caused by elevated O3 was greater in ambient CO2 than in elevated CO2.
Fig. 3. The percentage change from control (ambient CO2,
ambi-ent O3) of the light saturated rate of flag leaf stomatal conductance
(mmol m−2s−1) in the 1994 and 1996 growing seasons. Elevated O3 concentrations were ambient+50 ppbv in 1994 and ambient
+90 ppbv in 1996. 680 CO2/ambient O3, ambient
CO2/elevated O3, 680 CO2/elevated O3. ** denotes a
sig-nificant difference between the control and any mean individual treatment at p<0.01. Anthesis occurred at 81 days after sowing in both growing seasons.
3.5. Water use efficiency
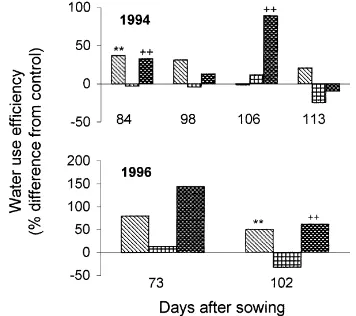
The instantaneous water use efficiency (WUE), of the flag leaves was increased in the presence of elevated CO2 at both ambient and elevated O3 irre-spective of the timing of fumigation (Fig. 4, Table 4). Elevated O3 had no significant effect on WUE
Fig. 4. The percentage change from control (ambient CO2, ambient
O3) of the light saturated rate of flag leaf water use efficiency in
the 1994 and 1996 growing seasons. Elevated O3 concentrations
were ambient+50 ppbv in 1994 and ambient+90 ppbv in 1996. 680 CO2/ambient O3, ambient CO2/elevated O3,
680 CO2/elevated O3. ** denotes a significant difference
between the control and any mean individual treatment at p<0.01 and++denotes a significant difference between the elevated O3
(Table 4) in ambient CO2 except on one occasion in 1996 (Day 102) when WUE was decreased by an average of 23% (p<0.05) across the CO2 treatments (Table 4).
4. Discussion
The 1994 growing season had the lowest AOT40’s primarily because of dull weather conditions and as-sociated low ambient O3conditions, and the fact that elevated O3exposure did not begin until anthesis (27 June). In 1996 the elevated AOT40 was higher than in 1994 as a result of a combination of climatic condi-tions favouring O3 production and the long duration of exposure.
Flag leaf chlorophyll content declined from the on-set of senescence and continues to do so throughout the life of the leaf. The chlorophyll content of the flag leaf was unaffected by elevated CO2 concentra-tions during the 1996 growing seasons. This result is consistent with those of Sage et al. (1989), Delgado et al. (1994), Nie et al. (1995) and Mulholland et al. (1997), all of whom found that long term exposure of wheat to elevated concentrations of CO2resulted in no significant changes in the chlorophyll content of the leaves. However, this lack of response is not universal as Greiner de Mothes and Knoppik (1994) reported an increase in the chlorophyll content whereas Tuba et al. (1994) and Sicher and Bunce (1997) reported a decrease in the chlorophyll content of winter wheat leaves grown at elevated CO2.
The light saturated rate of flag leaf photosynthesis was increased in elevated CO2 at both ambient and elevated O3, irrespective of whether or not fumiga-tion began at anthesis (1994) or was season long (1996). This increase in photosynthetic rate has been reported by many other authors across a wide range of plants (reviewed by Lawlor and Mitchell, 1991; Idso and Idos, 1994). The results of the present study agree with Mulholland et al. (1997) who reported an increase of up to 100% in the net rate of photosynthe-sis of all leaves including flag leaf, of spring wheat (Triticum aestivum L., cv. ‘Minaret’) in response to elevated CO2 (680 ppmv). Donnelly et al. (1998) also reported a stimulation in the photosynthetic rate of juvenile wheat plants (Triticum aestivum L., cv. ‘Minaret’) in response to the elevated CO2treatment.
The increased rates of photosynthesis, in the present study, were maintained throughout the lifetime of the flag leaf, when fumigation was season long, support-ing the findsupport-ings of Arp (1991) that down regulation in photosynthetic activity is uncommon in field grown wheat with unrestricted rooting volumes. Grain yield was also increased in response to elevated CO2 in both 1994 and 1996 (Donnelly et al., 1999) as a result of an increase in the individual grain weight which can be attributed to an increase in photosynthetic rates. Elevated CO2 also stimulated grain yield in 1996 because of an increase in the number of grains per ear. However, in 1994, because fumigation with CO2 began after grain number had been determined, elevated CO2did not affect this parameter.
The decrease in stomatal conductance observed under elevated CO2 is consistent with that observed in wheat and other plants grown under elevated atmo-spheric CO2(Cure and Acock, 1986; Morison, 1987; Eamus and Jarvis, 1989). A decrease in stomatal con-ductance results in a decrease in transpiration rates in plants grown in elevated CO2 (Morison and Gifford, 1984) which in turn results in an increase in instanta-neous WUE (Rogers et al., 1983). Tuba et al. (1994) attributed a greater water use efficiency in wheat plants, grown from emergence in elevated CO2, to both a decrease in transpiration rates at lower stom-atal conductance and an increase in photosynthetic rates. In the present study, the greater WUE recorded in elevated CO2 was also attributable to an increase in the photosynthetic rate and to a decrease in stom-atal conductance. The increase in WUE in association with elevated atmospheric CO2 concentrations may be of great importance in terms of growth and yield for wheat and other plants grown in arid and semi-arid regions (Sinoit et al., 1980; Tuba et al., 1993). Under Irish climatic conditions it is unlikely that a higher WUE would be of any benefit unless summer rainfall declines markedly under climatic change conditions.
leaf chlorophyll content and reduce photosynthate pro-duction and subsequently grain yield (Finnan, 1995; Finnan et al., 1997). Nie et al. (1993) reported a similar result but they distinguished between the leaf tip re-gion which showed the greatest decline in chlorophyll content and the basal area which showed no difference in chlorophyll content between leaves exposed to ele-vated O3and those exposed to ambient O3 concentra-tions. They concluded that exposure to O3during leaf development had no effect on chloroplast development or on photosynthetic competence but that O3 affects the photosynthetic capacity indirectly by inducing the onset of chlorophyll loss (accelerated leaf senescence). The decrease in net photosynthesis of wheat flag leaves when exposed to elevated concentrations of O3is well documented (Reich and Amundson, 1985; Lehnherr et al., 1988). In the present experiment, the decrease in light saturated photosynthesis of spring wheat flag leaves at elevated concentrations of O3 was coupled with a decrease in chlorophyll content. The decrease in photosynthetic rates at elevated O3 and ambient CO2was apparent towards the end of the growing season when fumigation was season-long. Donnelly et al. (1998) reported no effect of elevated O3 on the photosynthetic rate of leaf three of wheat plants, which suggests that it has a greater effect on longer living leaves when the crop approaches maturity.
There have been few reports on the interactive effects of elevated CO2 and elevated O3 on wheat grown to maturity under field conditions. In the 1994 growing season, when fumigation began at anthesis, there was a distinct interaction between elevated CO2 and elevated O3whereby the damage attributed to ele-vated O3was greater at ambient than elevated CO2. In contrast to this, there was no interaction observed be-tween CO2and O3in the 1996 growing season when fumigation was season-long and elevated O3 caused proportionally similar damage at ambient and elevated CO2. This was despite the O3AOT40 being consider-able higher in 1996. In 1994, elevated CO2provided partial protection against O3 damage with respect to rates of light saturated photosynthesis and accelerated leaf senescence. Rudorff et al. (1996) suggest that CO2may compensate the negative effects of elevated O3by reducing photorespiration and consequently in-creasing the photosynthetic rate. Nevertheless, in the present work, as with McKee et al. (1995), elevated CO2probably afforded protection against the
damag-ing effects of elevated O3 through reducing stomatal conductance, thus reducing O3flux into the leaf. How-ever, it should be noted that Mulholland et al. (1997), found that the partial stomatal closure observed in response to elevated CO2resulted in little difference in the O3 flux to the leaves at ambient CO2and ele-vated CO2. In the present experiment, fumigation did not start until anthesis in 1994, so that the exposure duration was greatly reduced. This, combined with the lower concentration of elevated O3 used in this particular year, may have allowed the elevated CO2to protect against the damaging effects of elevated O3. In 1996 the elevated O3 concentration was increased from ambient+50 ppbv to ambient+90 ppbv. In this year, elevated CO2 provided less protection against O3 damage to photosynthesis. When elevated CO2 was present at high O3, photosynthetic rates were similar to that of the control plants but less than that at elevated CO2 in ambient O3, indicating the partially protective role of elevated CO2.
The most consistent parameter affected by elevated atmospheric O3 was the chlorophyll content of the flag leaf. Mulholland et al. (1997) also found that the chlorophyll content of the flag leaves declined faster in elevated O3 than at elevated CO2. The protection afforded by elevated CO2against O3damage ensured that the leaves remained green for a longer duration, thus providing an extended period before chlorophyll is lost through enhanced senescence. However, this protection was not always sustained, as when the concentration of O3was increased.
In conclusion, this work clearly shows that elevated CO2 partially protects spring wheat flag leaves from O3induced chlorophyll loss and reductions in photo-synthesis. However, the duration of exposure and the concentration of O3is crucial to the degree of protec-tion afforded by CO2. Elevated CO2showed the same proportionate effect at ambient and elevated O3 only when exposure was season-long but on no occasion did CO2 fully protect the chlorophyll content or the photosynthetic rates from O3damage.
Acknowledgements
References
Allen, L.H., 1990. Plant response to rising carbon dioxide and potential interactions with air pollutants. J. Environ. Qual. 19, 15–34.
Amundson, R.G., Kohut, R.J., Schoettle, A.W., Raba, R.M., Reich, P.B., 1987. Correlative reductions on whole-plant photosynthesis and yield in winter wheat caused by ozone. Phytopathology 77, 75–79.
Arp, W.J., 1991. Effects of source-sink relations on photosynthetic acclimation to elevated CO2. Plant Cell and Environ. 14, 869–
875.
Cure, J.D., Acock, B., 1986. Crop responses to carbon dioxide doubling, a literature survey. Agric. For. Meteorol. 38, 127–145. Delgado, E., Mitchell, R.A.C., Parry, M.A.J., Driscoll, S.P., Mitchell, V.J., Lawlor, D.W., 1994. Interacting effects of CO2 concentration, temperature and nitrogen supply on the
photosynthesis and composition of winter wheat leaves. Plant Cell and Environ. 17, 1205–1213.
Donnelly, A., Jones, M.B., Schnieders, B.J., Burke, J.I., 1998. The interactive effects of CO2, O3 and nitrogen on the
photosynthetic response of juvenile spring wheat plants. In: de Kok, L.J., Stulen, I. (Eds.), Responses Of Plant Metabolism To Air Pollution. Backhuys Publishers, Leiden, The Netherlands, pp. 291–293.
Donnelly, A., Jones, M.B., Burke, J.I., Schnieders, B.J., 1999. Does elevated CO2protect grain yield of wheat from the effects
of ozone stress? Z. Naturforsch C 54, 802–811.
Eamus, D., Jarvis, P.G., 1989. The direct effects of increase in the global atmospheric CO2 concentration on natural and
commercial temperate trees and forests. Adv. Ecol. Res. 16, 1–55.
Fangmeier, A., Brockerhoff, U., Gruters, U., Jäger, H.-J., 1994. Growth and yield responses of spring wheat (Triticum aestivum L., cv. Turbo) grown in open-top chambers to ozone and water stress. Environ. Pollut. 83, 317–325.
Farquhar, G.D., Sharkey, T.D., 1982. Stomatal conductance and photosynthesis. Ann. Rev. Plant Phys. 33, 317–345.
Finnan, J.M., 1995. A study of the relative importance of the concentration and duration elements of O3 exposure on the
growth and development of spring wheat (Triticum aestivum L., cv. Promessa). Ph.D. Thesis, Trinity College, Dublin, Ireland. Finnan, J.M., Burke, J.I., Jones, M.B., 1996. A time concentration
study on the effects of ozone on spring wheat (Triticum aestivum L., cv. Promessa) 1. Effects on yield. Agric. Ecosys. Environ. 57, 159–167.
Finnan, J.M., Burke, J.I., Jones, M.B., 1997. A note on a non-destructive method of chlorophyll determination in wheat (Triticum aestivum L.). Ir J. Agric. Food Res. 36, 85–89. Finnan, J.M., Burke, J.I., Jones, M.B., 1998. A time concentration
study on the effects of ozone on spring wheat (Triticum aestivum L., cv. Promessa) 3. Effects on leaf area and flag leaf senescence. Agric. Ecosys. Environ. 69, 27–35.
Fuhrer, J., 1994. The critical level for ozone to protect agricultural crops — an assessment of data from European open-top chamber experiments. In: Fuhrer, J., Achermann, B. (Eds.), Critical levels for ozone — A UN–ECE Workshop Report.
Swiss Federal Research Station for Agricultural Chemistry and Environmental Hygiene, Liebefeld-Bern, Switzerland, pp. 42–57.
Grandjean, A., Fuhrer, J., 1989. Growth and leaf senescence in spring wheat (Triticum aestivum) grown in different ozone concentrations in open-top field chambers. Physiol. Plant. 77, 389–394.
Greiner de Mothes, M.A., Knoppik, D., 1994. Effects of long-term enhanced CO2 partial pressure on gas exchange parameters
and saccharide pools of wheat leaves. Photosynthetica 30 (3), 435–445.
Heath, R.L., 1980. Initial events in injury to plants by air pollutants. Ann. Rev. Plant Phys. 31, 395–431.
Heath, R.L., 1994. Possible mechanisms for the inhibition of photosynthesis by ozone. Photosynth. Res. 39, 439–451. Idso, K.E., Idos, S.B., 1994. Plant responses to CO2 enrichment
in the face of environmental constraints: a review of the past 10 years’ research. Agric. For. Meteorol. 69, 153–203. Climate change 1995. In: Houghton, J.T., Meira Filho, L.G.,
Callander, B.A., Harris, N., Kattenberg, A., Maskell, K. (Eds.) The Science Of Climate Change. IPCC, Cambridge University Press, Cambridge.
Lawlor, D.W., Mitchell, R.A.C., 1991. The effects of increasing CO2on crop photosynthesis and productivity: a review of field
studies. Plant Cell and Environ. 14, 807–818.
Lehnherr, B., Machler, F., Grandgean, A., Fuhrer, J., 1988. The regulation of photosynthesis in leaves of field grown spring wheat (Triticum aestivum L., cv. Albis) at different levels of O3 in ambient air. Plant Physiol. 88, 1115–1119.
Long, S.P., 1991. Modification of the response of photosynthetic productivity to rising temperature by atmospheric CO2
concentrations: has its importance been underestimated? Plant Cell and Environ. 14, 729–740.
Long, S.P., Baker, N.R., Raines, C.A., 1993. Analysing the response of photosynthetic CO2 assimilation to long-term
elevation of atmospheric CO2concentration. Vegetatio 104/105,
33–45.
Long, S.P., Drake, B.G., 1992. Photosynthetic CO2 assimilation
and rising atmospheric CO2 concentrations. In: Baker, N.R.,
Thomas, H. (Eds.), Topics In Photosynthesis, Vol. II. Elsevier, Amsterdam, pp. 69–95.
McKee, I.F., Farage, K.P., Long, S.P., 1995. The interactive effects of elevated CO2 and O3 concentration on photosynthesis in
spring wheat. Photosynth. Res. 45, 111–119.
Morison, J.I.L., Gifford, R.M., 1984. Plant growth and water use with limited water supply in high CO2 concentrations I. Leaf
area, water use and transpiration, water use and transpiration. Aust. J. Plant Physiol. 11, 361–384.
Morison, J.I.L., 1987. Intercellular CO2concentration and stomatal
response to CO2. In: Zeiger, E., Farquhar, G.D., Cowan, I.R.
(Eds.), Stomatal Function. Stanford University Press, Stanford, CA, pp. 229–251.
Mulholland, B.J., Craigon, J., Black, C.R., Colls, J.J., Atherton, J., Landon, G., 1997. Impact of elevated atmospheric CO2and
O3on gas exchange and chlorophyll of spring wheat (Triticum
Nie, G.-Y., Tomasevic, M., Baker, N.R., 1993. Effects of ozone on the photosynthetic apparatus and leaf protein during leaf development in wheat. Plant Cell and Environ. 16, 643–651. Nie, G.-Y., Long, S.P., Garcia, R.L., Kimball, B.A., Lamorte,
R.L., Pinter, P.J., JR., Wall, G.W., Webber, A.N., 1995. Effects of free-air CO2 enrichment on the development of the
photosynthetic apparatus in wheat as indicated by changes in leaf proteins. Plant Cell and Environ., 18, 855–864.
Ojanperä, K., Pätsikkä, E., Yläranta, T., 1998. Effects of low ozone exposure of spring wheat on net CO2 uptake, Rubisco, leaf
senescence and grain filling. New Phytol. 138, 451–460. Rao, M.V., Hale, B.A., Ormond, D.P., 1995. Amelioration of ozone
induced oxidative damage in wheat plants grown under high carbon dioxide. Plant Physiol. 109, 421–432.
Reich, P.B., Amundson, R.G., 1985. Ambient levels of ozone reduce net photosynthesis of tree and crop species. Science 230, 566–570.
Rogers, H.H., Thomas, J.F., Bingham, G.E., 1983. Response of agronomic and forest species to elevated CO2. Science 220,
428–429.
Rudorff, B.F.T., Mulchi, C.L., Lee, E., Rowland, R., Pausch, R., 1996. Photosynthetic characteristics of wheat exposed to elevated O3 and CO2. Crop Sci. 36, 1247–1251.
Sage, R.F., Sharkey, T.D., 1987. The effect of temperature on the occurrence of O2 and CO2 insensitive photosynthesis in field
grown plants. Plant Physiol. 84, 658–664.
Sage, R.F., Sharkey, T.D., Seemann, J.R., 1989. Acclimation of photosynthesis to elevated CO2in five C3species. Plant Physiol.
89, 590–596.
Sicher, R.C., Bunce, J.A., 1997. Relationship of photosynthetic acclimation to changes of Rubisco activity in field-grown winter wheat and barley during growth in elevated carbon dioxide. Photosyn. Res. 52, 27–38.
Sinoit, N., Hellmers, H., Strain, B.P., 1980. Growth and yield of wheat under carbon dioxide enrichment and water stress conditions. Crop Sci. 20, 687–690.
Soja, G., Soja, A.-M., 1995. Ozone effects on dry matter partitioning and chlorophyll fluorescence during plant development of wheat. Water Air Soil Pollut. 85, 1461– 1466.
Tuba, Z., Szente, K., Nagy, Z., Csintalan, Z.S., Koch, J., Kemeny, K., Laitai, E., Masarovicova, E., Takacs, Z., 1993. The response of Hungarian loess grassland species to long-term elevated CO2
(Ecophysiological responses to the first 9.5 months exposure). Hun. Agric. Res. 2, 37.
Tuba, Z., Szente, K., Koch, J., 1994. Response of photosynthesis, stomatal conductance, water use efficiency and production to long-term elevated CO2in winter wheat. J. Plant Physiol. 144,
661–668.
Webber, A.N., Nie, G.-Y., Long, S.P., 1994. Acclimation of photosynthetic proteins to rising atmospheric CO2. Photosynth.