echnology
T
ournal of
J
Journal of Technology Education
Editor JAMES LAPORTE, Technology Education, 144 Smyth Hall, Virginia Polytechnic Institute and State University, Blacksburg, VA 24061-0432 (540) 231-8169 Internet: [email protected]
Associate Editor MARK SANDERS, Virginia Polytechnic Institute and State University
Assistant ANN HUTCHENS, Virginia Polytechnic Institute and to the Editor State University
Editorial Board SHARON BRUSIC, Virginia Polytechnic Institute and State University
DENNIS CHEEK, Rhode Island Department of Education
PATRICK FOSTER, Greenway High School, Phoenix MARC DE VRIES, Pedagogical Technological College, The Netherlands
JAMES HAYNIE, North Carolina State University ANN MARIE HILL, Queens University, Canada COLLEEN HILL, Educational Consultant, Long Beach
THEODORE LEWIS, University of Minnesota STEVE PETRINA, University of British Columbia, Canada
MICHAEL SCOTT, The Ohio State University KAY STABLES, Goldsmiths University of London, England
KEN VOLK, Hong Kong Institute of Education JOHN WILLIAMS, Edith Cowan University, Australia
The views expressed in this publication are not necessarily those of the Editor or the Editorial Review Board, nor the officers of the Council on Technology Teacher Education and the International Technology Education Association.
Copyright, 1999, Council of Technology Teacher Education and the International Technology Education Association
From the Editor
From Inkwells to an Electronic Learning Community
When I was taught handwriting in elementary school, the fountain pen was the prescribed writing instrument. All of the desks in the classroom had inkwells in the upper right-hand corners (favoring right-handers, of course). The ball point pen had just been introduced, making the whole writing process easier, cleaner, and certainly less prone to accidents. Nonetheless, we were forbidden to use the ballpoint pen in those early years. The teacher felt that it represented a passing fad and that if we learned to write with a fountain pen, it would equip us with skills for a lifetime. Though it is interesting that the fountain pen is now returning to the marketplace as the writing instrument for “sophisticated” and “discerning” people, the ballpoint has been the mainstay method for manually putting ink on paper for nearly 50 years. Once I was allowed to use the ball point for my school work, I was elated with how easy it was to use. I must admit, though, that I missed the requisite pauses afforded by refilling my fountain pen and attending to the other maintenance chores it required during the arduous writing tasks that I had to complete.
A similar situation occurred when calculators were introduced. Professors insisted that we learn how to operate a slide rule, since the calculators of the time were unwieldy desktop units and were too expensive for the average person to ever purchase. Knowing how to operate a slide rule was essential since they were not only low in cost, but they were portable as well. Mastering a slide rule would most certainly have life-long usefulness.
In the early 80s, microcomputers were just making their entre’ into our lives. Investing in a computer system for our family seemed to be a rational and judicious decision, especially for the homework that our three children had ahead of them. I wondered, though, if my wife and I had made a purchasing mistake, for in these early years of the computer several of the teachers that taught our children forbade the use of a computer for doing homework assignments. I remember vividly how perplexed and distraught I was when I found that our son was doing his writing assignments with the word processing software that came with our computer, printing his work, and then transcribing it in hand writing to meet the teacher’s requirements. Even though already
mastered, doing more handwriting would most certainly elevate a person to a higher level of fulfillment over the course of a lifetime.
bit jealous about how little time it took them to do background research for a paper they were writing compared to what I had to endure. I wanted them to use the library, just as I had been required to do. I guess it was sort of like the reasoning that football games are in a stadium, religious services are in a place of worship, and book research is done in a library. Even though I prided myself in embracing new technology and applying it, I had not really conceptualized the library beyond the bricks and mortar. I had thought of the Web and the physical library as useful, but somewhat dichotomous entities.
Just as the transition away from fountain pens, slide rules, and handwriting caused a change in behavior on our part, so does the use of the Web as a scholarly resource. In the conventional library there is a tradition of control from several different fronts over the quality and nature of the volumes available. Publishers make decisions on the books they produce so that they maintain their market and carry on the reputation of the company in terms of accuracy and quality. Libraries purchase materials that are consistent with the interests and needs of the communities they serve and reflect those communities’ mores. Popular magazines generally apply editorial standards to what they publish to maintain credibility among their readership and nurture subscriptions. Scholarly journals, such as the JTE, maintain quality and focus through the refereeing process.
Alternatively, the Web is a totally uncontrolled storehouse of information. There are no restrictions to what is available. Though pornography on the Web is a popularly known problem, especially in educational circles, it goes far beyond that single issue. On the other hand, the Web is an awesomely wonderful resource. It is imperative that we not restrict students’ use of Web references in an artificial or superficial manner. Rather, we must teach students to become wise and informed consumers of the information that is available to them in this era of decontrol. We must help them develop the new sense of responsibility that comes with the widespread availability of information. Though we have a long way to go before most of the information in the world is available electronically, it seems quite plausible that the day will arrive relatively soon.
One way to assess the validity of information and extend our knowledge is through discourse with one another as members of a learning community. The pervasiveness of the Web and email has enabled us to shrink the world even further and to make it more personal at the same time. Beginning with this issue, each author has the option of including an email address in the byline of the article. Though this is not a new practice among scholarly journals, it is
agreeably not yet widespread. It assuredly offers to us a unique way of nurturing the members of our learning community. And most certainly, the skills that we teach to our students in using the Web and email will last them a lifetime…..
Articles
KEY FACTORS
INFLUENCING PUPIL MOTIVATION
IN DESIGN AND TECHNOLOGY
E. Stephanie Atkinson
Introduction
This article seeks to examine the relationship that exists between pupil motivation and the following internal and external factors: pupil performance in design and technology (D&T) project work, pupil skills associated with D&T project work, pupil personal goal orientation, pupil cognitive style, pupil creativity, teaching strategy, and teacher motivation. The data under discussion were collected as part of a four-year research project. The article examines the research investigated during the final year of the study when a sample of 50, 15 and 16-year-old pupils was selected from eight schools in the northeast region of England.
Data were collected throughout a GCSE1
Design and Technology (D&T) course work project. A cognitive style test and a questionnaire ascertaining each pupil’s perception of their ability and enjoyment in D&T project work were given to the sample at the beginning of the academic year. A case study approach based on observation and informal interviews was then used to monitor the pupils throughout the designing and making of their projects. Upon completion of the project, a summative questionnaire, a goal orientation index, and a creativity test were completed by each pupil. Data about the school’s internal moderated mark for each pupil’s D&T project were also collected.
In discussing the findings, the relationship between the internal factors and a pupil’s ability to perform and be motivated will be discussed. Conclusions will be drawn concerning the influence that external factors, such as assessment and teaching and learning strategies, have upon the attitude and ability of pupils, _____________________________
E. Stephanie Atkinson ([email protected]) is a Technology Coordinator at the University of Sunderland, Tyne and Wear, England.
1GCSE - The General Certificate of Secondary Education examinations are taken by pupils in England and Wales at the end of compulsory education at the age of 16. There are four separate Examination Boards. Each Board designs their own examinations within a given framework. Under normal circumstances pupils take two years to complete a GCSE examination syllabus. In D&T the examination is in two parts. A 40%
while the importance of teacher motivation in sustaining, enhancing or decreasing pupil motivation will also be targeted.
Background to the study
In schools in the United Kingdom (UK), D&T involves a complex integration of processes, concepts, knowledge, and skills (DES, 1992). As the subject area has developed, so has the use of the design process as a method of delivering and examining subject content (e.g. Design Council, 1980; DES, 1987; Kimbell, Stables, Wheeler, Wosniak & Kelly, 1991). These processes have developed out of the linear design models used in the early 1960’s (e.g. Kimbell et al, 1991). As teachers have become more experienced in working with them and as the subtlety of the process has become more apparent, the models have correspondingly become more complex. By the end of the 1980’s many models of the process had been developed (Layton, 1991). It was
acknowledged that some models became so complex that they were confusing to those who used them (Kimbell et al, 1991). In 1987 the Department for
Education and Science suggested that what was needed was a loose framework to guide designing rather than a well-defined process model which they saw as a straitjacket. This approach was supported by Lawson (1990) who stressed that designing required flexible procedures.
Educationalists would have us believe that the assessment used to judge pupils’ work should not dictate the curriculum content. Examination syllabuses should be designed to develop capability and test competence (SEC, 1986; NEAB, 1993). However, the importance of public examination results to pupils and teachers alike dictate that the nature of assessment and its criteria influence what is learned and how it is taught (Scott, 1990; Gipps, 1990). Additionally, the recent need for accountability in the UK has meant that assessment has become overly objective (Wiliam, 1992). As far as GCSE examination syllabuses for Design and Technology have been concerned, this has lead to the use of a prescriptive design process with a very specific list of criteria to be met. Layton (1991) aptly suggested that if teachers were not careful, the process could impose “a procrustean regime” (Layton, 1991, p 5) on the way pupils designed. Pupils have become outcome driven, with the process becoming a series of products. To obtain good examination grades pupils have had to provide evidence that each stage of the specified process has been addressed, irrespective of whether it was appropriate to the design of their particular product or not.
In the UK throughout the 1970’s and 1980’s it was generally believed that designing and making in the form of project work was an exciting and
able to complete their work and therefore appeared to be successful. Other writers (e.g. DES, 1992; Grieve, 1993; Hendley & Jephcote, 1992) and many teachers placed the blame for the problems on the introduction and
implementation of the National Curriculum.
In addition to the approach taken to designing, research has indicated that a complex pattern of factors affect a pupil’s performance, learning, and motivation (Kimbell et al, 1991; Naughton, 1986; DES, 1989; NCC, 1993). There are those attributes that a pupil brings with them: their gender, general ability, creative ability, cognitive style, personal goals, knowledge base, and curriculum
experience. There are also the attributes of the task itself: its contextual location, its structure, and its likely demands upon the pupil. In the context of D&T, the complex relationship among all these factors and such external forces as culture, context, and parental and teacher expectations cannot be underestimated. Nor can the effect of attitude upon motivation be ignored. Attitudes towards success and failure have a significant bearing upon motivation for both teacher and learner. To identify which attitude has caused motivation or demotivation and then to determine whether attribution could be considered to have been internal or external, stable or fluctuating, and whether it could have been controlled or was uncontrollable is a difficult task (Weiner, 1992).
The theory concerning self-efficacy and personal causation would suggest that individual’s have the ability to influence events in their life (Rotter, 1966). In an educational context it has been shown that academically successful pupils are inclined to have an internal locus of control (Atman, 1993). These pupils tend to believe that they are responsible for their own success, while pupils who fail to achieve academic success have an external locus of control and tend to blame their poor results on external factors such as their teacher. McClelland (1961) indicated that those who were academically successful displayed a need for achievement. In addition, he explained that they were able to set goals, determine how to reach them, use data for decision making, delay the reward, and assume personal responsibility for their own behavior. Atman’s research during the 1980’s led to the development of an instrument that could determine the level of an individual’s goal achievement proficiency (Atman, 1993). Her index was designed to provide an individual score for each of the interwoven stages of reflecting, planning, and acting which she, and others, explained were important behavioral characteristics needed in order to accomplish goals. She believed that an understanding of goal orientation was important for design and technology educators as inherent in the design process were two assumptions: (1) that pupils must be able to identify and solve problems and (2) be able to set and accomplish goals.
defined as the tendency for individuals to process information in wholes or in parts; the Verbalizer-Imager style has been defined as the tendency for indivi-duals to represent information during thinking verbally or in images. The appropriateness to this study of this categorization of cognitive style can be more easily appreciated when the activity of designing is examined further. The perception and evaluation of information, be it in wholes or in parts, in images or in words, form an integral and important part of the design process used in D&T project work. With regard to the connection between the Wholist-Analytic cognitive style dimension and designing, design methodologists have suggested that for designing to be successful, the process should be an holistic experience (e.g. Kimbell et al, 1991; McCormick et al, 1993; Atkinson, 1997; 1998; NEAB, 1993). Over concern with individual discrete elements “…has frequently emasculated it [the process] by ripping it apart in quite unnatural and unnecessary ways.” (APU, 1994, p. 61). Interpretation of this belief in the context of cognitive style would suggest that those at the wholist rather than analytic end of the Wholist-Analytic dimension should make the best designers.
The relationship between designing and the Verbalizer-Imager cognitive style dimension can be understood when one considers the fact that imagining has been shown to be central to the generation and development of ideas (e.g. Kimbell et al, 1991; Garner, 1989; Chidgey, 1994, Liddament, 1993; Barlex, 1994). Glegg (1986) suggested that “…the subconscious has no vocabulary” (p. 87). He explained that when generating ideas in a design situation it was “... important to realize that our subconscious minds will hand up their suggestions in the form of symbols or pictures” (Glegg, 1986 p. 87). In this instance one would expect that those whose cognitive style was situated at the imaging rather than verbalizing end of the Verbalizer-Imager dimension should make the best designers. When a combination of both cognitive style dimensions was considered one would therefore anticipate that Wholist-Imagers should have a potential advantage over pupils in other cognitive style groupings in the context of D&T project work.
During the study it became apparent that delivery programs devised by each school had the potential to be problematic in terms of pupil motivation during their examination project work. The intention of each program was to enable pupils to cover all aspects of the examination syllabus. Each school followed examination guidelines and allowed the same number of teaching hours for the project work. However, in certain schools the examination theory work and the project work were run concurrently while in others one element of the syllabus was dealt with at a time. These two models provided pupils with very different overall time scales for their project work. In some schools the project work was finished in a short period of time while in others it stretched over a full academic year. It was also noted that the actual amount of time used to complete the work did vary greatly from pupil to pupil. The differences were accounted for by the amount of “extra” time each pupil was willing to spend on their project both at home and in school.
influenced by the Examination Board’s documentation and the teaching strategies adopted by individual teachers. Observation indicated that teachers tended to utilize one of two strategies to enable their pupils to meet deadlines and address the specified assessment criteria. In one of the strategies the teacher tended to act as a collaborator, while in the other a more ‘interventionist’ mode of teaching was adopted.
In schools where teachers utilized an “interventionist” approach, pupils tended to move very quickly from designing to the manufacturing stage. Very few pupils produced carefully detailed drawings. Development of the chosen idea was carried out as manufacturing took place. Pupils lost ownership of their project, as decisions were made in a piecemeal, “interventionist” manner by the teacher. Ill-defined, but often in the context of the pupil’s existing technological or constructional understanding, adventurous ideas meant that pupils were working in areas beyond their technological capability. This led to many disillusioned pupils and poorly-made, unfinished outcomes.
In schools where teachers exhibited what has been defined as the
“collaborative” model, time was given to individual pupil-teacher discussions. Designing and making were a “collaborative” effort in which pupils were able to retain ownership of their project throughout the process. However, for some pupils there were disadvantages associated with this model. The problems tended to center around boredom. Pupils saw the design process stretching interminably ahead of them. The manufacturing stage to which they looked forward seemed an impossible target to reach. This caused a noticeable slowing down of work rates that only exacerbated the situation. For these pupils, deadlines came and went.
Against this complex background the relationship that existed between pupil motivation and certain identified internal and external factors was examined.
Method Population and Sample
The initial sample of schools used in the study was a non-probability, purposive sample of 150 schools in seven Local Education Authorities
(Atkinson, 1993). These schools were used by technology students on an Initial Teacher Training program at a University in the northeast area of England. From this sample 50 schools were selected using data from the Education Authorities Directory and Annual (1992) in order to provide a balance of size, type, and location of school. A questionnaire seeking pertinent background information was sent to each Head teacher and Head of D&T. Forty-five of the 50 schools returned the questionnaire. Analysis of the data enabled a final sample of eight schools to be selected. This selection was carried out in two stages. In the first instance, in order to avoid sampling bias, only schools that offered all three D&T GCSE examinations2
were considered. The second stage used a four cell matrix based on the location of the school (inner city or large town/suburbia or
small town) and the size of 10th grade (Over 125/Under 125). The size of each school’s population was not used as a sampling mechanism since the range of ages was variable from school to school. Some schools were 11-16, some were 11-18 while others were 13-18. This meant that schools of the same size did not necessarily have parity between the size of their 10th grade cohort.
The sample of pupils reported in this study initially involved 112, 15 to 16-year-old pupils (85 boys and 27 girls) and their D&T teachers in the eight targeted schools. The research was carried out during the first year in which it was compulsory for all 15 and 16-year-old pupils to study D&T as part of the National Curriculum. This made it possible for the eight teachers to select a single mixed-ability class from their school and for that chosen class to be representative of the 15 and 16-year-old cohort within that particular school. After an initial data collection period, 50 pupils (36 boys and 14 girls) were selected from the targeted sample using a matrix of eight pupil types. This was based upon data concerning a pupil’s cognitive style, their ability to design, and their perceived enjoyment of designing and making. These pupils were then observed on a regular basis for the duration of the D&T examination project work with the intention of identifying some of the causes of pupil demotivation3
that were becoming a concern to teachers and educationalists in the UK.
Instrumentation
The following data gathering instruments were used in the study. Research instruments that provided quantitative data:
• Appropriately tried and tested questionnaires – administered before and after the D&T project work.
• GCSE examination marks for the D&T project work. The distribution of marks for the sample were checked against the normal distribution curve achieved by the total examinees for the GCSE D&T examination and were found to be similar.
• A computer presented, self administered Cognitive Style Analysis (CSA) designed by Riding (1991). This assessed two fundamental ways of thinking and working (cognitive style dimensions): wholist-analytic and verbal-imagery. The validity of the instrument was supported by “ ... the finding of significant relationships between style and a range of school learning performance (e.g. Riding & Caine, 1993; Riding & Douglas, 1993; Riding & Mathias, 1991; Riding & Sadler-Smith, 1992;)” (Riding, Burton, Rees & Sharratt, 1995, p. 115).
• A goal orientation test that set out to assess important behavioral characteristics associated with accomplishing personal goals. This was based on an index designed by Atman (1986). To provide construct validity Atman had undertaken “...correlation studies with several
3The definition for demotivation is taken from the New Shorter Oxford English
known instruments (e.g. Jackson Personality Inventory, the Bass
Orientation Index, Nideffer’s Test of Attentional and Interpersonal Style, the Myers-Briggs Type Indicator)” (Atman, 1993, p. 4).
• A creativity test in two parts. The first section was used only to stimulate the pupil’s creativity and was not scored. It was taken from De Carlo’s (1983) Psychological Games. The second section was based on the then unpublished doctoral work of Oxlee (1996). This test was particularly appropriate to testing creativity in the context of design activity, although the present author recognized that proof of its validity was minimal since it had been developed by Oxlee so recently.
72 Categorization of pupils as motivated or unmotivated. This was established as an on-going process throughout the observation period. Pupil motivation was determined using a rating scale. A researcher response to each criterion listed below, was located on a coding frame of fixed alternatives at the end of the observation period and a score for motivation was then calculated. This score was checked against the teacher’s perception of each pupil’s level of motivation and triangulated against data elicited from the pupil questionnaire concerning their perceived level of motivation. Judgments on levels of motivation were made using the following criteria:
- observed enthusiasm for their project; - observed pupil interaction with their teacher; - observed pupil interaction with their peers; - attendance;
- time keeping;
- ability of pupil to stay “on task” during lessons; - teacher comments on pupil’s levels of motivation; - pupil comments on their own level of motivation; - on-going scrutiny of design and practical outcomes.
• Categorization of teachers as motivated or unmotivated. This was established as an on-going process throughout the observation period. As in the case of determining pupil motivation, a rating scale was used. A response to each criterion listed below was located by the researcher on a coding frame of fixed alternatives at the end of the observation period. Additionally, a score for motivation was then calculated. Judgments on levels of motivation were made using the following criteria:
- teacher interaction with the whole class; - teacher interaction with individual pupils; - time keeping;
- teaching style;
- observed enthusiasm for the subject based on interaction with pupils; - observed enthusiasm for the subject based on interaction with
researcher;
- observed enthusiasm for project work based on interaction with pupils; - observed enthusiasm for the project work based on interaction with
Research Instruments that provided qualitative as well as quantitative data:
• Observation of project work. Observation sheets, designed by the researcher, were completed on pupil project progress and skill levels on a regular basis for the duration of the examination project work;
• Semi-structured and informal interviews. These were carried out with both pupils and teachers whenever appropriate throughout the observation period.
For the purpose of comparability between data the scores achieved by each pupil for the different tests were converted proportionally to a four-point scale, with four being the highest and one being the lowest.
Procedures
Instrumentation was developed as reported and the sample was drawn as described. The data were collected between June 1995 and May 1996. Coding and analysis of the data were carried out as each set of data was collected. The statistical analyses included percentage distribution, rank order, one sample square test of variance, unpaired comparison of averages using t–tests, chi-square test for independence, and Fisher’s Exact Test for 2x2 tables. Descriptive analysis included mean scores and line charts.
Results
The relationship between pupil motivation and pupil performance
Chi-square analysis of the data collected during the observation period indicated that a disappointingly high proportion of the total sample were unmotivated by the activity in which they were involved. The level of signifi-cance was found to be <.0001. The raw data concerning the number of pupils in each motivational category is reported in Table 1.
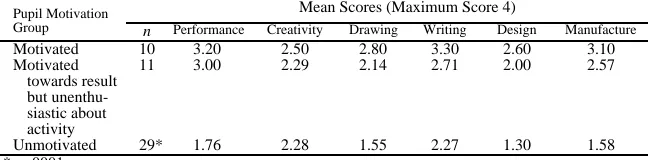
Table 1
Number of pupils and the mean score for performance, creativity, drawing skills, writing skills, design skills, manufacturing skills achieved by each motivational group
Mean Scores (Maximum Score 4)
Pupil Motivation
Group n Performance Creativity Drawing Writing Design Manufacture
Motivated 10 3.20 2.50 2.80 3.30 2.60 3.10 Motivated
towards result but unenthu-siastic about activity
11 3.00 2.29 2.14 2.71 2.00 2.57
Unmotivated 29* 1.76 2.28 1.55 2.27 1.30 1.58 *p<.0001
those who were unmotivated achieved a low mean score. These results are reported in Table 1.
The relationship between pupil skills, motivation and performance
Data collected throughout the examination project work indicated that there was a positive correlation between a pupil’s drawing, writing, design, and manufacturing skills, and their levels of motivation. Those pupils who were motivated achieved high mean scores for their drawing, writing and designing while those who were unmotivated achieved low mean scores. Results are reported in Table 1.
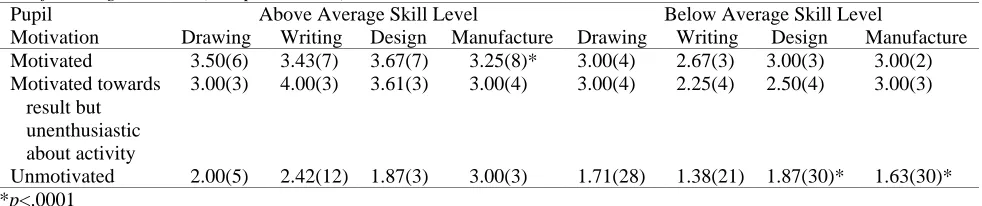
The data as shown in Table 2 indicated that those pupils who were
motivated and possessed above average design skills achieved the highest mean score in their project work, while those who were unmotivated and had below average writing skills achieved the lowest mean score.
Table 2 also indicated that a significant number of pupils who were
unmotivated had below average design skills. In the case of manufacturing skills it was found that a significant number of unmotivated pupils had below average skill levels while a significant number of motivated pupils had above average skill levels.
The relationship between personal goal orientation, motivation, and performance
In order to analyze the relationship between a pupil’s personal goal orientation, motivation, and performance, the individual scores for reflecting, planning, and acting were calculated for each pupil. The results indicated that a pupil’s ability to “act” tended to remain constant whether they achieved high or low marks. These results are reported in Table 3. However, with regard to “planning” and “reflecting” there were significant differences between those who performed well and those who did not, as indicated in Table 3.
Table 3
The mean scores (max. 4) achieved by pupils for their GCSE project work when grouped by personal goal characteristics
Average Mean Mean Scores for Mean Scores for Scores Those Who Achieved Those Who Achieved for Total Sample Low Marks High Marks
n=50 n=16 n=16
Acting 2.49 2.44 2.44
Planning 2.44 0.98* 3.00
Reflecting 2.47 0.97** 3.13
The mean project work score achieved by each motivational group when split by drawing, writing, design and manufacturing skill level (n in parentheses)
Pupil Above Average Skill Level Below Average Skill Level
Motivation Drawing Writing Design Manufacture Drawing Writing Design Manufacture Motivated 3.50(6) 3.43(7) 3.67(7) 3.25(8)* 3.00(4) 2.67(3) 3.00(3) 3.00(2) Motivated towards
result but unenthusiastic about activity
3.00(3) 4.00(3) 3.61(3) 3.00(4) 3.00(4) 2.25(4) 2.50(4) 3.00(3)
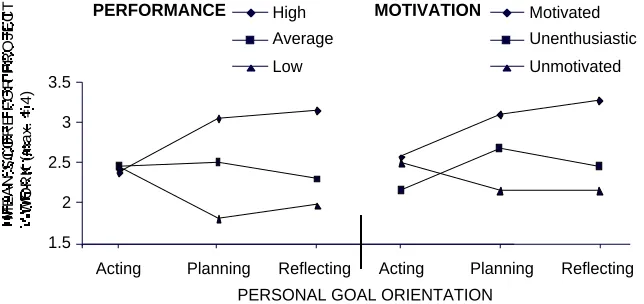
It was found that when the relationship between goal orientation and motivation was investigated it could be seen that there were similarities between the data collected and the data concerning the relationship between goal
orientation and performance as portrayed in Figure 1.
Figure 1. A comparison between the data for motivation and the data for performance split by the three behavioral characteristics: Acting, Planning and Reflecting.
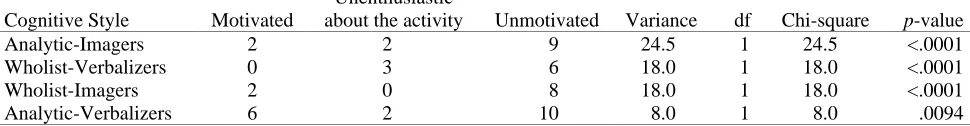
The relationship between cognitive style, motivation and performance The data collected during this research project indicated that those pupils who were Imagers and Wholists were the ones who achieved the poorest results during their project work, while the data collected also indicated that those who were analytic, whether they were Imagers or Verbalizers, tended to achieve high marks. This is portrayed in Table 4.
When the targeted sample of 50 pupils was scrutinized, 18 pupils were found to be Analytic-Verbalizers; 13 were Analytic-Imagers; 10 were Wholist-Imagers; and nine were Wholist-Verbalizers.
In the case of the Analytic-Imagers, Imagers and Wholist-Verbalizers, a significant number of them were unmotivated in comparison to those who were motivated. Analytic-Verbalizers were more evenly spread between the motivated and unmotivated categories. See Table 5 for Chi-square test results.
1.5 2 2.5 3 3.5
Acting Planning Reflecting
Motivated Unenthusiastic
Unmotivated
Acting Planning Reflecting High
Average
Low
MOTIVATION PERFORMANCE
PERSONAL GOAL ORIENTATION
The average percentage mark achieved by the original sample of 112 pupils (minus eight pupils who were withdrawn from the examination) grouped by the selection of sample factors
Enjoyed designing Enjoyed designing Preferred making Preferred making
Cognitive and can but can’t and can design and can’t design
Style Analytic Wholist Analytic Wholist Analytic Wholist Analytic Wholist
Verbalizers 75 67 40 22 64 45 43 39
Imagers 88 48 62 20 66 36 32 28
Table 5
A Chi-square test on levels of motivation for each cognitive style group Unenthusiastic
Cognitive Style Motivated about the activity Unmotivated Variance df Chi-square p-value
Analytic-Imagers 2 2 9 24.5 1 24.5 <.0001
Wholist-Verbalizers 0 3 6 18.0 1 18.0 <.0001
Wholist-Imagers 2 0 8 18.0 1 18.0 <.0001
The relationship between creativity, motivation and performance
Analysis of the data collected in this research study indicated a positive relationship between creativity and performance as portrayed in Table 6. This is in contrast to the data in Table 1 where it was shown that there was not a significant difference in the level of creativity between those pupils who were motivated and those who were unmotivated.
Table 6
The relationship between a pupil’s creativity level and performance (max. score 4)
Level of Creativity Poor Level Average Level Good Level
Performance Mean Score 1.41 2.05 2.82
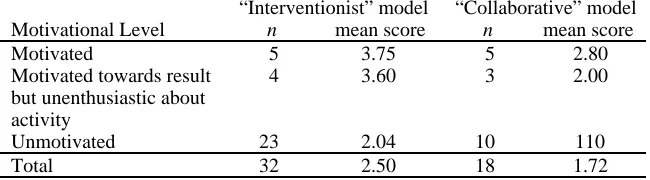
The relationship between teaching strategy, motivation and performance Table 7 illustrates the relationship that exists between teaching strategy, motivation, and performance. Pupils attained higher levels of achievement in schools adopting an “interventionist” approach. However, 72% of the pupils in those schools were found to be unmotivated in comparison to only 55% of pupils in schools adopting a “collaborative” teaching strategy.
Table 7
The mean score achieved by the sample grouped by teaching strategy and pupil motivational level
“Interventionist” model “Collaborative” model Motivational Level n mean score n mean score
Motivated 5 3.75 5 2.80
Motivated towards result but unenthusiastic about activity
4 3.60 3 2.00
Unmotivated 23 2.04 10 110
Total 32 2.50 18 1.72
It was considered that project work completion may be an indicator of levels of motivation. In the case of schools adopting an “interventionist” model there was less motivation and also a considerable number of pupils with incomplete projects when the project deadline was reached. These data are portrayed in Table 8.
The relationship between pupil motivation and teacher motivation
motivation. In each of the other five cases the teachers were found to fall predominantly at the unmotivated end of the motivational spectrum.
When the data concerning teacher motivation and pupil motivation were compared, it was found that a significant number of the sample of pupils being taught by unmotivated teachers were unmotivated themselves as indicated in Table 9.
Table 8
The percentage completion rates of pupils (n=50) in schools adopting either “interventionist” or “collaborative” teaching strategies. The Fisher’s Exact Test for 2x2 tables was also carried out on the data
“Interventionist” Model “Collaborative” Model
Completion Rate n=32 n=18
Complete 34% (11) 61% (11)
Unfinished 66% (21) 39% (7)
Fisher’s Exact p-value=.0827
Table 9
The mean score (max. 4) achieved for the examination project work grouped by teacher motivation and pupil motivation
Pupil Motivation Motivated Teacher Unmotivated Teacher
Motivated 3.40 (5) 3.00 (5)
Motivated towards result but unenthusiastic about activity
3.57 (7) 2.50 (4)
Unmotivated 1.86 (7) 1.41 (22)*
Total number of pupils 19 31
*p=<.0001
Discussion
The relationship between pupil motivation and pupil performance The data collected during this research project supports the well-documented belief that there is an association between motivation and performance (e.g. Weiner, 1992; Bandura & Dweck, 1985; Dweck & Leggett, 1988; Elliot & Dweck, 1988). Performance has been shown to affect motivation and motivation has been shown to affect performance. In the case of this study with its emphasis on GCSE examination work this belief was found to be particularly pertinent and well founded.
the end of the study it was disappointing to find that only 42% of pupils were found to be in this category and only five percent of this sub-sample was enthusiastic about the process in which they had been involved. The following discussion concerning the identified factors provides an insight into possible reasons for these findings.
The relationship between pupil skills, motivation and performance
In all schools in the sample, the lack of skills and understanding regarding processes and materials were found to present a major problem for many of the pupils during both the design and the manufacturing stage of their project work. Analysis of the evidence during the observation period suggested that pupils’ ideas, when carried through to the manufacturing stage, caused many of them to work beyond their technological and craft capability. Teachers had indicated that they were all aware of this problem. They were disappointed by the quality of the artifacts produced by the majority of their pupils. In an attempt to support all pupils throughout their project work, teachers were seen to develop a strategy in which they designed solutions to pupils’ problems in their heads, as the need arose. The necessity for many pupils to have an understanding of the direction in which they should head was given a low priority. However well intentioned this course of action may have been, the evidence would suggest that it had a demotivating effect upon many of the pupils. They became very frustrated by their inability to proceed without continuous reference to their teacher. The common belief that ownership develops a sense of responsibility, pride, and the motivation to succeed would support the use of strategies that would enable pupils to retain ownership of their idea throughout the project rather than the loss of ownership witnessed among many pupils during this research project.
The relationship between personal goal orientation, motivation, and performance
The analysis of goal orientation data indicated that there was little difference between those pupils who were motivated and those who were unmotivated with regard to their belief in their ability to act. Although it should be pointed out that unmotivated pupils could be said to have an inflated image of this ability if their poor completion rate in the project work was taken as an indication of an inability to “make it happen.”
which demanded good reflective skills and an ability to complete each stage of the process by a given time.
The relationship between cognitive style, motivation and performance
Due to the nature of the design activity central to this study, the expectation had been that Wholist-Imagers would achieve high marks for their project work. However, this was not the case, Wholist-Imagers achieved the poorest results. Analysis enabled the researcher to identify and quantify the reasons for this unexpected feature of the data. Factors concerning the design processes adopted provided an explanation for this sub-sample achieving a low mean score.
It is well accepted that for designing to be successful it should be a holistic experience. However, in order to ensure that pupils met each of the assessment criteria, teachers were seen to split the process into easily managed units of work. Observation showed that these were tackled often in isolation before the next aspect of the process was discussed. The holistic nature of the process was therefore fragmented, thus playing into the hands of those who were analytic.
Analysis of the process indicated that since drawing is such an important aspect of designing, one might have expected Verbalizers who preferred processing information verbally to achieve significantly lower marks for their projects than those pupils who preferred working with images. This was not, however, found to be the case. Not all Imagers were able to draw. Nor could the majority of Imagers rely upon their writing skills, as these skills were generally found to be unsatisfactory.
For those Imagers who avoided writing, their on-going evaluation was mainly to be found hidden in subtle forms within their drawn images. Access to a pupil’s immediate thoughts at the time of the conception of ideas was
impractical. Moreover, it was not easy to credit these thoughts objectively at a later date during the assessment process. In comparison, those who were Verbalizers communicated their thoughts in a form that was more easily interpreted by teachers during assessment, thereby gaining them praise from their teachers and valuable marks for their examination.
The relationship between creativity, motivation and performance
The data collected enabled the researcher to categorize those who were creative and those who were not creative into two sub-groups. The inherently creative could be divided further into those who were able to design within the constraints of the GCSE examination process model and those who were inhibited and unmotivated by such a structured approach. The latter group encompassed the majority of pupils and within it there were those who were neither creative nor receptive towards working with the design process models offered to them. This group was seen to become increasingly unmotivated as the project work progressed. The other sub-group was willing to accept the design methodology taught, although they too were not naturally creative. At the start of the project these pupils were motivated because they wished to produce satisfactory outcomes of which they could be proud. However, as time progressed they too became increasingly dissatisfied with the process they had been asked to adopt. This group maintained motivation by concentrating upon achieving a good examination result rather than enjoying the activity.
The relationship between teaching strategy, motivation, and performance As explained earlier, the research had identified two basic strategies that were adopted by teachers in the schools, a “collaborative” approach and an “interventionist” approach. Schools adopting “interventionist” approaches tended to use delivery programs that were completed in a short period of time. In these schools, deadlines tended to be well before the deadline set by examination boards. This provided pupils with extra time in which to complete work that was unfinished.
In schools adopting the “collaborative” model, deadlines tended to coincide with examination board deadlines. The consequence of this was that pupils did not have extra time to finish incomplete work. This had a detrimental effect upon final performance scores for these pupils. Pupils achieved lower scores in each motivational category in these schools. However, it was interesting to note that as far as motivation was concerned there was a higher percentage of motivated pupils in schools adopting a “collaborative” approach.
An analysis of the teaching strategies suggested reasons for these differences. In schools where teachers exhibited what has been defined as the “collaborative” model, time was given to individual pupil-teacher discussions. Detailing of ideas was a “collaborative” effort between pupil and teacher, with pupils retaining ownership of their idea. Many of those who succeeded in reaching the manufacturing stage of their project were able to complete their work in time for assessment. For those pupils who did not, the problems associated with this model came about through boredom. From a fairly early stage these pupils saw the design process stretching interminably ahead of them. The manufacturing stage to which they looked forward seemed an impossible target to reach. This caused a noticeable slowing down of work rates that only exacerbated the situation.
same number of hours for their projects, the evidence would suggest that the spread of this time over months rather than weeks allowed pupils access to this important maturation time. “Collaborative” approaches also gave teachers time to familiarize themselves with pupils’ projects. This enabled them to prevent some of their pupils from making unwise design decisions, whereas many teachers using “interventionist” strategies were found to be frustrated by their inability to prevent design disasters from occurring.
As far as the design folders prepared by the students to document the design process were concerned, very few were completed without considerable pressure being applied by the teachers. Motivated pupils in all schools were persuaded to re-work or “pretty-up” existing work and fill gaps in their design process. The limited time spent on the folder work in the “interventionist” model meant that the folders, of even those who believed that they could design presented little evidence of using designers’ thought processes at the various stages of the project. In an attempt to present the required evidence for assessment, pupils were encouraged to complete written sections describing their decision-making procedures. This was often carried out retrospectively on the pupils’ own time when they were pulling their design folder together.
The design work of those working in schools where a “collaborative” approach had been adopted displayed two different levels of success relative to their design folders. Those who enjoyed the act of designing produced visually excellent folders that contained creative thinking. At the same time, they showed a considerable amount of re-worked and over-worked sheets. Those who did not enjoy designing produced numerous sheets of work attempting to satisfy the examination criteria but showing little evidence of a designer’s thought processes.
With regard to pupils developing a sound understanding of the process of designing, analysis of the two strategies adopted by the schools indicated that neither the “collaborative” or the “interventionist” model were successful. Feedback from pupils after they had finished their examination projects supported the researcher’s findings. Pupils’ reactions indicated that although some of them were able to obtain satisfaction from achieving success in the examination, many of the pupils in schools adopting either approach were unmotivated and skeptical about the validity of the process they had been asked to adopt.
The relationship between pupil motivation and teacher motivation
In the schools where the D&T teachers were enthusiastic, there was an air of optimism surrounding the classroom/workshops. This was despite the fact that they, like the unmotivated teachers, believed that external pressures affected the work they were carrying out with their pupils. The “optimistic” teachers seemed to treat these pressures as a challenge rather than as an excuse for poor results. In each case it was also noticeable that the teacher was part of an enthusiastic team of D&T staff lead by a motivated Head of Department. In the five schools where teachers lacked enthusiasm for their work it was found that in three instances the noted despondency prevailed across the whole D&T department, including the Head of Department.
As stated earlier, only ten out of the 50 pupils were found to be motivated by the end of their project work. The data collected did indicate some support for the researcher’s hypothesis that fewer pupils would be found to be
unmotivated in schools where enthusiastic, motivated teachers were teaching the D&T lessons. However, it was disappointing to find that there was not a
statistically significant difference between the two groups of teachers. Twenty-six percent of the sample taught by motivated teachers were enthusiastic about their project work in comparison to 16% of the pupils taught by despondent teachers.
Conclusion
Analysis of the research findings indicated that only twenty percent of the pupils studying at 10th grade were motivated by their D&T examination project work. Using the collected data it was found that a significantly larger number of pupils, just under sixty percent, were categorized as unmotivated. A further twenty-two percent of pupils had not enjoyed the activity, although their wish to perform well in their GCSE examinations had been a contributing factor in keeping them motivated in their D&T project work.
The evidence of the research concerning reasons for the differing levels of pupil motivation painted a complex picture of interactions between internal and external factors. A positive relationship was established between a pupil’s ability to perform and their level of motivation. Such factors as a pupil’s ways of thinking and working, personal goal orientation, and skills appropriate to D&T were found to show a positive relationship with both performance and
motivation. On the other hand, although a pupil’s level of creativity was found to relate positively to performance, no similar relationship was found between creativity and motivation. An equal number of pupils at both extremes of the creativity spectrum were found to be unmotivated. Analysis suggested that the prescriptive nature of the examination design process models adopted, as well as the effect of GCSE D&T assessment criteria upon ways of working, were frustrating for many pupils, particularly those who were creative. It was also evident that external factors such as delivery programs, as well as teaching strategies adopted by teachers to meet examination deadlines and requirements, influenced both pupil performance and pupil motivation.
process models. Secondly, the study supported the generally held belief that most teachers need to feel in control of classroom activities. To achieve this “control” in the context of D&T many teachers were seen to remove ownership of ideas from pupils at an early stage of the process. The common belief that ownership develops a sense of responsibility, pride, and the motivation to succeed has tended to be overlooked. In order to remedy this teachers need to develop strategies that will enable them to guide pupils through the process in a partnership where ownership is a joint affair. To achieve this teachers need to develop a far deeper understanding of the activity involved in designing than the present evidence would suggest is the case.
References
APU. (1994). Assessment of design and technology. In F. Banks (Ed.), Teaching Technology, London: Routledge, 161-172.
Amabile, T. M. (1985). Motivation and creativity: effects of motivational orientation on creative writers. Journal of Personality and Social Psychology, 48, 393-399.
Atkinson, E. S. (1993). Identification of some causes of demotivation amongst pupils in Year 10 and 11 studying technology with special reference to design and technology. In J. S. Smith (Ed.), IDATER93, Loughborough: Design and Technology, Loughborough University, 17-25.
Atkinson, E. S. (1994). Key factors which affect pupils performance in technology project work. In J. S. Smith (Ed.), IDATER 94, Loughborough: Design and Technology, Loughborough University, 30-37.
Atkinson, E. S. (1995). Approaches to designing at key stage 4. In J. S. Smith (Ed.), IDATER 95, Loughborough: Design and Technology, Loughborough University, 36-47.
Atkinson, E. S. (1997). Identification of some causes of demotivation amongst Key Stage 4 pupils studying design and technology. Ph. D. thesis, Newcastle-upon-Tyne: Newcastle University.
Atkinson, E. S. (1998) Cognitive Style in the Context of Design and Technology Project Work. Educational Psychology, 18:2, 183-194
Atman, K. S. (1986). Goal orientation index. Pittsburgh: Curriculum Innovators and Implementors.
Atman, K. S. (1993) Curriculum implications of goal accomplishment style for design technology education. In: J. S. Smith (Ed.), IDATER 92: Keynote lectures, pp. 1-10. Loughborough: Design and Technology, Loughborough University.
Bandura, M., & Dweck, C. S. (1985). The relationship of conceptions of intelligence and achievement goals to achievement-related cognition, affect and behaviour. In C. S. Dweck, & E. L. Leggett, (1988). A social-cognitive approach to motivation and personality, Psychological Review, 95(2), 256-273.
Biggs, J. B., & Moore, P. J. (1993). The process of learning, 3rd ed., Australia: Prentice Hall.
Brown, L. (Ed.). (1993). New Shorter Oxford English Dictionary, Oxford: Clarendon.
Chidgey, J. (1994). A Critique of the design process. In F. Banks (Ed.), Teaching Technology, London: Routledge, 89-93.
Curry, L. (1983). An organisation of learning styles theory and constructs. ERIC Document 235 185.
De Carlo, N. A. (1983). Psychological games, London: Guild Publishing. Department for Education and the Welsh Office (DES). (1987). Craft, Design
and Technology from 5 to 16: Curriculum Matters 9, London: HMSO. Department for Education and the Welsh Office (DES). (1989). Design and
Technology for Ages 5 to 16: Proposals, London: HMSO.
Department for Education and the Welsh Office (DES). (1992). Technology for ages 5 to 16 (1992), London: HMSO.
Design Council. (1980). Design education at secondary level, (Design Council Report) London: The Design Council.
Down, B. K. (1986). Problem solving, CDT and child-centredness. In A. Cross, & B. McCormick (Eds.), Technology in Schools, Milton Keynes: Open University Press, 228-239.
Dweck, C. S., & Leggett, E. L. (1988). A social-cognitive approach to motivation and personality Psychological Review, 95(2), 256-273. Education Authorities Directory and Annual. (1992). London: The School
Government Publishing Company Ltd.
Elliot, E. S., & Dweck, C. S. (1988). Gaols: an approach to motivation and achievement, Journal of Personality and Social Psychology, 54, 5-12. Gipps, C. (1990). Assessment: A teacher’s guide to the issues. London: Hodder
& Stoughton.
Garner, S. W. (1989). Drawing and designing: exploration and manipulation through two-dimensional modelling. In J. S. Smith (Ed.), DATER 89, Loughborough: Design and Technology, Loughborough University, 43-50. Glegg, G. L. (1986). The design of the designer. In R. Roy, & D. Wield, (1986).
Product Design and Technological Innovation. Milton Keynes: Open University, 86-91.
Grieve, E. (1993). Pupils’ and Teachers’ experiences of project work in Technology at Key Stage 4, (unpublished paper) presented at IDATER 93, Loughborough: Design and Technology, Loughborough University. Hendley, D., & Jephcote, M. (1992). A critical analysis of the operational aims
and objectives for technology for 14 to 16 year olds in England and Wales. In J. S. Smith (Ed.), IDATER 92, Loughborough: Design and Technology, Loughborough University, 4-8.
Her Majesty Inspectorate of Schools: Craft Design and Technology Committee, (1983). CDT: a curriculum statement for the 11-16+ age group, London: HMI.
Kimbell, R. A. (1994). Tasks in technology, International Journal of Technology and Design Education, 1, 1-15.
Kimbell, R., Stables, K., Wheeler, T., Wosniak, A., & Kelly, V. (1991). The assessment of performance in design and technology - The Final Report of the APU Design and Technology Project 1985-91, London: School Examinations & Assessment Council/Evaluation & Monitoring Unit. Lawson, B. (1990). How designers think: the design process de-mystified (2nd
Edition), London: Butterworth Architecture.
Layton, D. (1991). Aspects of national curriculum design and technology, York: National Curriculum Council.
Liddament, T. (1993). Using models in design and technology education: some conceptual and pedagogic issues. In J. S. Smith (Ed.), IDATER 93, Loughborough: Design and Technology, Loughborough University, 92-96. McAlpine, D. (1988). Creativity: Thinking processes and teaching implications,
Paper presented at 4th Annual National Association for Curriculum
Enrichment & Extension (NACE) Conference, Northampton: Nene College. McClelland, D. (1961). The Achieving Society, Toronto: Collier Macmillan
Canada, Ltd.
McCormick, B., Hennessey, S., & Murphy, P. (1993). A pilot study of children’s problem solving processes. In J. S. Smith (Ed.), IDATER 93, Loughborough: Design and Technology, Loughborough University, 8-12. National Curriculum Council. (1993). Technology Programmes of Study and
Attainment Targets: Recommendations of the National Curriculum Council, York: NCC.
National Curriculum: Design and Technology Working Group. (1988). National Curriculum, Design and Technology Working Group, Interim Report. Naughton, J. (1986). What is ‘technology’ anyway? In A.Cross & B.
McCormick (Eds.), Technology in Schools, Milton Keynes: Open University Press, 2-10.
Northern Examinations and Assessment Board (NEAB). (1993). General Certificate of Secondary Education: Design and Technology Syllabus for 1995, Newcastle: NEAB.
Osche, R. (1990). Before the gates of excellence: the determinants of creative genius, Cambridge: Cambridge University Press.
Oxlee, J. (1996). Analysis of creativity in the practise and teaching of the visual arts with reference to the current work of art students at GCSE level and above, Ph. D. Thesis Newcastle-upon-Tyne: Newcastle University. Riding, R. J. (1991). Cognitive styles analysis, Birmingham: Learning and
Training Technology, Assessment Research Unit, Birmingham University. Riding, R. J., Burton, Rees & Sharrott. (1995). Cognitive style and personality
in 12-year-old children. British Journal of Educational Psychology, 65, 113-124.
Riding, R. J., & Cheema, I. (1991). Cognitive styles: an overview and integration. Educational Psychology, 11(3&4), 193-215.
Rotter, J. (1966). General expectancies for internal versus external control of reinforcement. Psychological Monographs, 80, (Whole No. 609).
Secondary Examination Council, (1986). Kimbell, R. (Ed.), G.C.S.E, C.D.T: A guide for teachers, Milton Keynes: Open University Press.
Scott, G. (1990). Course work and course work assessment in G.C.S.E., Cedar Report 6, Warwick: University of Warwick.
Sinclair, J. (Ed.). (1995). Collins Today English Dictionary, London: Harper Collins
Tennent, M. (1988). Psychology and Adult Learning, New York: Wiley. Weiner, B. (1992). Human motivation, metaphors, theories, and research,
London: Sage.
Cross-Gender Interaction
in Technology Education:
A Survey
W. J. Haynie, III
Though the traditional “industrial arts” programs of the 1950s which involved woodworking, metalworking, and other “shop” areas were heavily male dominated (Cummings, 1998; Hill, 1998; and Zuga, 1998), modern technology education could be more appealing to females. At one time there were very few female students and almost no female teachers in industrial arts courses, but as the discipline began to evolve towards a study of technology during the 1960s and 1970s a trickle of females joined the profession (Zuga, 1998). ITEA records show more females joining the profession since the name change to Technology Education than in the previous decade and an upward trend since then. Part of this increase is due to the attraction of predominately female elementary teachers to membership in the Technology Education for Children Council (TECC), but there are also more females in all segments of the profession than in the past (ITEA, 1998). In the 1950s, the boys who enrolled in industrial arts shop courses, and the men who taught those courses, viewed them as a “man’s world” and there was little effort to foster participation by females.
At the same time that more females have been entering technology education, changes have been occurring in what is considered acceptable behavior in general society (Foster, 1996; Stevens, 1996; and Wolters & Fridgen, 1996). In the 1950s there were recognized lines of speech that most people generally agreed were not to be crossed. This especially was true in regard to sexually oriented comments, jokes, gestures, and speech—it was understood that such things were not talked about freely in “mixed company.” The liberal movement of the 1960s began some change in those cultural mores and today much of what would have seemed absolutely taboo in the 1950s is presented on television during the “family hours.” The terms “conservative” and “liberal” will be used rather loosely in this article, and they were on the
instrument as well. Their inferred meanings may be understood by contrasting the television shows “Leave It To Beaver,” “Donna Reed,” and “Ed Sullivan” (all representing “conservative” views and values) versus “The Simpsons,” “Roseanne,” and “Late Night With David Letterman” (deemed “liberal”). ____________________________
Though this method of defining terms is not scientifically precise, readers should find it helpful in interpreting findings and implications.
How can males and females interact most comfortably within technology education? Though some research has been done concerning fairness of opportunity, attractiveness of topics/approaches, and ways to encourage more females to enter the profession (ITEA, 1994; Liedtke, 1995; Markert, 1996; Silverman & Pritchard, 1996; Trautman, Hayden, & Smink, 1995; and Volk & Holsey, 1997), there is still a need to determine how men and women feel about the cultural atmosphere within our profession, our classrooms and laboratories, and how teachers and students interact. This study is intended to be a beginning in the effort to assess how professionals in technology education feel about certain issues concerning cross-gender interaction in technology education and whether the perceptions of men and women differ on those issues. Since some of the topics are sensitive in nature, perhaps even taboo for some people, this work and its findings must be viewed as establishing a starting place rather than purporting definitive conclusions. Likewise, the cultural mores of our society and within our discipline are not stagnate, therefore continuing work will be needed to track the evolving cultural climate within our discipline. Do the factors studied here negatively impact the comfort level of females and add their weight to others responsible for low levels of participation by females in technology education at all levels?
Methodology
A survey of technology education professionals was conducted at the 1997 Technology Student Association (TSA) national conference in Washington, DC, June 23-27, 1997. Volunteer participants were sought at the “Advisors’ Update” meetings. All of the advisors were practicing technology education teachers. Respondents were asked to complete the form while at the conference. Questionnaires were distributed to volunteers at the door and a brief announce-ment describing the study was made during the meeting. Of the 150 question-naires distributed, 113 were returned. However, 18 of those were incomplete, so the final sample consisted of 95 (39 females and 56 males) for a response of 63.3%. Only one advisor from each school formally registers for the conference, but many schools have two or more advisors. Of the 238 officially registered advisors, only 31 were female (13%). So, it is clear that females were the minority, but a much higher percentage of females than males chose to be in the study. Perhaps the males were less concerned about these issues and females perceived them as more important.
left end, “100” on the right end, and had the center marked with “50.” These three points on each continuum also had verbal descriptors related to the item. The left end of each continuum represented conservative (1950s) values or perceptions and the right end represented very liberal “anything goes” view-points (or extreme feminist perspectives for some items). For this study “conservative” connotes values evidenced in the “Leave It To Beaver” era on television in the USA and “liberal” connotes those prevalent in USA media today. This was noted in the general instructions at the beginning of the questionnaire.
Participants’ responses were scored by actually measuring the position of the “X” they marked on each continuum using a 100-increment rule and entering the measured point (any whole number from 0 to 100) into the computer. Thus, all marks below 50 would represent some degree of conservatism, but a mark at the 13 point on the continuum would be considerably more conservative than a mark at the 37 point.
Since participants’ response marks could vary between 0 and 100, the data were treated as continuous and were averaged and analyzed via comparison of means with SAS statistical software. Omnibus tests used the GLM variation of ANOVA and comparison of means used the LSD option for t testing. The .05 level of significance was used for all tests.
A series of open response items at the end of the questionnaire also provided opportunities for respondents to comment more freely. The instrument was rather lengthy and the four graduate students (2 male and 2 female) who field-tested it required an average of just over 17 minutes for completion. Because of the time required, there were many who did not complete the open response items or who only commented on one or two of them (these responses are noted where deemed important). The graduate students who helped to field test the instrument agreed that it was long, but they felt that the difficult nature of the problem and its importance warranted the length. These four professionals had public school teaching experience in technology education ranging from 2 to 13 years. Only minor editorial revisions were made after the initial field test.
Findings
Table 1
Demographic information
Groupings Used in Data Analysis
Gender Male, 56 (59%) Female, 39 (41%)
Age 40 years or less, 46 (48%) 41 or older, 49 (59%) Experience 10 years or less, 51 (54%) 11 or more, 44 (46%) n=95
One item asked whether men and women are treated fairly in technology education. The overall mean of 44.4 indicates relative fairness with slight advantage to men. The means and ranges were: Women 41.7, 0-70, and men 46.2, 16-100 (no significant difference).
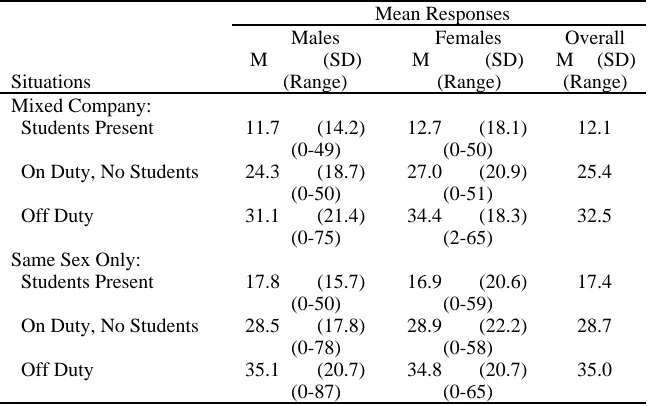
A series of six continuums were used to assess participants’ perceptions of “sexually oriented comments, jokes, gestures or speech” (see Table 2). Each continuum was marked: “0=absolutely forbidden,” “50=OK if tasteful,” and “100=anything goes.” Half of these items specified situations in which only “your own gender” is present and the other half included “the opposite sex.” There were three situations: 1) students present; 2) on duty, but no students present; and 3) off duty (lounge or eating out at a conference). There were no significant differences between the means of men and women on any of these
Table 2
Perceptions on Sexually-Oriented Jokes and Speech
Mean Responses
continuums and all of them were below 36, indicating some degree of prohibi-tion. There was, however, a definite pattern in the means. Means were a few points higher (less prohibition) when only one gender was present and they also were higher for the “off duty” settings. When students were present, the means were much lower, indicating that a higher standard of decency is expected when working with students. Of all of the analyses performed with various demo-graphic sub groupings, the only one which was significant was that women who had one or more brothers were less tolerant of such comments and jokes in mixed company than were women who had no brothers [F(1,37)=7.01, p=.0119].
Another item stated: “I enjoy telling and hearing sexually oriented jokes in general.” The continuum was marked: “0=never,” “50=in limited settings,” “100=very much.” The overall mean was 29.7 and there was a significant difference between the views of men and women on this item, [F(1,88)=4.87, p=.0300]. Though both groups’ means were considerably below the midpoint of 50, men (34.4, range 0-90) reported that they enjoy these sorts of jokes more than women (23.1, range 0-77). The less experienced teachers were also more tolerant of these jokes than teachers with over ten years of experience, F(1,88)= 6.36, p=.0135.
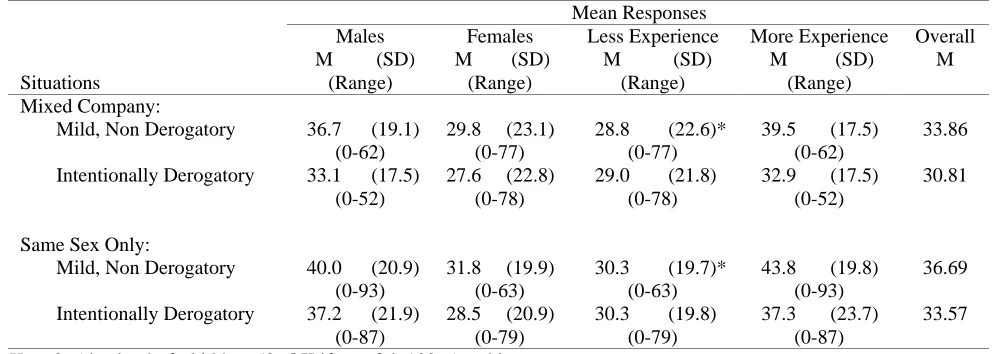
A series of four items asked about gender specific but non-salacious jokes (see Table 3). As before, half of these items involved situations in which only one’s own gender was present and the others included mixed company. Two of the items asked about jokes which were “gender specific but not derogatory (or only mildly so), with plays on ‘male machismo’ or ‘female sensitivity’.” There were no significant differences between the genders on these two items, but there was a trend that showed more liberal views when only one gender was present. Teachers with more than ten years of experience were more tolerant of these mild jokes than their junior colleagues. The remaining two items in this series concerned jokes which were “gender specific and intentionally
derogatory, but not salacious (male immaturity/impatience, impulsiveness, PMS, driving, ‘dumb blonde,’ etc.).” These means were lower than those for the less offensive jokes above. There was no significant difference, though the trend showed slightly greater enjoyment of these jokes by males when with other males.
Perceptions on Gender Specific, Non Salacious Jokes
Mean Responses
Males Females Less Experience More Experience Overall
M (SD) M (SD) M (SD) M (SD) M
Situations (Range) (Range) (Range) (Range)
Mixed Company:
Mild, Non Derogatory 36.7 (19.1) 29.8 (23.1) 28.8 (22.6)* 39.5 (17.5) 33.86
(0-62) (0-77) (0-77) (0-62)
Intentionally Derogatory 33.1 (17.5) 27.6 (22.8) 29.0 (21.8) 32.9 (17.5) 30.81
(0-52) (0-78) (0-78) (0-52)
Same Sex Only:
Mild, Non Derogatory 40.0 (20.9) 31.8 (19.9) 30.3 (19.7)* 43.8 (19.8) 36.69
(0-93) (0-63) (0-63) (0-93)
Intentionally Derogatory 37.2 (21.9) 28.5 (20.9) 30.3 (19.8) 37.3 (23.7) 33.57
(0-87) (0-79) (0-79) (0-87)