Articles
Some Factors Predicting
the Adoption of Technology Education
in New Mexico Public Schools
Julia M. Bussey, Thomas J. Dormody, and Dawn VanLeeuwen
In 1984, delegates of the American Industrial Arts Association (AIAA) changed its name to the International Technology Education Association (ITEA) (Godla, 1988). Along with the name change, industrial arts, with its focus on industry, was expected to change and encompass a broader point of view involving total systems. Four technological systems were identified: manufac-turing, transportation, communication and construction (G. M. Rogers, 1989; Snyder & Hales, 1981).
New Mexico began its transition from industrial arts to technology education in the late 1980s. With this came a change in focus from learning “hands-on” skills to understanding technological systems and their impact on society. The transition has been a slow one to date. Therefore, research was needed to gain a better understanding of the factors that are related to the adoption of technology education in New Mexico public schools. The outcome of such research would help educators and change agents to successfully integrate technology education into the curriculum.
Review of Literature
Technology education seeks to reach all students, not only those choosing to go into a technical field as a career. The processes of problem solving and critical thinking using technology, and understanding the social impacts of technologies, are very important in today’s ever-changing world. The promise of the future lies not in technology alone, but in people’s ability to use, manage, and understand technology (Dugger & Satchwell, 1996).
Technology education is emerging as an essential part of general education for all students. It can be offered at each grade level, starting with technology awareness in the primary and elementary grades and advancing to more specialized study at the high school level in areas such as computer aided drafting (CAD) and computer programming (Sharpe, 1996). This is in contrast to industrial arts, which was primarily taught in the upper grade levels (grades 9 ____________________________
Julia M. Bussey ([email protected]) is a Graduate Teaching Assistant, Technology Education Program, Virginia Tech, Blacksburg, VA. Thomas J. Dormody
to 12). Philosophically, teachers in technology education assert that all ages can and should learn to utilize technology to solve problems and change the environ-ment around them, leading to an enhanced quality of life.
The Jackson Mill Curriculum Project (Snyder & Hales, 1981) recognized the technologies of communications, construction, manufacturing, and transporta-tion as basic to human endeavor and suggested them as the content organizers for what in the 1980’s was predominantly industrial arts. Ten years later Savage and Sterry (1990) led a team that proposed a conceptual model for technology education comprised of communications technology, physical (production and transportation) technology, and bio-related technology. Students were to be taught by applying an input-process-output model that addressed human needs and wants through the identification of problems and
opportunities. The conceptual model stated that every area of the curriculum can be enriched with technology and that all students will be able to enhance their educational experience with the skills and understanding received in technology education.
The emerging discipline that is now technology education has changed through the years. In some instances existing programs were simply relabeled, starting with manual training and progressing through manual arts, industrial arts, and industrial technology education (Clark, 1989). In many cases, the old tools of industrial arts programs have simply been replaced with the new tools of technology education (Wicklein, 1997). For example, computer aided drafting replaced the drawing board.
Though industrial arts was considered an element of vocational education in some states, technology education is intended to play a major role in the future of education as a primary subject in the school curriculum (D’Apolito, 1997). Wright and Barella (1981) felt that many industrial arts teachers remain comfortable with their established program and are not making an effort to change to technology education. They recommended that each industrial arts educator develop a clear understanding of where the field has been, why it was the way it was, and how it has changed. This would enable the teachers to develop reasoned paths into the future.
Research results support the perception that technology education has not been met with widespread teacher acceptance. A study in Nebraska by Rogers and Mahler (1994) indicated that the majority (77.5%) of industrial technology education teachers did not accept the new technology education curriculum. In a much earlier study, Swanson (1981) found that the majority (68.8%) did not adopt the notion of technology education.
observations, diffusion research has been conducted in such diverse fields as anthropology, sociology, education, public health, medical sociology, communication, marketing, and geography (E. M. Rogers, 1995).
In order for technology education to be diffused, the factors that influence the adoption process need to be identified. These factors will provide
information about what can be done to increase the rate of adoption. E. M. Rogers (1995, p. 208) provided such a theoretical framework.
First, E. M. Rogers proposed that innovations that possess certain attributes are more likely to be adopted. These attributes are relative advantage, compati-bility, complexity, trialacompati-bility, and observability. The relative advantage of technology education is the degree to which it is perceived by teachers as being better than industrial arts. The compatibility of technology education is the degree to which it is perceived as being consistent with the existing values, past experiences and needs of teachers. Complexity is the degree to which
technology education is perceived by teachers as difficult to understand and use. Trialability is the degree to which technology education may be experimented with on a limited basis before teachers make a decision to adopt. Another attribute to consider is observability, the degree to which the results of an innovation are visible to others. Many educators are hesitant to change an existing program to something they only know through discussion and reading and not through observation.
Second, E. M. Rogers proposed that adoption of an innovation is related to innovation-decision process. This is the process through which an individual (or other decision-making unit) passes from first knowledge of an innovation, to forming an attitude toward the innovation, deciding to adopt or reject the innovation, implementing the new idea, and confirming the innovation decision. Rogers stated there are three possible types of decisions that can be made regarding the innovation. First is the optional decision in which the adopting individual has almost complete responsibility for the decision. Second, is the collective decision in which a group makes the decision but the individual has some influence in the process. Third is the authority decision in which the adopting individual has no influence in the innovation decision because the decision is made for the individual by others.
E. M. Rogers (1995) indicated that the fastest rates of adoption for innovations usually result from authority decisions. G. E. Rogers (1989) explained that technology education was externally developed, creating animosity among the teachers who were to implement the idea internally. As is true with the majority of professional associations in content areas, the majority of industrial arts teachers were not members of the ITEA. Due to the lack of involvement in a professional association, these teachers did not have a full knowledge of the changes occurring in the field. Thus, the majority of teachers were not predisposed to the idea of technology education. These non-members then became the majority of teachers who were asked to implement the new technology education programs (G. E. Rogers, 1989).
place are factors that determine the rate of adoption of an innovation. Because of the difficulty in quantifying these variables, only the perceptions of the influence of opinion leaders (i.e., peers) on adoption was measured in this study. Opinion leaders may have influenced initial reaction to the name change of industrial arts to technology education. Peer-to-peer communication at the persuasion stage of the innovation-decision process is usually integral to innovation decisions. E. M. Rogers (1995) stated that when the norms of the social system are opposed to change, then the behavior of the opinion leaders correspondingly reflects these norms.
The extent of the change agents’ promotional efforts is another factor that determines the rate of adoption of an innovation (E. M. Rogers, 1995, p. 208). Linnell (1992) stated that facilitators of change must provide support and follow-up activities for an adequate period of time to confirm adoption. Rogers and Mahler (1994) concluded that leaders in the field of technology education must interact with industrial arts teachers through various diffusion activities; the practice of promoting the change to technology education through top-down communication must be discontinued.
Change agencies (e.g., state departments of education, university engineering and teacher education programs, two-year post secondary
institutions, school districts, and industries) could provide staff development and in-service training for teachers involved transitioning to technology education. Weissglass (1991) suggested that providing information is not sufficient to overcome the obstacles to change caused by the culture of schools and the teachers’ lack of awareness of the need for change. He also indicated the following steps should be taken by change agents relative to those teachers who were being encouraged to change: breakdown their isolation; improve their listening skills; provide opportunities for them to express their feelings about the change; address their personal concerns; and establish support networks for them.
According to Nee (1993) traditional industrial arts teachers have not connected to technology education because of high complexity, low compatibility and problems with change agents. Also, these teachers are unwilling to try the new program due to the lack of stable support offered from their administration.
Purpose and Objectives of the Study
The purpose of this study was to determine which factors might predict the adoption of technology education by secondary technology education and industrial arts teachers in New Mexico. The subordinate objectives of the study were:
1. To describe technology education and industrial arts teachers by gender, age, teaching endorsements held, program budget, grade level taught, and years of teaching.
influence of change agents and opinion leaders on adoption (E. M. Rogers, 1995).
3. To describe technology education and industrial arts teachers by level of adoption of technology education.
Method
A list of 310 secondary technology education and industrial arts teachers in New Mexico, provided by the New Mexico State Department of Education, served as the frame for the study. It was determined that a sample size of 169 was needed to represent the population at a confidence level of 95% (Krejcie & Morgan, 1970). A sample of this size was then randomly drawn using a table of random numbers. The study used a multivariate correlational design to
determine the factors that predict the adoption of technology education by secondary industrial arts and technology education teachers in New Mexico.
A mailed questionnaire was designed by the researchers to measure the variables of the study based upon the work of E. M. Rogers (1995). The questionnaire contained summated indices made up of Likert-type questions to determine the level of adoption of technology education (18 items), perceptions of the attributes of technology education (10 items), and the influence of change agents and opinion leaders on adoption (8 items). Perceptions of how often optional, collective, and authority program decisions are made were each measured with a single Likert-type question. The remaining portion of the questionnaire consisted of demographic questions on gender, age, teaching endorsements held, program budget, grade level taught, and years of teaching. The questionnaire also contained three checklists to provide a second analysis for the main objective of the study. These checklists measured the three most important things that were helping teachers adopt technology education (promoters of adoption), the three most important things that were preventing teachers from adopting technology education (barriers to adoption) and three suggestions of things that should be done to strengthen technology education in New Mexico. Items for these checklists were developed from pooled responses to the open-ended questions on a pilot test. The researchers also made a judgment on which of the Variables Determining the Rate of Adoption each checklist item best matched.
two mailings to increase the response. These procedures yielded a 66% (n=112) response of which 58% (n=98) were usable. To check for non-response bias, ten (17%) of the non-respondents were called and administered the entire
questionnaire over the telephone. Their data were pooled with the data of two respondents who responded long after the deadline. Using t-tests, these non-respondents and late non-respondents were compared statistically (α=.05) to the respondents on the level of adoption of technology education, perception of the attributes of technology education, and age. Respondents had significantly lower levels of adoption of technology education, lower perceptions of the attributes of technology education, and were older than the non-respondents and late
respondents. Therefore the non-respondent/late respondent data were not pooled with respondent data since they appear to be different. The researchers therefore recommend caution in generalizing the results of this study beyond the
respondents.
Results
Factors predicting adoption of technology education were determined using stepwise multiple regression. A probability level of .05 was used as the criterion for accepting a factor into the prediction model for level of adoption of techno-logy education. Subordinate objectives one, two, and three were analyzed with descriptive statistics. Answers to the three checklists were reported as frequen-cies and percentages. Because they set the stage for the major analysis, the subordinate objectives will be discussed first.
Subordinate Objective One
A total of 78.4% (n=76) of the teachers were male and the remaining 21.6% (n=21) were female. The minimum age recorded was 25 years old and the maximum age was 77. The average age of the teachers was 45.94 years (SD=9.47).
A total of 12 teaching endorsement categories were listed on the survey based on pilot test data. After a preliminary analysis of the level of adoption of technology education, a dichotomous variable was created from the 12 categories. It consisted of teachers who held either an Industrial Arts and/or Technology Education endorsement (n=69, 71% of the teachers) and teachers who did not have either endorsement (n=28, 28.9% of the teachers).
of the time at the middle school level (grades six, seven and eight). There were 96 teachers who
responded to the item on years of teaching. The values ranged from one to 41 years. The mean was 15.44 (SD=9.49).
Subordinate Objective Two
The teachers’ perceptions regarding the attributes of technology education as an innovation were measured with ten, Likert-type scale items. The values could range from 1 to 5. With ten items, then, the composite values could range from 10 to 50. The lowest composite score among the respondents was 22 and the highest was 48. The mean was 34.29 (SD=5.25). Respondents averaged a 3.43 across the five-point scales, indicating a neutral attitude on the part of the teachers regarding the attributes of technology education as an innovation.
The mean perceptions of how often the different types of program decisions are made were 3.69 (SD=1.08) for optional decisions (corresponding to “most of the time” on the five-point Likert-type subscale), 2.91 (SD=1.01) for collective decisions (corresponding to “sometimes”), and 2.69 (SD=1.15) for authority decisions (corresponding to “sometimes”).
The mean composite perception of the influence of change agents and opinion leaders in adopting technology education was 25.21 (SD=5.17). Since there were eight Likert-type items that made up the composite value, the range was from eight to 40. The range of values for the respondents was from 15 to 38. The average value per item was 3.15 on the five-point scale, indicating that change agents and opinion leaders had a slight influence on adopting technology education. The lowest and highest scores recorded for the index were 15 and 38, respectively.
Subordinate Objective Three
Eighteen items were developed to measure the level of adoption of technology education on a seven-point scale. Thus, the possible range of values was from 18 to 126. The actual values ranged from 56 to 122. The mean
composite level of adoption of technology education among the respondents was 96.1 (SD=12.64). The mean value per item was 5.34. This indicated that the respondents were implementing technology education only to a slight extent.
Primary Analysis
Before the primary analysis was conducted, a scatter plot of the data was produced. Two outliers among the respondents were identified and removed. This left responses from 93 teachers for the final analysis. A stepwise multiple regression procedure was then performed resulting in a mathematical model that explained 44% of the variance in level of adoption of technology education. The model included six independent variables that reached the criterion alpha level of .05. These predictors were:
1. Perceptions of the attributes of technology education as an innovation. 2. Influence of change agents and opinion leaders.
4. Perception of how often “authority” program decisions are made. 5. Teaching endorsement held.
6. Years of teaching.
The prediction equation for this model was Y = .89 (X1) + .58 (X2) + 3.92
(X3) + 2.58 (X4) + 6.59 (X5) - .2596 (X6) + 28.7216. The subscripts in the
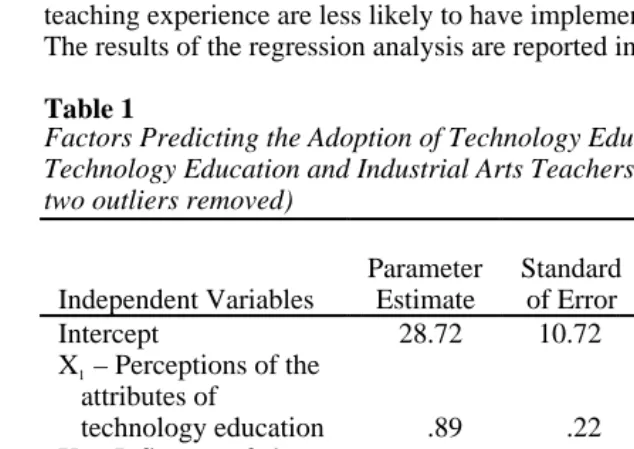
equation correspond to the numbers in the above list. Endorsement status used dummy coding with those having endorsement in technology education and/or industrial arts assigned a 1 and those without assigned a 0. Note that the relationship between level of adoption of technology education and years of teaching experience runs in a negative direction, meaning that those with more teaching experience are less likely to have implemented technology education. The results of the regression analysis are reported in Table 1.
Table 1
Factors Predicting the Adoption of Technology Education by Secondary Technology Education and Industrial Arts Teachers in New Mexico (n=93, two outliers removed)
Independent Variables
Parameter Estimate
Standard of Error
Type II Sum of
Squares f p
Intercept 28.72 10.72 631.93 7.18 .01
X1 – Perceptions of the attributes of
technology education .89 .22 1444.57 16.42 .01
X2 – Influence of change agents and opinion
leaders .58 .22 622.44 7.07 .01
X3 – Perception of how often optional program
decisions are made 3.92 1.26 855.03 9.72 .01
X4 – Perception of how often authority program decisions are
made 2.58 1.18 418.04 4.75 .03
X5 – Teaching
endorsements held 6.59 2.29 726.07 8.25 .01
X6 – Years of teaching -0.26 0.11 490.73 5.58 .02 (Adjusted R2
=.44, p=.01 for this six variable model)
Barriers and Promoters of Change
change (n=30), lack of incentives to change (n=23), and inadequate administrative support (n=20).
Personal interest was cited as the most common promoter to adopting technology education in New Mexico (n=56). This was followed by workshops (n=38), and being able to visit functional technology education programs (n=29). Other promoters with high frequencies were the availability of grant funding (n=26), school-to-work initiatives (n=25), state level support (n=24), opportunity for professional advancement (n=18), and peer teachers (n=15). These data are reported in Table 3.
Interestingly, while 56 and 43 respondents respectively, indicated inadequate budget and resources as barriers to adoption (Table 2), 26
respondents indicated available grant funding as a promoter of adoption (Table 3). Also, respondents indicated state level support both as a promoter (n=24) and as a barrier (n=16) to adoption.
Table 2
Barriers to Adopting Technology Education in New Mexico
Category n % Rank
Primary Determinant (Rogers, 1995)
Inadequate budget 56 19 1 Relative
advantage
Inadequate facilities 50 18 2 Compatibility
Inadequate resources 43 15 3 Relative
advantage Inadequate educational programs
about technology education
32 12 4 Change agent
efforts
Fear of change 30 11 5
Lack of incentives to change 23 8 6 Relative advantage Inadequate administrative support 20 7 7 Change agent
efforts Inadequate state level support 16 6 8 Change agent
efforts Unfavorable publicity about
technology education
7 2 9 Change agent
efforts
Overall, the results from the three checklists support the regression model in that the perceived attributes of technology education and influence of change
Table 3
Promoters of the Adoption of Technology Education in New Mexico
Category n % Rank
Primary Determinant(s) (Rogers, 1995) Personal interest 56 22 1 Compatibility Workshops 38 15 2 Change agent
efforts Visiting technology education
programs
29 12 3 Observability Available grant funding 26 11 4 Relative
advantage School-to-work initiatives 25 10 5 Compatibility State level support 24 10 6 Change agent
efforts Opportunity of professional
advancement
18 7 7 Relative advantage
Peers 15 6 8 Communication
channels/ opinion leaders College courses 11 4 9 Change agent
efforts Phasing out of industrial arts 3 1 10 Relative
advantage
Table 4
Suggestions to Strengthen Technology Education in New Mexico
Category n % Rank Develop financial incentives 38 14 2 Relative
advantage Increase state level support 35 12 3 Change agent
efforts Increase industry support 32 11 4 Change agent
efforts Improve pre-service education
programs for technology education
7 10 5 Change agent efforts Increase in-service opportunities 22 8 6 Change agent
efforts Increase administrative support 21 7 7 Change agent
efforts Add more conferences to share
ideas
Build the Technology Student Association
6 2 9 Compatibility
agents and opinion leaders on the adoption of technology education appear in both the regression and checklist analyses. In Tables 2, 3, and 4, three of the attributes of technology education (i.e., relative advantage, compatibility, and observability) are represented, as are the influences of change agents and opinion leaders (peers) on adoption.
Conclusions
The teacher respondents were mostly males and averaged 46 years of age. Their program budgets averaged $2,212.54. Industrial Arts, Technology Education, and Science were the most common endorsements held by the respondents. The majority of the teachers taught only in grades nine through twelve. The remainder of teachers taught at least some of the time in grades six through eight. Their years of teaching experience ranged from one to 41 years and averaged 15 years.
Overall, the teachers had a neutral perception of the attributes of technology education as an innovation. Most of the time, program decisions are made by individual teachers (i.e., are optional decisions). Collective decisions (made by the teacher and others) and authority decisions (made by others) about programs are sometimes made. The teachers saw change agents and opinion leaders as having a slight influence on their adoption of technology education.
The best predictors in this study of the level of adoption of technology education from among the independent variables studied were: perceptions of the attributes of technology education, influence of change agents and opinion leaders on adoption, perception of how often optional program decisions are made, perception of how often authority program decisions are made, teaching endorsements held, and years of teaching. These six variables explained 44% of the variance in level of adoption of technology education.
The five most frequently cited barriers to teachers adopting technology education in New Mexico were: inadequate budget, inadequate facilities, inadequate resources, inadequate educational programs about technology education, and fear of change. The barriers correspond to relative advantage, compatibility, and change agent efforts from among E. M. Rogers’ (1995) determinants of the rate of adoption of an innovation.
The five most frequently cited promoters for adopting technology education in New Mexico were: personal interest, workshops, visiting technology
education programs, available grant funding, and school-to-work initiatives. These promoters correspond to compatibility, change agent efforts,
observability, and relative advantage from among E. M. Rogers’ (1995) determinants of the rate of adoption of an innovation.
to relative advantage and change agent efforts from among E. M. Rogers’ (1995) determinants of the rate of adoption of an innovation. Overall, items corre-sponding to attributes of technology education and change agent efforts are frequently cited in all three checklists. The availability of resources appears to be a key factor overall in the adoption of technology education.
Recommendations
As mentioned earlier, there is evidence that non-respondents differ from the respondents to this study. Once again, the reader is cautioned to keep this in mind as generalizations are developed.
The strongest predictor of the level of adoption of technology education was the perception of the teacher of the attributes of technology education. This suggests that in order to encourage the adoption of technology education, change agents should focus their efforts on increasing teacher perceptions of the
compatibility, relative advantage, trialability and observability of technology education and decreasing perceptions of its complexity.
Considering compatibility, there are some practices that change agents might consider. First, show how technology education can be integrated into an existing system. For example, a teacher might visit an industrial arts program that is successfully making the transition to technology education. Second, show how the curriculum practices of the targeted teacher that are already in place match the technology education paradigm. Third, show how current teaching practices can be expanded to incorporate cooperative learning and measure learning processes as well as products.
To facilitate the change to technology education relative to the teachers’ perceptions of relative advantage, incentives for adoption might be increased. These could include awards, travel resources, and released time for learning about the program. Second, teachers could be made aware of opportunities for funding and encouraged to pursue them.
Concerning the trialability of technology education, arrangements could be made for in-service workshops and conferences throughout the state incorpo-rating hands-on activities that could be taken back to the classroom and implemented. Second, the teachers could be provided with curriculum and instructional materials that are understandable and easy to use.
Regarding the observability of technology education, change agents might use pre-service and in-service programs and professional communications to arrange for teachers to travel to other states to observe successful technology education programs. Furthermore, ongoing programs that show the successful implementation of technology education might be showcased for other teachers to observe.
To reduce teachers’ perceptions of the complexity of technology education, the diffusion process should be started slowly with small, easy-to-understand modules or other components of technology education. As teachers gain experience and have success, the more complex components could be added.
assure adequate resources and to help them better understand what technology education is.
In this study, perceptions of how often optional and authority program decisions are made were both predictors of the adoption of technology education. Change agents should be made aware that a combination of teacher decision making and decisions made by a higher authority like a state supervisor or principal may lead to the highest level of adoption of technology education. Although the perception of how often collective program decisions are made was not a predictor of the adoption of technology education, it did have a low positive relationship with the level of adoption. Therefore, pending further investigation, the researchers recommend that collective decision-making also be encouraged when appropriate for making decisions about technology education and industrial arts programs.
Those teachers endorsed in technology education and/or industrial arts had a higher level of adoption of technology education than those endorsed in other areas. Collegiate programs that produce teachers with technology education endorsement must be supported. Moreover, school districts should be
encouraged to hire teachers with a technology education endorsement. Years of teaching experience was a predictor of adoption of technology education. The fewer the years of teaching experience a teacher had, the higher their level of adoption of technology education. The study did not determine why this was so. However, a plausible reason is that new teachers are more likely to be educated in technology education than veteran teachers. If this is true, then it argues for strengthening in-service education programs and support to veteran teachers.
The influence of change agents and opinion leaders on adoption was a predictor of the level of adoption of technology education. As mentioned earlier, change agents should be made aware of the other variables related to the level of adoption of technology education and the implications of those relationships. They should also focus on eliminating some of the barriers to teachers adopting technology education and take advantage of the promoters of adoption of technology education. Change agents should be aware of their key role in making the transition from industrial arts to technology education happen.
As a state, New Mexico is progressing toward the adoption of technology education. For traditional industrial arts teachers, the transition process has been difficult. The state department could direct efforts toward those teachers who do not appear to be willing to make the change to technology education. The process should be gradual and emphasize the similarities between elements of existing practice and what is expected in technology education. Progress should be recognized and rewarded. Efforts to reduce fear in the change process are essential.
educational programs such as technology education.
References
Clark, S. (1989). The industrial arts paradigm: Adjustment, replacement, or extinction? Journal of Technology Education, 1(1), 7-21.
D’Apolito, T. (1997). What we are about? The Technology Teacher, 56(6). Dillman, D. A. (1978). Mail and telephone surveys: Total design method. New
York: Wiley.
Dugger, W. E. Jr., & Satchwell, R. E. (1996). Technology for all Americans: A rationale and structure for the study of technology, executive summary. The Technology Teacher, 56(3), 10-11.
Godla, L. (1988). The role industrial arts plays in total vo-ed program. School Shop, 47, 7.
Krejcie, R. V., & Morgan, D. W. (1970). Determining sample size for research activities. Educational and Psychological Measurement, 33, 607-610. Linnell, C. C. (1992). Concerns of technology education teachers regarding
curriculum change. The Journal of Epsilon Pi Tau , 34(3), 45-52. Nee, J. G. (1993). Unity through diversity. Tech Directions, 52(8), 47-49. Rogers, E. M. (1995). Diffusion of innovations (4th ed.). New York: Free Press. Rogers, G. E. (1989). Reactions to implementing technology Education. School
Shop, 48(6), 38-39.
Rogers, G. E., & Mahler, M. (1994). Non-acceptance of technology education by teachers in the field. The Journal of Technology Studies, 20(1), 15-20. Savage, E., & Sterry, L. (1990). A conceptual framework for technology
education. Reston, VA: International Technology Education Association. Sharpe, D. B. (1996). Out with the old in with the new. The Journal of Design &
Technology Education, 1(1), 24-36.
Snyder, J., & Hales, J. (Eds.). (1981). Jackson’s Mill industrial arts curriculum theory. Charleston, WV: West Virginia Department of Education.
Swanson, R. A. (1981). Technology education: A critical view. Journal of Epsilon Pi Tau, 7(2), 48-49.
Weissglass, J. (1991). Teachers have feelings: What can we do about it? Journal of Staff Development, 12(1), 28-33.
Wicklein, R. C. (1997). Mental methods of inquiry: Challenges to the curriculum paradigm. The Technology Teacher, 56(4), 43-45.