Contents
From the Editor 3
Articles
5 Coping at the Crossroads: Societal and Educational Transformation in the United States
by Glenn E. Baker, Richard A. Boser and Daniel L. Householder
19 A Comparison of Principles of Technology and High School Physics Student Achievement Using a Principles of
Technology Achievement Test
by John Dugger & David Johnson
27 Post Hoc Analysis of Test Items Written by Technology Education Teachers
by W. J. Haynie, III
41 Minority Recruitment and Retention Problems and Initiatives in Higher Education:
Implication for Technology Teacher Education
by Jorge Jeria and Gene L. Roth Reaction
54 Questioning the Language that We Use: A Reaction to Pannabecker's Critique of the Technological Impact Metaphor
Book Review
62 Technologies & Society: The Shaping of People and Things
reviewed by Alan C. Finlayson Editorial
65 Technology: The End of the Honeymoon?
by John Eggleston
69 Technology Education: Prospectus for Curriculum Change
by Michael R. Kozak Miscellany
74 Scope of the JTE
Editorial Process
Manuscript Submission Guidelines Subscription Information
JTE Co-sponsors
From the Editor
Since the “ink-on-paper” days of my first graphic arts course, the tech-nology of publication has fascinated me. I had the good fortune of learning “hot type” by sweating over the composing stick to eek out a few sentences, as had been the custom for a full five centuries. I took enough interest to build a half-scale wooden printing press and trot about the countryside studying the surviving wooden presses in America.
Soon after its introduction, “cold type” (i.e. phototypesetting) rendered hot type obsolete. In 1980, when I assumed my current position of employ-ment, I wasted no time in ridding my graphic communication lab of hot type. But within two years of taking possession of a “state-of-the-art”
phototypesetter, generously donated by the Compugraphic Corporation, it too became obsolete. Macintosh and laser printers (low-cost “imagesetters”) brought WYSIWYG (what you see is what you get) typesetting to my lab for
a very small fractionof the retail value of that phototypesetter. I'll not forget the day an entrepreneur from Texas packed it up and loaded it on a truck bound for his home state.
From its inception, the Journal of Technology Education has taken full advantage of electrostatic “typesetting.” Employing neither hot nor cold type, the JTE has benefitted from full electronic pagination and electrostatic image-setting available in a university mainframe computing environment. Dodging the tedium of paste-up is singularly responsible for our ability to publish the JTE in-house at Virginia Tech. It simply would not have been feasible other-wise.
Now “electrostatic type” is giving way to total electronic publication. Should we call it “quasi-type” or “pseudo-type” or simply “e-type”? No one really knows what to call it. Unlike it's predecessors, there is no physical artifact in electronic publication. It is simply digital storage of text and images laying in wait for end-user retrieval, without the need for hard copy toclutter
the process. It is ironic to think of hard copy as clutter, but we'd be kidding ourselves to think otherwise. Those who use e-mail regularly already see “snail mail” (the kind with a stamp on it) as vastly inferior. Can it be long before publications are perceived in the same vein? (It takes about a month longer to produce and distribute the hard copy of the JTE than it does the electronic version).
journals. We have electronic subscribers around the world; more, in fact, than we have hard-copy subscribers. A number of university libraries are using the electronic version of the JTE to test the concept of electronic subscription and distribution. There are many questions to be answered in the academic com-munity with regard to “e-journals” and the leading libraries in the world are currently wrestling with those questions. It's fun to be a part of the experiment.
We are nearing completion on an archival electronic version of theentire Journal of Technology Education, beginning with Volume 1, #1. The advan-tages of complete electronic versions of academic journals are obvious. Again, the JTE is perhaps the first refereed journal to boast a complete electronic ar-chive. We are also experimenting with a Postscript version of the JTE. The Postscript version allows electronic subscribers to output hard copy that will
exceed the quality of the printed version that regular subscribers receive! And the JTE is now available on an FTP server, providing virtually unlimited access to the Journal (see the “Electronic Access to the JTE” section at the end of the
Journal for FTP instructions).
We plan to keep playing at this end, and hope you will do the same...
Articles
Coping at the Crossroads: Societal and Educational
Transformation in the United States
Glenn E. Baker Richard A. Boser Daniel L. Householder
As the nature of a workforce changes over time, one broadly-defined group of workers diminishes in numbers while another group increases in numbers. For example, during the period 1890-1910, the major proportion of the workforce in the United States shifted from agriculture to industrial pro-duction (U.S. Bureau of the Census, 1975). Figure 1 presents the concept. Relentless technological developments gave rise to new job classifications and to increased employment opportunities in industrial production. At the same time, technological developments diminished employment opportunities in an-other field, in this case, agriculture. Over the long term, then, one might expect that demand for groups of occupations will increase over time, but will be ex-pected to decline when that employment sector is eclipsed by yet another em-ployment sector, driven by a new technological wave.
The intersection of the two curves charting the demand for agricultural occupations and industrial occupations occurred during a time of rapid societal change, which was, in turn, a significant impetus for major educational change. Moreover, because these times of change have historical precedents, they may have a relatively high degree of predictability. Indeed, Toffler (1990) suggested that recent events are shaped by “distinct patterns . . . [and] identifiable forces” that once understood allow us to “cope strategically, rather than haphazardly . . .” (p. xvii).
To explore the hypothesis that educational ferment is a naturally occur-ring phenomena at the juncture of technological ages, selected economic tran-sition points will be juxtaposed with developments in the evolving field of technology education. From this perspective, the recently-recognized shift in
employment patterns from manufacturing-based employment to information-based employment has influenced the shift from an industrial materials content base to a technology systems base in contemporary technology education pro-grams.
Figure 1. Labor force transition and educational reform.
Pace of Change
Zias (1976) argued that practitioners need a comprehensive historical understanding of an educational field in order to confront contemporary prob-lems realistically. Without the underpinnings of a strong historical perspective, educators may confront the present with the naive belief that no previous situ-ation has been characterized by such rapid and sweeping change. However, since the onset of the industrial revolution, rapid technological change has been characteristic rather than unique. Way (1964) noted that:
Change has always been a part of the human condition. What is different now is the pace of change, and the prospect that it will come faster and faster, af-fecting every part of life including personal values, morality, and religion, which seem almost remote from technology . . . So swift is the acceleration, that trying to 'make sense' of change will become our basic industry. (p. 113)
It appears that Way's prediction has already been realized. Snyder's (1987) interpretation of the composition of the U.S. workforce places more than 50% of the labor force now as information workers. The task of making sense of change has become a basic requirement of everyday life.
a contemporary analysis of economic activity, Van Duijn (1983) compared the economic wave cycle theories of Mensch, Jantsch and others. This seminal work condensed the thoughts of many theorists in many languages and em-phasized the influence of technological innovation on economic and industrial growth and decline. Van Duijn cited Mensch, in particular, as depicting tech-nological innovation as driving cyclical periods of increase and decline. Ayers (1990) identified five long economic cycles since the beginning of the industrial revolution, and concluded that “advances in technology, together with, and ex-haustion of, certain natural resources, have combined to bring about a series of coordinated technological transformations that are correlated with waves of economic activity” (p. 3). Combining the agricultural, industrial, and informa-tion waves delineated by Toffler with the five economic cycles described by Ayers clearly identifies periods of unusual social stress. This analysis also provides a useful framework for reviewing the relationships of social stress and changes in education. The analysis also poses predicative implications.
The First Long Cycle
According to Ayers (1990a), a cluster of inventions in Great Britain about 1775 made possible the development of the steam engine, wrought iron, and cotton textiles (Ayers, 1990 a; Kicklighter, 1968). These developments, cou-pled with a shift to coal as a major energy source and the construction of an inter-linked canal system, fueled the first long cycle. Power, manufacturing and transportation were the hub of the new technology which emerged.
Educational response. From this shift from agrarian to industrial econo-mies, two societal stresses also developed, First, populations shifted to urban areas, and secondly, demands for trained industrial workers began to develop. From the initiation of industrial activity, changes in society created conflicting viewpoints on the proper education for changing circumstances. During the first cycle, the Calvinist ideals championed by Francke and the sense-realist approach favored by Rousseau exerted significant influence on education. The
Schools of Industrywhich proliferated in Austria, Germany, and Britain sought to develop the habits of industry among the poor (Bennett, 1926). With the development of such practically-oriented programs, education was viewed as important for all individuals growing up in the society. Education was also viewed as a contributor to the solution of social problems.
Rousseau is credited with opening a new era in education by recognizing that “manual arts may be a means of mental training” (Bennett, 1926, p. 81). Rousseau believed that the education of children should be a natural, sponta-neous affair catering to the natural curiosity of children. The concept of “learning by doing” has developed a rich educational tradition that flourished in the work of Pestalozzi, Fellenberg, and Froebel. These ideas all contributed to educational influences in the United States as this nation underwent similar shifts in economy and society.
The Second Long Cycle
continent in 1861 and the historic “golden spike” connected the railway systems of the east and west in 1867.
Educational response. While workers in the first cycle of industrial-ization needed only minimal skills to perform their jobs, many second cycle workers were required to develop much higher levels of technical competence. By 1875, few U.S. students finished high school and fewer had employable skills despite a growing need for technically proficient workers. Society was expecting schools to prepare its youth, but the schools were based on a classical educational pattern. This societal impetus influenced the thoughts of Runkle at MIT, Woodward and Dewey (Bennett, 1926).
Other schools of applied science and engineering, which built on the “learning by doing” precepts of the first cycle, also appeared throughout Europe. A significant response in the United States was the Morrill Act of 1862, which established land-grant colleges for the study of agricultural and mechanical arts in each of the states (Bennett, 1926).
The Third Long Cycle
The third cycle, the second industrial revolution, began about 1870 (Ayers, 1990a). Major technological breakthroughs of this era included the development of steel, the widespread application of the internal combustion engine, the creation of networks to transmit electricity, and the evolution of a manufacturing system based upon mass production and interchangeable parts. In the third cycle as never before, much of the technological innovation was devoted to the development of consumer products and services: interurban trams, telephones, and household appliances.
Educational response. By the time of the 1920 census (U.S. Bureau of the Census, 1975), employees in the manufacturing sector outnumbered agri-cultural workers in the United States for the first time. The crossing of the employment curves, as in Figure 1, signalled the need for a change in educa-tional direction. While the need for educaeduca-tional change was clear, the direction that the change should take was hotly contested. The social and education turmoil of this era is well documented (Barlow, 1976; Bennett, 1937; Glatthorn, 1987; Luetkemeyer, 1987). In highlighting some of the concerns of the day, Law (1982) observed that:
public secondary schools combined served only 6.7% of the age group, and colleges 1.5% of theirs, the inherent failure of the public school system had become a burning issue. (p. 19)
During this period of social upheaval, the Smith-Hughes Act, which was passed in 1917, marked the beginning of federal funding for secondary voca-tional education in the public schools. Passage of the Smith-Hughes Act could only be accomplished through the formation of a remarkable coalition com-prised of diverse special interest groups (Hillison, 1987). Bennett (1937) ob-served that the Smith-Hughes Act was likely the best compromise possible, given the turmoil of the time. Even critics of the Act, such as Law (1982), conceded that no other legitimate alternative seemed possible.
Innovations
The crises of this period were addressed by the promulgation of the seven cardinal principles which were adopted by the NEA and which formed the basis of the comprehensive schools of the next several decades (Kozak & Robb, 1991). These principles, when combined with the Smith-Hughes Act and the guidance movement, formed the educational structure that effectively launched a reformed educational approach to address the societal needs of the time. In-cluded in these new reforms were industrial arts, as distinguished from manual training, manual arts, and vocational education -- especially as developed by Bonser and Mossman at the Speyer School of Columbia University (Bennett, 1937).
The Fourth Long Cycle
While the fourth long economic cycle did not have a clear starting or ending point, Ayers (1990b) located its origins in the depression of the 1930s and its end in the mid 1970s. The leading economic sectors in this cycle cluded the automobile, electrical and electronics, chemical, and aerospace in-dustries. Ayers noted that, in spite of the array of technological developments, only television, semiconductors, and electronic computers were new techno-logical innovations of this era.
Bell (1973) identified 1956 as the date when number of white collar workers surpassed total employment of blue collar workers for the first time. Toffler (1980) also noted 1956 as the approximate beginning of the Third Wave. The educational impact of these transitions was eclipsed on October 4, 1957, when the U.S.S.R. successfully launched the first space vehicle into orbit around the earth.
The change in workforce demographics, coupled with the response to Sputnik, released a massive burst of school reform and curriculum innovation. Conant's (1959) work reemphasized the need for a comprehensive high school encompassing the arts, humanities, science, math, and vocations. Conant also stressed the need for high standards in the comprehensive high school. Cochran (1970) observed that the 1960s produced more change and modification in in-dustrial arts programs that any previous decade. The Inin-dustrial Arts Curriculum Project, American Industry Project, and Orchestrated Systems Approach were some of the better known industrially-based curriculum projects of the era. Further, the study of technology, first proposed by Warner in the 1940s, re-ceived increased emphasis through the work of Olson and DeVore
(Householder, 1979). Olson's (1973) concepts of interfaces stressed that a static curriculum was inappropriate. These concepts, combined with Maley's (1973) emphases on group synergy, technological development, and research helped provide a foundation for a systems approach where the individual interpreted factors in solving technical problems.
The Fifth Long Cycle
The long cycles described by Ayers (1990b) averaged approximately 50 years in length. They generally began with a cluster of innovations that oc-curred during the economic slowdown between cycles. The fourth long cycle concluded in the mid 1970s; the fifth long cycle is still evolving. But, as Ayers noted:
Ayers suggested that the computer chip revolution has yet to have significant impact upon manufacturing and that computer integrated manufacturing (CIM) will “almost certainly turn out to be one of the ‘leading sectors’ of the fifth technological transformation” (p. 128).
Educational response. Analysis of the educational change that occurred in previous long cycles could be addressed from the comfort of a historical point of view. However, as this essay is written at the transition between two long cycles, as defined by Ayers, and two technological waves as defined by Toffler, the analysis of the present is much more difficult, and the inference of the coincidence of the two wave cycle patterns suggests enormous impact. The early 1980s were characterized by numerous reports that suggested what “ought” to be done in various educational settings. Strickland (1985) noted the relationship between education and national security in the call for educational reform. In reviewing four prominent reports on education (A Nation At Risk, Educating Americans for the Twenty-first Century, Actions for Excellence, and Making the Grade) Strickland drew the parallel between the post-Sputnik re-action and the clamor for educational reform which characterized the 1980s.
Industrial arts responded to the realities of the new workforce expecta-tions by pursuing a change to technology education. While many varieties of technology education are currently practiced and proposed, the common fea-tures of most programs include: (a) an emphasis on problem-solving capabili-ties; (b) an interdisciplinary approach that emphasizes alternatives and compromises, (c) the integration of context in an approach to recognize systemic functions, and (d) an assessment of the consequences of technological activities.
Summary of the Impact of
Technological Transformations on the Workforce
A useful summary of the impact of technological transformations on the workforce is provided by data on labor force participation in the four sectors of the United States economy. For the period between 1860-1995, Liedtke (1990) reported that:
1. The agricultural workforce peaked in the late 1800s and had declined to less than 3% by 1980.
3. Service workers averaged about 20% of the work force from 1860 through 1960. Since 1960, however, the proportion of service workers has risen dramatically.
4. Only the information sector of the work force has demonstrated consistent growth over the period. As of 1987, information workers held more than 50% of all jobs.
Combining the long cycle analysis by Ayers (1990a, 1990b), workforce demographics, and the history of industrial education leads to the conclusion that major philosophical and curricular stress points do indeed coincide with the wave cycles of technological transformation. As each wave of economic ac-tivity required different skills of its workforce, societal and educational forces attempted to reform to meet the perceived needs. Efforts at educational reform prior to the societal needs largely fell on deaf ears, regardless of the validity of thought.
Further, as the occupational requirements became more complex, the de-gree of educational ferment accompanying each transition point appeared to have increased. During the early waves of industrial enterprise, the educational response was generally limited to isolated activities of individual innovators. These resulted in such diverse offerings as the Schools of Industry and the Mechanics' Institute Movement.
However, dealing with educational change in later industrial waves be-came increasingly complex as diverse interest groups championed their own interests. The cauldron of educational controversy preceding the passing of the Smith-Hughes Act was clearly without precedent in the United States. Subse-quent educational responses have perhaps been as frenzied from the point of view of curriculum development and legislation, but not as bitterly contested. For example, the educational innovation which followed Sputnik seemed to proceed from a collective national purpose. Coping with the age of the infor-mation worker has led to substantial reporting and substantial displacement of workers. The corollary, a cohesive reorganization of the whole educational focus, such as occurred in 1917 and 1958, appears to be lacking.
Lessons from the Past and Implications for the Future The analysis of historical cycles presents opportunities for addressing present and future educational needs. This analysis suggests a wide range of lessons from the past and offers provocative implications for future educational planning. These inferences and implications include the following:
1. Change in the composition of the workforce is a continual process driven largely by technological innovation.
2. The responses of education have generally been reactive in response to the forces of change, rather than proactive in anticipation of change.
3. The skills required of workers have consistently become more complex. Literacy is no longer an option. Increasing job complexity requires high-order thinking skills and problem solving capabilities in a world of local area networks (LANs), fax, and e- mail.
4. One constant in the evolution of technology education has been the need to demonstrate that the discipline has made a contribution to the economic well-being of the country. Times of retrenchment by traditional educators, who vastly outnumber technology educators, exacerbates this need.
Educators in every era have been convinced that there have never been times like these before. And while this is always true to some extent, perhaps only now has the rate of change reached the point where teaching only cogni-tion (the exchange of informacogni-tion) is in quescogni-tion. Toffler (1990) observed that the information age does not need workers who are essentially interchangeable workers as in the industrial era, but rather individuals with diverse and contin-ually evolving skills. Wright (1990) pointed out more specifically the need for developing students who are:
Flexible, adaptive, life-long learners who can effectively work in groups. . . . that manual skill and detailed technical knowledge had only marginal value compared to problem solving and creative abilities; and that a broad under-standing about technology provides a valuable base for consumer, citizenship and career activities. (p. 3)
In a more specific context, Zirbel (1991), in a needs assessment of the manufacturing engineering technologies, found that only two of the top seven rated competencies were directly related to engineering technologies -- and those two dealt with analyzing processes. The other competencies look familiar to those analyzing workplace trends:
1. Understand the importance of quality.
2. Display motivation, responsibility, and natural curiosity. 3. Communicate clearly and concisely.
4. Work effectively as part of a team.
5. Demonstrate a basic working knowledge of personal computers.
Carnevale, Gainer and Meltzer (1990), in the report of a major study which seems destined to become a classic, proposed seven essential groups of workplace competencies:
1. Knowing how to learn.
2. Reading, writing, and computation.
3. Oral communication skills: listening and speaking. 4. Creative thinking and problem solving.
5. Self-esteem, goal setting, motivation and decision making. 6. Interpersonal skills, negotiation, and team work.
7. Organizational effectiveness and leadership.
What is interesting about the new list of “oughts” is the convergence of various occupational needs with current educational priorities. The common focus is on problem solving, communicating and team work, all in more tech-nological and complex settings.
Conclusions
Finding educational direction at the crossroads of technological eras is clearly no easy task. Scores of educational reports of the 1980s attest to this difficulty. However, each of the cycles which have been examined in this essay eventually evolved its own unique solution. Based on historic precedent, the following conclusions appear likely:
1. Education reform may be two cycles behind changing social and economic circumstances.
2. Education should be less concerned with courses and subjects as static el-ements and more concerned with the identification of the components of “basic education.”
Ayers (1990b) pointed out the difficulty in precisely defining the transition points in the last two waves in a way which highlights this problem. 4. The new “basic” should not be based on a static curriculum. Rather, it
should have a proactive ability to anticipate. The new “basic” must di-minish barriers between subjects of study (knowledge) and seek to inte-grate knowledges and experiences to make them more meaningful. While technology education is not construed to be “vocational,” it must relate to a competent workforce as a part of basic education required by all prior to the acquisition of job skills.
5. The nation, to remain competitive in a global society and economy, cannot depend on government bureaucracy to lead the change. Historically, all major reformations were preceded by periods of diversity and experimen-tation. If we face a future of continued rapid change, school quality could become more dependent upon new ideas and experimentation. Conformity and stability of context are not conducive to coping with rapid change. The future will depend upon individual schools and educators who are empowered to innovate rather than conform.
6. Accreditation guidelines and procedures must also change from an em-phasis upon meeting standards to an emem-phasis upon successful motivation and learning.
References
Ayers, R. U. (1990a). Technological transformations and long waves. Part I.
Technological Forecasting and Social Change,36, 1-37.
Ayers, R. U. (1990b). Technological transformations and long waves. Part II.
Technological Forecasting and Social Change,37, 111-137.
Barlow, M. L. (1976). The vocational education era emerges, 1876- 1926.
American Vocational Journal, 51(5), 45-62.
Bell, D. (1973). The coming of the post-industrial society. New York: Basic Books.
Bennett, C. A. (1926). History of manual and industrial education up to 1870. Peoria, IL: Bennett.
Bennett, C. A. (1937). History of manual and industrial education 1870 to 1917. Peoria, IL: Bennett.
Carnevale, A. P., Gainer, L. J., & Meltzer, A. S. (1990). Workplace basics: The essential skills employers want. San Francisco: Jossey-Bass. Cochran, L. H. (1970). Innovative programs in industrial education.
Bloomington, IL: McKnight.
Conant, J. B. (1959). The American high school today. New York: McGraw-Hill.
Hillison, J. (1987). The Smith-Hughes Act at 70.Agriculture Education Magazine, 59(8), 4-20.
Householder, D. L. (1979). Curriculum movements of the 1960's. In G. E. Martin (Ed.), Industrial arts education: Retrospect, prospect (pp. 114-131). Bloomington, IL: McKnight.
Kicklighter, C. E. (1968). Machine Technology, in Leutkemeyer, J. F. (Ed.)
A Historical Perspective of Industry, 17th annual yearbook of the American Council on Industrial Arts Teacher Education. Bloomington, IL:
McKnight.
Kozak, M., & Robb, J. (1991). Education about technology. In M. J. Dyrenfurth & M. R. Kozak (Eds.) Technological literacy (pp. 28-50). Mission Hills, CA: Glencoe/McGraw-Hill.
Law, G. F. (1982). 19th Century roots to the American vocational movement. (ERIC Document Service No. ED 226145).
Liedtke, J. A. (1990). A synthesis of communication systems and approaches for technology education. In J. A. Liedtke (Ed.),Communication in technology education (pp. 178-195). Mission Hills, CA:
Glencoe/McGraw-Hill.
Luetkemeyer, J. F. (1987). The Snedden/Prosser social efficiency paradigm of vocational education. Journal of Industrial Teacher Education, 25(1), 31-43.
Maley, D. (1973). The Maryland Plan. New York: Bruce
Olson, D. W. (1973). Tecnol-o-gee. Raleigh, NC: North Carolina State University.
Savage, E. & Sterry, L. (1990a). A conceptual framework for technology ed-ucation, Part 1. The Technology Teacher,50(1), 6-11.
Savage, E. & Sterry, L. (1990b). A conceptual framework for technology education, Part 2. The Technology Teacher,50(2), 7-11.
Snyder, D. P. (1987). Inevitable forces for change. Insight, 4(7), 1-6. Snyder, J. F., & Hales, J. A. (Eds.). (1981). Jackson's Mill industrial arts
curriculum theory. Fairmont, Fairmont State College.
Strickland, C. E. (1985). Sputnik reform revisited. Educational Studies: A Journal in the Foundations of Education,16(1), 15-21.
Toffler, A. (1980). The third wave. New York: Morrow. Toffler, A. (1990). Powershift. New York: Bantam.
U.S. Bureau of the Census. (1975). Historical statistics of the United States, colonial times to 1970, Bicentennial Edition, Part 2. Washington, DC: Author.
Van Duijn, J. J. (1983). The long wave in economic life. London: George Allen & Unwin.
Ways, M. (1964). The era of radical change. Fortune,64(5), 113-115, 210, 215, 216.
Wright, T. (1990). Challenges facing educators. The Technology Teacher,
50(2), 3-5.
Zais, R. S. (1976). Curriculum: Principles and foundations. New York: Harper & Row.
Zirbel, J. H. (1991). Needs assessment for manufacturing engineering technologists. Unpublished doctoral dissertation, Texas A&M University, College Station, TX.
A Comparison of Principles of Technology
and High School Physics Student Achievement Using
a
Principles of Technology Achievement Test
John Dugger and David Johnson
Society has traditionally taken the position that education is a primary means of achieving national goals. Unfortunately, we have never collectively agreed upon “what kind” of education is needed--general or vocational. The present K-12 public educational system in the United States is comprised of general and vocational education tracts.
Historically, one of the goals of vocational education has been to provide entry-level job skills. In contrast, general education, as the title implies, has attempted to equip students for living or for further education. In preparing students to enter the workforce, vocational education can provide an opportu-nity to obtain hands-on experiences with many of the theoretical concepts pre-sented within the general education classes. Many secondary education students, however, never take vocational courses because they do not view them as relevant to college preparation (Meier, 1991). Conversely, many vocational education students are not taught the theoretical mathematics and science con-cepts that are needed to cope with a rapidly changing society.
Vocational education has been considered a separate discipline within the broad context of education and has been in continuous competition with general education for students and resources. Vocational education has been concerned with providing people with gainful employment after graduation. A “Blue Collar” affiliation is considered undesirable by those students wanting to attend college or obtain further education. The unfortunate outcome is that the average high school graduate is “nonfunctional” in our modern society (Cummins, 1989).
If education is designed to help the individual attain self- fulfillment in a technologically complex, work-oriented society, then education must be a synthesis of both general and vocational education. Anything less jeopardizes the individual's opportunity for self-fulfillment.
A knowledge of how to integrate mathematics and science into technol-ogy is a necessity in today's society and those individuals who cannot function at that level will effectively be disenfranchised from participating fully in our national life. In fact, those citizens not educated in science will be unable to make informed decisions regarding such issues as nuclear energy, radiation, and pollution (The National Commission on Excellence in Education, 1983).
Many Iowa high school vocational education programs provide minimal exposure to anything beyond basic principles of mathematics and science. Consequently, students choosing the vocational rather than general education track run the risk of not obtaining an adequate mathematics and science back-ground. They will be incapable of comprehending the technologically complex society of the 1990s and beyond. This common occurrence might be avoided by establishing a stronger relationship between general and vocational education programs at the high school level.
Newly approved federal legislation has been designed to improve existing vocational programs by strengthening the linkage with general education in the areas of mathematics and science. The Carl D. Perkins Acts of 1984 provided considerable emphasis on the importance of mathematics and science principles within vocational education programs, and was seen as a positive step toward better academic relationships between vocational and general education pro-grams. The newly approved Carl D. Perkins Vocational and Applied Tech-nology Education Act of 1990 became law on September 25, 1990. In signing this law, President George Bush authorized $1.6 billion in federal funds to improve:
...educational programs leading to academic and occupational skills competen-cies needed to work in a technologically advanced society (Section 2).
The Perkins Act of 1990 holds considerable opportunity for both voca-tional and general education in building and reinforcing what Erekson and Herschbach (1991) refer to as “strategic partnerships.” These collaborative ef-forts can be instrumental in providing educational programs which integrate vocational and general education concepts, making them relevant in today's technological society.
One promising development designed to infuse general education math-ematics and science concepts into the high school vocational education curric-ulum is entitled Principles of Technology (PT). This program was developed by the Center for Occupational Research and Development (CORD) in Waco, Texas in the mid 1980s to supplement vocational offerings in secondary pro-grams.
Principles of Technology--Purposes and Description
four-teen concept modules is studied within the context of electrical, mechanical, fluid and thermal energy systems.
FIRST YEAR CONCEPTS Force
Work Rate Resistance Energy Power
Force Transformation
SECOND YEAR CONCEPTS Momentum
Waves and vibration Energy conversions Transducers Radiation Optical systems Time constraints
Figure 1. Principles of Technology Concepts
Purpose of the Study
Since the State of Iowa had invested heavily in the Principles of Tech-nology program through vocational education, it was important to complete a summative evaluation of this program. The amount of achievement gained by students based on exposure to the first year Principles of Technology program was of interest to the State of Iowa and program developers. Since the program was designed to cover basic physics concepts, it was also important to compare the gain with any gain that was due to exposure to a basic high school physics class. Accordingly, the purpose of this study was to compare student achieve-ment regarding certain basic physics concepts between students who had com-pleted first year Principles of Technology and students who had comcom-pleted high school Physics.
Method of Study
The methodology employed in this study included population and sam-pling procedures, instrument development procedures, data collection, and data analysis. A pre-test post-test control design was utilized with two treatment groups. The following figure depicts this design.
Principles of Technology T1 X1 T2
Physics T1 X2 T2
Control T1 T2
T1 = Pre-T2 =
Post-X1 = PT Treatment X2 = Physics Treatment
Figure 2. Research Design Model
Population and Sample
The population for this study was all secondary vocational programs in Iowa where Principles of Technology was offered. With more than 50 sites of implementation, Iowa was a good location for the study. The sites were at various stages of implementation. Sixteen sites had offered the program for two years or more. In order to obtain a better estimate of the effectiveness of the program, only sites that had offered the program for at least two years were utilized. Therefore, the sample included these 16 Iowa sites.
edu-cation teacher failed to complete the study. Therefore, the sample for this study consisted of 15 Iowa high schools where Principles of Technology and physics were taught as a part of the regular curriculum.
Instrument Development
The procedure involved the generation of a test item bank covering all objectives for the first seven units or the first year of Principles of Technology. Conversations with many people involved with the course suggested that during the first year only six units could be covered rather than seven. Therefore, the questions on the instrument were limited to only those first six units. The item bank was generated by participants and project staff at Iowa State University during the summer Principles of Technology workshops. Multiple items for each objective were generated. These items were then examined by the project staff and modified to improve clarity and assure good testing procedure. Five secondary physics teachers and one community college physics instructor were hired to revise items as necessary to standardize terminology that may differ in Principles of Technology materials and Iowa high school physics materials. It was determined that a number of terms differed and where differences existed, both the Principles of Technology term and the term found in typical physics textbooks or materials were used.
These items were then formed into 40 question unit tests and adminis-tered at the 15 sites. An analysis of the six unit test yielded degree of difficulty scores for each item and the degree to which each item correlated with the total unit score. This information was utilized in the selection of items to be cluded in the overall first year Principles of Technology instrument. This in-strument consisted of 120 questions and covered each of the six units.
Data Collection
The data collection phase involved two steps. The first step was the ad-ministration of the pre-test, a form of the 120 question instrument developed in the previous phase. The second step was the administration of a post-test at the end of the academic year at each of the 15 sites.
The two treatment groups included students enrolled in a Principles of Technology first year class and students enrolled in a high school physics class at each of the 15 sites. The control group consisted of students who were en-rolled in neither the Principles of Technology nor physics, but had a similar male-female ratio and similar achievement on the Iowa Test of Educational Development (I.T.E.D.) as the students enrolled in the Principles of Technology class.
The pre-test data were collected during the first two weeks of September. The post-test data were collected during the first two weeks of May. The rel-atively early post-test data collection was necessary since many seniors com-plete their coursework during this time.
The data analysis procedures included both an item analysis of the pre-test and post-pre-test results along with a one-way analysis of variance of the treatments and control groups. The results of these analyses are reported in the next section.
Results
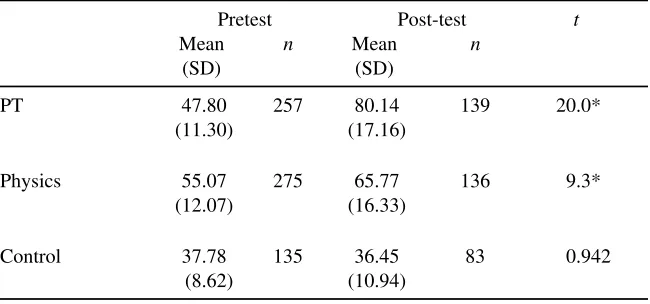
The focus of this section is on the achievement measures for both the pre-tests and post-tests for all three groups. Pre-test and post-test scores are listed for all groups in Tables 1 and 2.
Table 1
Differences Between Pre- and Post-test Scores For Treatment and Control Groups
Pretest Post-test t
Mean n Mean n
(SD) (SD)
PT 47.80 257 80.14 139 20.0*
(11.30) (17.16)
Physics 55.07 275 65.77 136 9.3*
(12.07) (16.33)
Control 37.78 135 36.45 83 0.942
(8.62) (10.94)
*p<.01
The higher mean pre-test by the physics students suggests that science achievement may be initially higher in this group.
The number of subjects taking the post-test was reduced significantly when compared to the pre-test numbers. Follow-up calls to the sites indicated that many seniors were not available during post-test administration. It was discovered that many Iowa schools release their seniors up to three weeks prior to the end of the semester. Normal class attrition was also a factor.
The Principles of Technology students scored significantly higher than the other two groups on the first year post-test. Although the physics group displayed a gain, it was not nearly as great as the gain for the PT students. Pre-test, post-test, and levels of significance for each of the three groups are listed. A significant increase in student achievement was one outcome of ex-posure to the first six Principles of Technology units.
Based on Principles of Technology pre- and post-test results, it appears that exposure to the first six units of the Principles of Technology results in significant student achievement gains regarding basic physics principles. It appears reasonable to conclude that the methodologies employed by this very structured program are appropriate for the content covered. If one assumes that the content is necessary and useful for the majority of the students, then most school districts should seriously consider the Principles of Technology as an offering for a wide range of students. This is consistent with the claim that PT was designed for students that fall between the 25th and 75th percentiles.
Although never intended to replace Physics, the Principles of Technology first year course does a significantly better job in increasing student achieve-ment regarding basic physics concepts as defined by the Principles of Tech-nology program. One must exercise caution in drawing inferences regarding the two programs since physics also is responsible for covering higher level concepts that are not considered basic and may be considered non-intuitive. One may conclude that the Principles of Technology does an excellent job in addressing the objectives as listed at the beginning of each unit. The test questions used for the pre- and post-test were drawn from these objectives.
Several questions remain however:
1. How will students who have completed Principles of Technology perform on standardized physics achievement tests?
2. If Principles of Technology is taught entirely by certified physics teachers, will the student achievement scores increase or decrease?
References
Meier, R. L. (1991). Participation in secondary vocational education and its relationship to college enrollment and major. Journal of Industrial Teacher Education, 28(2), 47-60.
Cummins, A. J. (1989). Let the revolution begin. Industrial Education,78(9), 4.
The National Commission on Excellence in Education. (1983). A nation at risk: The imperative for educational reform. Washington, DC: U.S. Government Printing Office.
Erekson, T. L., & Herschbach, D. (1991). Perkins act of 1990 has key pro-visions for technology education. School Shop, 50(8), 16-18.
Post Hoc Analysis of Test Items
Written by Technology Education Teachers
W. J. Haynie, III
Technology education teachers frequently author their own tests. The effectiveness of tests depends upon many factors, however, it is clear that the quality of each individual item is of great importance. This study sought to determine the quality of teacher-authored test items in terms of nine rating factors.
Background
Most testing in schools employs teacher-made tests (Haynie, 1983, 1990, 1991; Herman & Dorr-Bremme, 1982; Mehrens & Lehmann, 1987; Newman & Stallings, 1982). Despite this dependance upon teacher-made tests, Stiggins, Conklin, and Bridgeford (1986) point out that “nearly all major studies of testing in the schools have focused on the role of standardized tests” (p. 5).
Research concerning teacher-constructed tests has found that teachers lack understanding of measurement (Fleming & Chambers, 1983; Gullickson & Ellwein, 1985; Mehrens & Lehmann, 1987; Stiggins & Bridgeford, 1985). Research has shown that teachers lack sufficient training in test development, fail to analyze tests, do not establish reliability or validity, do not use a test blueprint, weight all content equally, rarely test above the basic knowledge level, and use tests with grammatical and spelling errors (Burdin, 1982; Carter, 1984; Gullickson, 1982; Gullickson & Ellwein, 1985; Hills, 1991). Technically their tests are simplistic and depend upon short answer, true-false, and other easily prepared items. Their multiple-choice items often have serious flaws--especially in distractors (Haynie, 1990; Mehrens & Lehmann, 1984, 1987; Newman & Stallings, 1982).
A few investigations have studied the value of tests as aids to learning subject content (Haynie, 1987, 1990, 1991; Nungester & Duchastel, 1982). Time on-task has been shown to be very important in many studies (Jackson, 1987; Salmon, 1982; Seifert & Beck, 1984). Taking a test is a time on-task learning activity. Works which studied testing versus similar on-task time spent in structured review of the material covered in class have had mixed results, but testing appears to be at least as effective as reviews in promotion of learning
(Haynie, 1990; Nungester & Duchastel, 1982). Research is lacking on the quality of tests and test items written by technology education teachers.
Purpose
The purpose of this investigation was to study the quality of technology education test items written by teachers. Face validity, clarity, accuracy in identifying taxonometric level, and rates of spelling and punctuation errors were some of the determinants of quality assessed. Additionally, data were collected concerning teachers' experience levels, highest degree held, and sources of training in test construction. The following research questions were addressed in this study:
1. What types of errors are common in test items?
2. Do the error rate or types of errors in teacher constructed test items vary with demographic factors?
3. Do teachers understand how to match test items to curriculum content and taxonometric level?
Methodology Source of Data
Between April 23, 1988 and January 8, 1990, a team of 15 technology education teachers worked to develop test items for a computerized test item bank for the North Carolina State Department of Public Instruction (SDPI). The work was completed under two projects funded by SDPI and directed by DeLuca and Haynie (1989, 1990) at North Carolina State University. The data for this study came from the items developed in those projects.
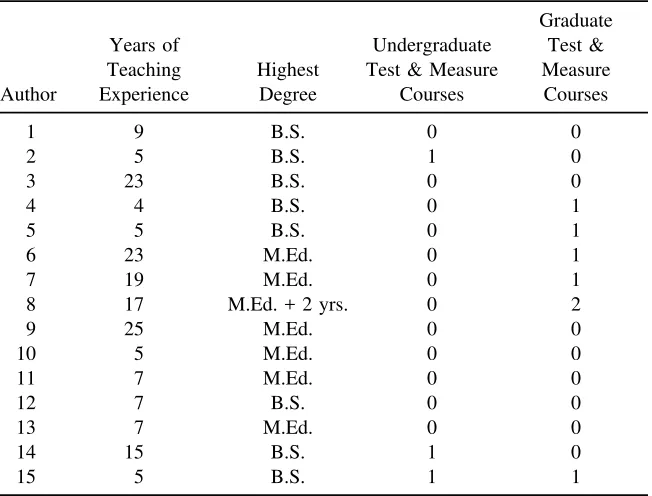
Test Item Authors
Table 1
Profile of Authors' Demographic Factors
Graduate
Years of Undergraduate Test &
Teaching Highest Test & Measure Measure
Author Experience Degree Courses Courses
1 9 B.S. 0 0
2 5 B.S. 1 0
3 23 B.S. 0 0
4 4 B.S. 0 1
5 5 B.S. 0 1
6 23 M.Ed. 0 1
7 19 M.Ed. 0 1
8 17 M.Ed. + 2 yrs. 0 2
9 25 M.Ed. 0 0
10 5 M.Ed. 0 0
11 7 M.Ed. 0 0
12 7 B.S. 0 0
13 7 M.Ed. 0 0
14 15 B.S. 1 0
15 5 B.S. 1 1
Training of Authors
Teachers came to the university campus for a workshop on April 23, 1988. Project directors oriented teachers to the computerized test bank, re-viewed the revised technology education curriculum, and explained how to develop good test items. A 13 page instructional packet was also given to each author. It should be noted that the training session and instructional packet may confound attempts to generalize these findings.
The authors were required to develop and properly code six items which were submitted for approval and corrective feedback before they were allowed to proceed. The teachers who authored the items were paid an honorarium for their services.
Editing and Coding of Items
Each item was prepared on a separate sheet of paper with a coding sheet attached and completed by the teacher. The coding sheet identified the author, the specific objective tested, the taxonometric level, and information for the computerized system. The project directors edited the items with contrasting colored felt tip pens on the teachers' original forms.
The data for this investigation were the editing markings on the original test items submitted by the teachers. Scores for 9 scales of information were recorded for analysis. Each of the scales was established so that a low score would be optimal. The scales were Spelling Errors (SE), Punctuation Errors (PE), Distractors (D), Key (K), Usability (U), Validity (V), Stem Clarity (SC), Taxonomy (TX), and an overall Quality (Q) rating. After all of the ratings were completed, the General Linear Models (GLM) procedure was used for F testing and the LSD procedure was used when t-tests were appropriate.
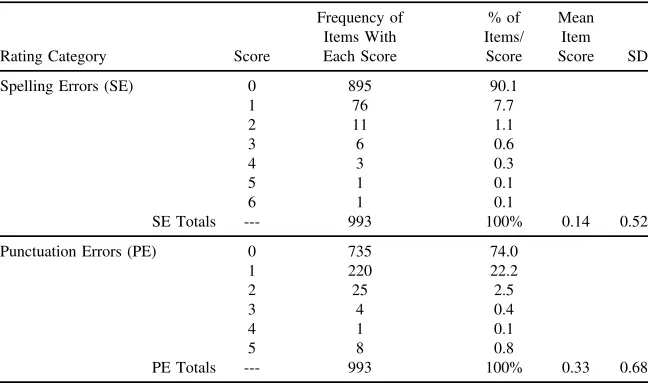
Findings Spelling Errors (SE)
The frequency and percentage of scores for the 993 items on the nine ratings, and mean scores of each factor, are shown in Table 2. An item's SE rating indicates how many words were misspelled in the item. There were 98 items (10%) which had one or more spelling errors. Spelling errors are detri-mental to good teaching and testing. However the literature shows that this problem is common to other disciplines.
Table 2
Ratings of Test Item Quality
Frequency of % of Mean Items With Items/ Item Rating Category Score Each Score Score Score SD Spelling Errors (SE) 0 895 90.1
1 76 7.7
2 11 1.1
3 6 0.6
4 3 0.3
5 1 0.1
6 1 0.1
SE Totals --- 993 100% 0.14 0.52 Punctuation Errors (PE) 0 735 74.0
1 220 22.2
2 25 2.5
3 4 0.4
4 1 0.1
5 8 0.8
Table 2 (cont.) Stem Clarity (SC) 0 602 60.6
1 352 35.4
The authors were compared on each of the scales to determine whether they differed significantly and to see if similar or dissimilar errors were made by different authors. On the spelling errors factor authors were found to differ significantly: F(14, 978) = 11.99, p<.0001. Follow-up analysis with the LSD procedure showed that 5 authors had significantly fewer spelling errors and 3 authors had more than the average number of errors in spelling (Table 3). Two of the authors with numerous spelling errors also had other defects and were rated significantly worse in the overall Quality (Q) rating (authors 1 and 9). However, only 1 of the authors with a significantly low rate of spelling errors was rated favorably in the Quality rating, so spelling accuracy alone is insuffi-cient to identify good test item writing ability.
Table 3
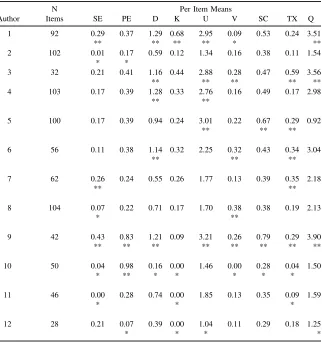
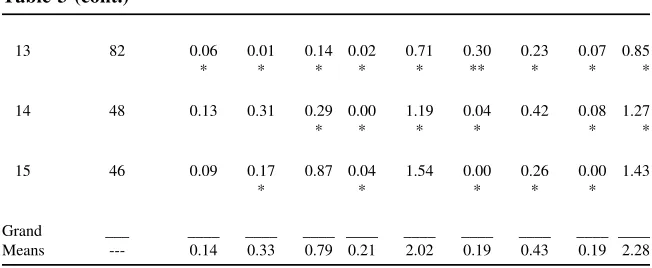
Means of each Author on the 9 Rating Categories
N Per Item Means
Author Items SE PE D K U V SC TX Q 1 92 0.29 0.37 1.29 0.68 2.95 0.09 0.53 0.24 3.51
** ** ** ** * **
2 102 0.01 0.17 0.59 0.12 1.34 0.16 0.38 0.11 1.54
* *
3 32 0.21 0.41 1.16 0.44 2.88 0.28 0.47 0.59 3.56
** ** ** ** **
4 103 0.17 0.39 1.28 0.33 2.76 0.16 0.49 0.17 2.98
** **
5 100 0.17 0.39 0.94 0.24 3.01 0.22 0.67 0.29 0.92
** ** **
6 56 0.11 0.38 1.14 0.32 2.25 0.32 0.43 0.34 3.04
** ** **
7 62 0.26 0.24 0.55 0.26 1.77 0.13 0.39 0.35 2.18
** **
8 104 0.07 0.22 0.71 0.17 1.70 0.38 0.38 0.19 2.13
* **
9 42 0.43 0.83 1.21 0.09 3.21 0.26 0.79 0.29 3.90 ** ** ** ** ** ** ** **
10 50 0.04 0.98 0.16 0.00 1.46 0.00 0.28 0.04 1.50
* ** * * * * *
11 46 0.00 0.28 0.74 0.00 1.85 0.13 0.35 0.09 1.59
* * *
12 28 0.21 0.07 0.39 0.00 1.04 0.11 0.29 0.18 1.25
Table 3 (cont.)
13 82 0.06 0.01 0.14 0.02 0.71 0.30 0.23 0.07 0.85
* * * * * ** * * *
14 48 0.13 0.31 0.29 0.00 1.19 0.04 0.42 0.08 1.27
* * * * * *
15 46 0.09 0.17 0.87 0.04 1.54 0.00 0.26 0.00 1.43
* * * * *
Grand ___ ____ ____ ____ ____ ____ ____ ____ ____ ____ Means --- 0.14 0.33 0.79 0.21 2.02 0.19 0.43 0.19 2.28
Note. There were 993 items. * Significantly low (better), p<.05. ** Significantly high (worse), p<.05.
Years of teaching experience and other demographic data were presented in Table 1. Teachers were divided into two groups of experience level: fewer than 8 years experience (8 teachers who authored 557 items), and more than 8 years experience (7 authors, 436 items). On the Spelling Errors factor these groups were compared and there was a significant finding of F(1, 991) = 10.48, p<.0012. Follow-up analysis by the LSD procedure showed that the less ex-perienced teachers had significantly fewer spelling errors. None of the other demographic variables were found to differ significantly on the rate of spelling errors.
Punctuation Errors (PE)
The PE rating (Table 2) was the total number of punctuation errors. The most frequent errors were omission of punctuation at the end of the stem or use of the wrong punctuation there. Frequently statements were ended with ques-tion marks or stems which should have ended with a colon were left with no punctuation. This score may be inflated spuriously by those unique errors which may not have been made in normal prose writing by the same teachers. Among the 15 authors, a significant difference was found in the PE category: F(14, 978) = 8.12, p<.0001 (Table 3). No significant differences were found among any demographic variables on the rate of punctuation errors.
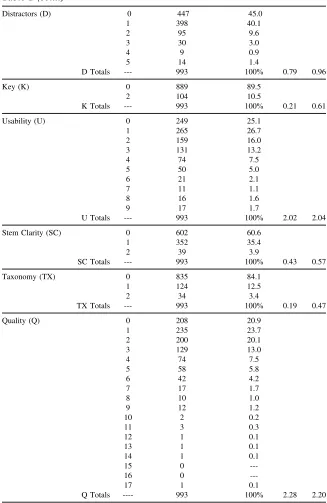
Distractors (D)
Errors in distractors other than spelling or punctuation were summed in the Distractors (D) category (Table 2). Frequently these errors either eliminated distractors or targeted the correct answer due to incompatibility between the stem and the alternatives because of lack of agreement in: singular-plural, in-troductory article, tense, or in one case even gender.
lower error rates. Two of those 3 authors who had superior distractors were also among the best in the overall Quality rating. All three of the authors who rated poorest in the overall Quality rating, also rated significantly worse in this Distractors category. Apparently this is one aspect of test writing which needs to be stressed to teachers.
All 4 of the demographic variables studied were found to be significantly related to errors in distractors: Years of experience, F(1, 991) = 10.55, p<.0012, the less experienced teachers authored superior distractors; Highest degree held, F(1, 991) = 23.21, p<.0001, those with graduate degrees wrote better distrac-tors; Undergraduate courses, F(1, 991) = 11.46, p<.0007, those who had taken an undergraduate testing and measurement course prepared better distractors; and Graduate courses, F(1, 991) = 13.23, p<.0003, graduate courses also ap-peared beneficial.
Key (K)
The Key (K) rating simply indicates whether the answer marked in the teacher's original version of the item was indeed correct. Since incorrect keying was considered a more damaging error than a misspelled word or other common error, a rating of 2 was given for incorrectly keyed items. This resulted in greater increase of the summation categories (Usability and Quality) due to in-correct keying than for other types of errors. Regrettably, 10.5% of the items were keyed incorrectly (Table 2).
The authors differed significantly in the Key rating: F(14, 978) = 8.01, p<.0001. Table 3 shows the teachers' means and the results of LSD compar-isons. Six authors keyed their items more accurately than others and one teacher was very inaccurate in keying. Teachers with less than eight years of experience keyed more accurately than more experienced teachers, F(1, 991) = 19.82, p<.0001; and teachers with graduate degrees also more accurately keyed their items, F(1, 991) = 12.90, p<.0003.
Usability (U)
The Usability (U) rating was found by counting all proofreading and ed-iting marks of all types on the teachers' original forms--thus it included the sum of all the above categories plus other errors and defects not included in them. An example of an error which would not be counted in the first four ratings but would be included here is an item which begins with a blank. Such an item would have a U rating which equalled the sum of all SE, PE, D, and K ratings plus 1.
testing and measurement courses appeared to be effective in helping teachers develop usable items: Undergraduate courses, F(1, 991) = 26.68, p<.0001; and Graduate courses, F(1, 991) = 12.05, p<.0005.
Validity (V)
Items were carefully read and compared to the objectives they were in-tended to test. A Validity (V) rating of 0 indicated the item clearly possessed face validity. An item which was obviously off the subject was rated 2 and items which tested information immediately adjacent to the intended informa-tion were rated 1 to indicate that validity was quesinforma-tionable.
The authors differed significantly in how valid their items appeared to be: F(14, 978) = 3.99, p<.0001. It is noteworthy that the Validity rating did not necessarily correspond to others in the study. One of the authors (number 1) who rated significantly better in terms of validity was one of the worst rated authors in five other categories. Likewise, one other author (number 13) who rated superior in eight other categories (including Q) was significantly worse in the Validity category.
The findings related to the demographic variables were: Less experi-enced teachers wrote more valid items, F(1, 991) = 4.32, p<.038; teachers with only Bachelor's degrees wrote more valid items than those with graduate de-grees, F(1, 991) = 11.47, p<0007; teachers who had experienced undergraduate test and measurement courses submitted more valid items, F(1, 991) = 9.29, p<.0024; and graduate courses also helped teachers write more valid items, F(1, 991) = 10.01. p<.0018.
Stem Clarity (SC)
Stem Clarity (SC) was a subjective rating indicating how clearly under-standable the stem appeared. If the item's stem seemed clear enough to lead knowledgeable students to the correct response, regardless of other types of errors (SE, PE, D, K, U, or V ratings), then that item was rated 0 in the SC category. Items which were confusing to read with no clear purpose set forth in the stem were rated 2. Items which would likely work but had some element of confusion were rated 1. Table 2 shows that most items were judged to be reasonably clear in intention.
The finding of F(14, 978) = 4.57, p<.0001 documents that teachers did vary in their ability to write clear item stems. It would seem reasonable to assume that authors who made many spelling and punctuation errors would also have difficulty wording their stems clearly. This, however, was not true in these findings. Of the demographic factors investigated, only highest degree held was related to the ability to prepare clearly worded stems: F(1, 991) = 6.34, p<.0120, teachers with graduate degrees developed superior items in terms of stem clarity.
The Taxonomy (TX) rating indicates the extent to which teachers accu-rately identified the taxonometric level of the cognitive domain for each item. Teachers prepared items to match specific objectives and then coded them. The codes used were derived from the first three levels of Bloom's Taxonomy: 1 indicated simple knowledge, 2 indicated comprehension, and 3 indicated ap-plication or higher levels of learning.
Of the 993 items prepared for the test item bank, the authors indicated that they felt 559 (56%) operated at level 1 (knowledge), 379 (38%) operated at level 2 (comprehension), and only 55 (5.5%) operated at level 3 (application or above). The rating in the TX category assigned for this study indicates how well, in the researcher's judgement, the item authors had accurately identified the proper taxonometric level. This was done after reading the objective to be tested by each item and then carefully reading the item to see if it operated at the level indicated by the teacher. A rating of 0 in the TX category indicates that the item appeared to be accurately coded by the teacher. A rating of 2 indicated that there was a clear mismatch between the level at which the teacher desired the item to function and the level at which the researcher judged the item would actually operate. Ratings of 1 in the TX category indicate that the researcher felt the author's coding was questionable.
Table 2 shows that 84% (835) of the items had been correctly coded for taxonometric level. Teachers did vary significantly in their ability to code items according to taxonomy: F(14, 978) = 5.20, p<.0001. All teachers who rated poor in this rating also had poor ratings in at least one other category, most rated poor in at least two others. Teachers who rated superior in the TX rating also rated superior in at least two other ratings. Teachers with less than 8 years of experience were significantly more accurate in coding by taxonomy than the more experienced teachers, F(1, 991) = 21.08, p<.0001. Undergraduate test and measurement courses, F(1, 991) = 9.29, p<.0024, appeared to be helpful in en-abling teachers to identify the correct taxonometric level of test items, however, graduate courses were not found to be a significant factor here, F(1, 991) = 2.65, p<.0711.
Quality (Q)
The overall Quality of the test items was summarized in the Q rating. The Q rating was found by summing all of the other ratings except Usability (U), which was already a partial summation. The Q ratings (Table 2) range from 0 (an item judged to need no editing of any sort and believed to operate exactly as the submitting author had intended) to a high value of 17.
and measurement courses helped teachers develop higher quality items, F(1, 991) = 35.45, p<.0001, and so did graduate courses, F(1, 991) = 11.14, p<.0009.
Discussion
Though the sample included only 15 teachers, the findings presented in this study suggest that technology education teachers have some of the same difficulties in developing useful test items that teachers in other disciplines face. Despite the fact that these carefully selected teachers were given special training to improve their items, less than 21% of the items they prepared were flawless. Earlier works identified spelling, punctuation, grammar, clarity, validity, reli-ability, taxonometric level, problems in distractors, and other mechanical factors to be problem areas in teacher-made tests. Six of these problems were inves-tigated in this study. Additionally, errors in keying items, a general overall quality assessment, and preparation of technology education teachers to write test items were factors considered by this study.
It was demonstrated that teachers differed significantly in their ability to prepare good test items, and that undergraduate and graduate courses in testing and measurement, though they appear to be helpful in many ways, are not taken by all teachers. These courses improved teachers' ability in developing dis-tractors, and preparing valid and useful items. Undergraduate courses were also shown to help teachers identify the proper taxonometric level of their items.
Teachers with graduate degrees developed items which were superior in 5 of the ratings in this study: distractors, keying of items, usability, stem clarity, and overall quality. However, teachers who had only Bachelor's degrees were significantly better in developing items judged to have good face validity.
Teachers with fewer than 8 years of experience developed items with better overall quality (Q rating) than those who had more experience. The less experienced teachers significantly outperformed their more experienced peers on 7 of the quality factors studied: spelling, distractors, key accuracy, usability, validity, taxonomy, and overall quality. These findings were unanticipated and could possibly be explained by any of several competing theories. Perhaps teachers who have been in the profession longer than 8 years have begun to burn out and have less time or patience to devote to extra assignments such as the test item development projects in which they participated. Alternatively, it could simply be true that teachers who earned their degrees in recent years had received better preparation to develop test items. Still another possibility is that this could be a spurious finding due to the small sample size (15 teachers) or some other unknown error in sampling.
valid) were in fact usefully valid or could become valid when switched with neighboring items on the same test, then it would be safe to conclude that these technology teachers can develop reasonably valid tests.
Previous research has shown tests to be time on-task activities which promote learning of the subject matter tested. One criticism of teacher-made tests has been that they waste time. If the tests are good ones then much of the time devoted to them may be well spent. However, poorly developed tests would still be a waste of time for learning and evaluation purposes. This study identified several weaknesses in test items developed by teachers. Other fac-tors, such as selection of different types of items for differing objectives, total test validity, problems in scoring and grading, instructions to students about tests, and others could not be addressed in this particular study--but they remain as important research problems. These questions need to be answered before meaningful conclusions can be drawn about the learning value of time students spend taking teacher-made tests.
It is concluded that technology teachers could be better prepared to de-velop tests if more of them were required to take a testing and measurements course. It is also concluded that the teachers in this sample are generally ca-pable of developing valid test items, but that the items teachers prepare vary in the 9 aspects of overall quality as predicted by previous research.
References
Burdin, J.L. (1982). Teacher certification. In H.E. Mitzel (Ed.),Encyclopedia of education research (5th ed.). New York: Free Press.
Carter, K. (1984). Do teachers understand the principles for writing tests?
Journal of Teacher Education,35(6), 57-60.
DeLuca, V.W. & Haynie, W.J. (1990). Updating, computerization, and field validation of competency-based test-item banks for selected construction and communications technology education courses (Contract No. RFP 90-A-07). Raleigh, NC: North Carolina State Department of Public In-struction.
DeLuca, V.W. & Haynie, W.J. (1989). Updating, computerization, and field validation of competency-based test-item banks for selected manufacturing technology education courses(Contract No. RFP 88-R-03). Raleigh, NC: North Carolina State Department of Public Instruction.
Fleming, M. & Chambers, B. (1983). Teacher-made tests: Windows on the classroom. In W. E. Hathaway (Ed.), Testing in the schools: New di-rections for testing and measurement, No. 19(pp.29-38). San Francisco: Jossey-Bass.
Gullickson, A.R. (1982). Survey data collected in survey of South Dakota teachers' attitudes and opinions toward testing. Vermillion: University of South Dakota.
Haynie, W.J. (1983). Student evaluation: The teacher's most difficult job. Monograph Series of the Virginia Industrial Arts Teacher Education Council, Monograph Number 11.
Haynie, W.J. (1987). Anticipation of tests as a learning variable. Unpublished manuscript, North Carolina State University, Raleigh, NC.
Haynie, W.J. (1990). Effects of tests and anticipation of tests on learning via videotaped materials. Journal of Industrial Teacher Education,27(4), 18-30.
Haynie, W.J. (1991). Effects of take-home and in-class tests on delayed re-tention learning acquired via individualized, self-paced instructional texts. Manuscript submitted for publication.
Herman, J. & Dorr-Bremme, D.W. (1982). Assessing students: Teachers' routine practices and reasoning. Paper presented at the annual meeting of the American Educational Research Association, New York.
Hills, J.R. (1991). Apathy concerning grading and testing. Phi Delta Kappan, 72(7), 540-545.
Jackson, S.D. (1987). The relationship between time and achievement in se-lected automobile mechanics classes. (Doctoral dissertation, Texas A&M University).
Mehrens, W.A. & Lehmann, I.J. (1984). Measurement and Evaluation in Ed-ucation and Psychology. 3rd ed. New York: Holt, Rinehart, and Winston. Mehrens, W.A. & Lehmann, I.J. (1987). Using teacher-made measurement
devices. NASSP Bulletin, 71(496), 36-44.
Newman, D.C. & Stallings, W.M. (1982, March). Teacher competency in classroom testing, measurement preparation, and classroom testing prac-tices. Paper presented at the Annual Meeting of the National Council on measurement in Education. (In Mehrens & Lehmann, 1987)
Nungester, R.J. & Duchastel, P.C. (1982). Testing versus review: Effects on retention. Journal of Educational Psychology, 74(1), 18-22.
Salmon, P.B. (Ed.). (1982). Time on task: Using instructional time more ef-fectively. Arlington, VA: American Association of School Administra-tors.
Seifert, E.H. & Beck, J.J. (1984). Relationships between task time and learning gains in secondary schools. Journal of Educational Research, 78(1), 5-10. Stiggins, R.J. & Bridgeford, N.J. (1985). The ecology of classroom
assess-ment. Journal of Educational Measurement, 22(4), 271-286.
Stiggins, R.J., Conklin, N.F. & Bridgeford, N.J. (1986). Classroom assessment: A key to effective education. Educational Measurement: Issues and Practice, 5(2), 5-17.