Consolidated Financial Statements
Three Months Ended March 31, 2007 and 2006
CONSOLIDATED FINANCIAL STATEMENTS THREE MONTHS ENDED MARCH 31, 2007 AND 2006
Table of Contents
Page
Consolidated Balance Sheets ………. 1-2
Consolidated Statements of Income ……….. 3
Consolidated Statements of Changes in Shareholders’ Equity ………. 4
Consolidated Statements of Cash Flows ……….. 5-6
Notes to the Consolidated Financial Statements .……… 7-52
The accompanying notes form an integral part of these consolidated financial statements.
ASSETS
CURRENT ASSETS
Cash and cash equivalents 2c,3 86,513,219,849 541,468,711,901
Time deposits 2c 8,067,848,706 -
Short-term investments 2d 2,770,950,000 5,428,752,650
Trade receivables 2e,4,12
Related party 2f,23 60,971,894,946 46,416,931,151
Third parties - net of allowance for doubtful accounts of Rp11,210,612,391 in 2007
and Rp13,944,435,448 in 2006 24j 557,838,647,562 461,472,550,589
Other receivables from third parties - net of allowance for doubtful accounts of
Rp7,371,980,358 in 2007 and 2006 2e,5 6,500,891,354 4,006,606,142
Inventories - net 2g,6,12 921,214,186,005 943,280,245,478
Advances and deposits 6,24a 102,294,023,781 106,230,907,376
Prepaid taxes 11 17,733,015,096 40,625,164,964
Prepaid expenses 2h 16,763,467,511 36,533,350,472
TOTAL CURRENT ASSETS 1,780,668,144,810 2,185,463,220,723
NON-CURRENT ASSETS
Due from related parties 2f,23 46,889,042,925 56,081,036,406
Deferred tax assets - net 2r,11 6,797,718,944 5,718,456,384
Long-term investments and advances to associated company - net of allowance for doubtful accounts of Rp13,720,944,026
in 2007 and 2006 2b,2f,7,23 51,275,799,728 42,690,568,791
Fixed assets - net of accumulated depreciation, amortization and depletion of
Rp4,454,485,460,272 in 2007 and 2i,2j,2k,
Rp3,967,983,212,400 in 2006 2l,8,12 7,619,385,949,387 7,739,353,735,791
Restricted cash and time deposits 12,13 479,000,000 299,483,267,199
Other non-current assets 2h,2m,8 73,462,124,438 73,675,486,494
TOTAL NON-CURRENT ASSETS 7,798,289,635,422 8,217,002,551,065
TOTAL ASSETS 9,578,957,780,232 10,402,465,771,788
Notes 2007 2006
Other payables to third parties 8,17,24i 132,971,932,492 86,720,731,178
Accrued expenses 12,20 148,875,632,729 161,803,958,936
Taxes payable 2r,11 47,940,778,829 53,642,881,039
Derivative liabilities - net 2q - 33,035,816,231
Current maturities of long-term debts
Loans from banks and financial institutions 2f,12,23 256,304,049,660 363,000,000,000
Obligations under capital lease 2k,8,13 2,953,637,895 1,473,933,488
TOTAL CURRENT LIABILITIES 736,724,037,248 793,856,941,716
NON-CURRENT LIABILITIES
Long-term debts - net of current maturities
Loans from banks and financial institutions 2f,12,23 1,929,168,661,555 3,082,601,392,630
Obligations under capital lease 2k,8,13 5,194,044,142 79,833,330
Long-term derivative liabilities 2q,25 56,594,185,952 85,143,065,700
Due to related party 2f,23 2,204,815,100 2,884,731,761
Deferred tax liabilities - net 2r,11 611,620,857,604 570,581,955,706
Estimated liability for employee benefits 2o,22 57,760,930,547 49,264,767,809
Estimated liability for post-retirement health-
care benefits 2o,22 8,209,419,897 5,223,822,813
Provision for recultivation 24q 17,632,817,688 12,234,423,515
Deferred gain on sale-and-leaseback
transactions - net 2k 6,886,988,985 8,030,256,641
TOTAL NON-CURRENT LIABILITIES 2,695,272,721,470 3,816,044,249,905
SHAREHOLDERS’ EQUITY
Capital stock - Rp500 par value per share
Authorized - 8,000,000,000 shares
Issued and fully paid - 3,681,231,699 shares 14 1,840,615,849,500 1,840,615,849,500
Additional paid-in capital 2t,15 1,194,236,402,048 1,194,236,402,048
Other paid-in capital 16 338,250,000,000 338,250,000,000
Revaluation increment in fixed assets 2i 229,970,296,236 229,970,296,236
Differences arising from restructuring transactions among entities under
common control 2b 1,165,715,376,569 1,165,715,376,569
Differences arising from changes in the equity
of Subsidiaries 2b 2,674,681,975 5,032,494,359
Retained earnings
Appropriated 18 150,000,000,000 125,000,000,000
Unappropriated 1,225,498,415,186 893,744,161,455
TOTAL SHAREHOLDERS’ EQUITY 6,146,961,021,514 5,792,564,580,167
TOTAL LIABILITIES AND SHAREHOLDERS’ EQUITY 9,578,957,780,232 10,402,465,771,788
The accompanying notes form an integral part of these consolidated financial statements.
NET REVENUES 2f,2n,19,
23,24j,24l 1,480,598,532,258 1,429,937,334,858
COST OF REVENUES 2f,2n,20,23,
24c,24d,24m,
Delivery and selling 218,398,970,755 179,317,028,779
General and administrative 41,662,745,727 40,594,936,512
Total Operating Expenses 260,061,716,482 219,911,965,291
INCOME FROM OPERATIONS 213,202,385,903 270,394,562,079
OTHER INCOME (EXPENSE)
Interest income 2,117,268,262 7,215,313,189
Interest expense 12,13 (55,780,934,507) (79,193,489,568)
ASSOCIATED COMPANIES - NET 2b,7 2,024,603,805 1,118,433,844
Total Corporate Income Tax Expense 51,670,433,390 77,229,162,088
NET INCOME 112,497,941,755 164,484,119,849
BASIC EARNINGS PER SHARE 2u 30.56 44.68
Differences Arising
from Restructuring Differences Arising
Additional Revaluation Transactions among from Changes Retained Earnings Net
Paid-in Capital * Increment Entities under in the Equity Shareholders’
Notes Capital Stock (Notes 15 and 16) in Fixed Assets Common Control of Subsidiaries Appropriated Unappropriated Equity
Balance as of December 31, 2005 1,840,615,849,500 1,532,486,402,048 229,970,296,236 1,165,715,376,569 6,333,962,836 125,000,000,000 729,260,041,606 5,629,381,928,795
Net income - - - - - - 164,484,119,849 164,484,119,849 Changes in the equity of a Subsidiary arising from foreign
currency translation adjustment 2b - - - - (1,301,468,477 ) - - (1,301,468,477 )
Balance as of March 31, 2006 1,840,615,849,500 1,532,486,402,048 229,970,296,236 1,165,715,376,569 5,032,494,359 125,000,000,000 893,744,161,455 5,792,564,580,167
Balance as of December 31, 2006 1,840,615,849,500 1,532,486,402,048 229,970,296,236 1,165,715,376,569 973,936,686 150,000,000,000 1,113,000,473,431 6,032,762,334,470
Net income - - - - - - 112,497,941,755 112,497,941,755 Changes in the equity of a Subsidiary arising from foreign
currency translation adjustment 2b - - - - 230,445,289 - - 230,445,289 Changes in the equity of a Subsidiary arising from the
recovery from decline in market values of its
investments in available-for-sale securities 2b,2d - - - - 1,470,300,000 - - 1,470,300,000
Balance as of March 31, 2007 1,840,615,849,500 1,532,486,402,048 229,970,296,236 1,165,715,376,569 2,674,681,975 150,000,000,000 1,225,498,415,186 6,146,961,021,514
The accompanying notes form an integral part of these consolidated financial statements. CASH FLOWS FROM OPERATING ACTIVITIES
Collections from customers 1,609,890,242,538 1,593,228,617,777
Payments to suppliers and contractors, and for
salaries and other employees’ benefits (1,237,238,265,980) (1,207,246,265,091)
Cash provided by operations 372,651,976,558 385,982,352,686
Proceeds from claims for tax refund 11 5,849,216,775 -
Receipts of interest income 1,365,798,093 5,235,663,713
Payments of taxes (166,829,905,481) (75,383,612,317)
Payment of interest expense and
other financial charges (70,162,842,786) (27,984,208,328)
Net receipts from other operating activities 17,772,266,221 32,199,503,710
Net Cash Provided by Operating Activities 160,646,509,380 320,049,699,464
CASH FLOWS FROM INVESTING ACTIVITIES
Proceeds from sale of fixed assets 8 95,000,000 232,928,000
Purchases of fixed assets (50,763,128,792) (33,510,239,390)
Net Cash Used in Investing Activities (50,668,128,792) (33,277,311,390)
CASH FLOWS FROM FINANCING ACTIVITIES
Proceeds from short-term borrowings 45,450,000,000 -
Payment of bank loans (109,032,693,683) -
Net payment for derivative transactions (4,075,890,000) (6,552,384,970)
Payment of obligations under capital lease 13 (202,914,884) (545,600,435)
Payment of dividends (3,723,000) -
Net Cash Used in Financing Activities (67,865,221,567) (7,097,985,405)
NET EFFECT OF CHANGES IN EXCHANGE
RATES ON CASH AND CASH EQUIVALENTS 1,013,796,081 (34,436,926,194)
NET RECLASSIFICATION OF CASH AND CASH EQUIVALENTS TO OTHER ASSETS
(RESTRICTED CASH AND TIME DEPOSITS) - (201,779,148,206)
NET INCREASE IN CASH AND
CASH EQUIVALENTS 43,126,955,102 43,458,328,269
CASH AND CASH EQUIVALENTS
AT BEGINNING OF PERIOD 3 43,386,264,747 498,010,383,632
CASH AND CASH EQUIVALENTS
AT END OF PERIOD 3 86,513,219,849 541,468,711,901
Notes 2007 2006
Activities not affecting cash and cash equivalents: Payment of obligations under capital lease
using time deposits 13 718,451,141 -
Payment of bank loans from restricted cash
accounts 12 - 141,657,353,344
Payment of interest using restricted cash
accounts 12 - 48,116,300,811
PT Indocement Tunggal Prakarsa Tbk. (the “Company”) was incorporated in Indonesia on January 16, 1985 based on notarial deed No. 227 of Ridwan Suselo, S.H. Its deed of incorporation was approved by the Ministry of Justice in its decision letter No. C2-2876HT.01.01.Th.85 dated May 17, 1985 and was published in Supplement No. 57 of State Gazette No. 946 dated July 16, 1985. The Company’s articles of association has been amended from time to time, the latest amendment of which was covered by notarial deed No. 57 dated June 28, 2006 of Amrul Partomuan Pohan, S.H., LLM concerning, among others, the change in the members of the Company’s boards of commissioners and directors. Such amendments were registered with the Ministry of Justice and Human Rights on July 24, 2006.
The Company started its commercial operations in 1985.
As stated in Article 3 of the Company’s articles of association, the scope of its activities comprises, among others, the manufacture of cement, building materials, construction and trading. Currently, the Company and Subsidiaries are involved in several businesses consisting of the manufacture and sale of cement (as core business) and ready mix concrete.
The Company’s head office is located at Wisma Indocement 8th Floor, Jl. Jend. Sudirman Kav. 70-71,
Jakarta. Its factories are located in Citeureup - West Java, Cirebon - West Java and Tarjun - South Kalimantan.
The cement business includes the operations of the Company’s twelve (12) plants located in three different sites: nine at the Citeureup - Bogor site, two at the Palimanan - Cirebon site and one at the Tarjun - South Kalimantan site, with a total combined annual production capacity of approximately 15.4 million tons of clinker. The ready mix concrete manufacturing business comprises the operation of the Company’s two subsidiaries.
Based on the minutes of the extraordinary general meeting of the Company’s shareholders (EGMS) held on October 2, 1989, which were covered by notarial deed No. 4 of Amrul Partomuan Pohan, S.H., LLM., the shareholders approved, among others, the offering of 598,881,000 shares to the public. Based on the minutes of the EGMS held on March 18, 1991, which were covered by notarial deed No. 53 of the same notary, the shareholders approved the issuance of convertible bonds with a total nominal value of US$75 million. On June 20, 1991, in accordance with the above-mentioned shareholders’ approval, the Company issued and listed US$75 million worth of 6.75% Euro Convertible Bonds (the “Euro Bonds”) on the Luxembourg Stock Exchange at 100% issue price, with an original maturity in 2001. The Euro Bonds were convertible into common shares starting August 1, 1991 up to May 20, 2001 at the option of the bondholders at the initial conversion price of Rp14,450 per share, with a fixed rate of exchange upon conversion of US$1 to Rp1,946.
In 1994, the Company issued 8,555,640 shares on the partial conversion of the Euro Bonds worth US$35,140,000. Accordingly, the Company transferred and reclassified the corresponding portion of the related bonds payable amounting to Rp8,555,640,000 to capital stock and Rp67,320,100,000 to additional paid-in capital. The remaining balance of the Euro Bonds with total nominal value of US$39,860,000 was fully redeemed and settled in 1994.
1. GENERAL (continued)
In the EGMS held on June 25, 1996, the shareholders resolved to split the par value of the Company’s shares from Rp1,000 per share to Rp500 per share. Accordingly, the number of issued and fully paid capital stock was also increased from 1,207,226,660 shares to 2,414,453,320 shares. This shareholders’ resolution was approved by the Ministry of Justice in its decision letter No. C2-HT.01.04.A.4465 dated July 29, 1996.
In the EGMS held on June 26, 2000, the shareholders approved the increase in the Company’s authorized capital stock from Rp2 trillion divided into 4 billion shares with par value of Rp500 per share to Rp4 trillion divided into 8 billion shares with the same par value. Such increase in the Company’s authorized capital stock was approved by the Ministry of Law and Legislation in its decision letter No. C-13322 HT.01.04.TH.2000 dated July 7, 2000.
On December 29, 2000, the Company issued 69,863,127 shares to Marubeni Corporation as a result of the conversion into equity of the latter’s receivable from the Company (debt-to-equity swap).
In the EGMS held on March 29, 2001, the shareholders approved the rights issue offering with pre-emptive rights to purchase new shares at Rp1,200 per share. The total number of shares allocated for the rights issue was 1,895,752,069 shares with an option to receive Warrant C if the shareholders did not exercise their rights under certain terms and conditions.
As of May 1, 2001 (the last exercise date), the total shares issued for rights exercised were as follows:
• 1,196,874,999 shares to Kimmeridge Enterprise Pte., Ltd. (Kimmeridge), a subsidiary of
HeidelbergCement (formerly Heidelberger Zement AG (HZ)) (HC), on April 26, 2001, through the conversion of US$149,886,295 debt
• 32,073 shares to public shareholders.
The number of shares issued for the exercise of Warrant C totaled 8,180 shares.
As of March 31, 2007 and 2006, the members of the Company’s boards of commissioners and directors are as follows:
2007 2006
Board of Commissioners
President Daniel Hugues Jules Gauthier Daniel Hugues Jules Gauthier
Vice President Sudwikatmono Sudwikatmono
Vice President I Nyoman Tjager I Nyoman Tjager
Commissioner Sri Prakash Parikesit Suprapto
Commissioner Lorenz Naeger Lorenz Naeger
Commissioner Bernhard Scheifele Bernhard Scheifele
Commissioner Ali Emir Adiguzel Ali Emir Adiguzel
Board of Directors
President Daniel Eugene Antoine Lavalle Daniel Eugene Antoine Lavalle
Vice President Tedy Djuhar Tedy Djuhar
Director Hans Oivind Hoidalen Hans Oivind Hoidalen
Director Nelson G. D. Borch Nelson G. D. Borch
Director Christian Kartawijaya Christian Kartawijaya
Director Kuky Permana Kumalaputra Thomas Willi Kern
Director Benny Setiawan Santoso Benny Setiawan Santoso
Director Ernst Gerard Jelito Iwa Kartiwa
Total salaries and other compensation benefits paid to the Company’s boards of commissioners and directors amounted to Rp3.9 billion for the three months ended March 31, 2007 and 2006. As of March 31, 2007 and 2006, the Company and Subsidiaries have a total of 6,594 and 6,618 permanent employees, respectively.
2. SUMMARY OF SIGNIFICANT ACCOUNTING POLICIES
a. Basis of Preparation of the Consolidated Financial Statements
The accompanying consolidated financial statements have been prepared in accordance with generally accepted accounting principles and practices in Indonesia, which are based on Statements of Financial Accounting Standards (PSAK), the Capital Market Supervisory Agency’s (Bapepam) regulations, and Guidelines for Financial Statements Presentation and Disclosures for publicly listed companies issued by the Bapepam for manufacturing and investment companies. The consolidated financial statements have been prepared on the accrual basis using the historical cost concept of accounting, except for inventories which are valued at the lower of cost or net realizable value (market), derivative instruments and short-term investments which are stated at market values, certain investments in shares of stock which are accounted for under the equity method, and certain fixed assets which are stated at revalued amounts.
The consolidated statements of cash flows present receipts and payments of cash and cash equivalents classified into operating, investing and financing activities. The cash flows from operating activities are presented using the direct method.
The reporting currency used in the preparation of the consolidated financial statements is the Indonesian rupiah.
b. Principles of Consolidation
The consolidated financial statements include the accounts of the Company and those of its direct and indirect subsidiaries (collectively referred to as the “Subsidiaries”) as follows:
2. SUMMARY OF SIGNIFICANT ACCOUNTING POLICIES (continued)
b. Principles of Consolidation (continued)
DAP was established in 1998 for the purpose of acting as the Company’s main domestic distributor of certain cement products.
MBG was acquired in 2004 and is a company which has obtained the right to use (“hak pengelolaan”) the Lembar port in Lombok (where the Company built its terminal), for a period of 20 years from PT (PERSERO) Pelabuhan Indonesia III starting January 1, 2001.
As of March 31, 2007, MBG has not yet started its commercial operations.
The Company also has five (5) other subsidiaries, all with effective percentages of ownership of 99.99%. The total cost of investments in these entities amounted to Rp20,000,000. Since these entities have no activities and the total cost of the investments in these subsidiaries is immaterial, their accounts were no longer consolidated into the consolidated financial statements. Instead, the investments in these subsidiaries are presented as part of “Long-term Investments and Advances to Associated Company” in the consolidated balance sheets. The details of these subsidiaries are as follows:
Year of Country of Total Assets as of Incorporation Domicile March 31, 2007
PT Bhakti Sari Perkasa Abadi 1998 Indonesia 5,000,000
PT Lentera Abadi Sejahtera 1998 Indonesia 5,000,000
PT Mandiri Sejahtera Sentra 1998 Indonesia 5,000,000
PT Sari Bhakti Sejati 1998 Indonesia 5,000,000
PT Makmur Abadi Perkasa Mandiri 1998 Indonesia -
All significant intercompany accounts and transactions have been eliminated.
Investments in associated companies wherein the Company or its Subsidiaries have ownership interests of at least 20% but not exceeding 50% are accounted for under the equity method, whereby the costs of such investments are increased or decreased by the Company’s or Subsidiaries’ share in the net earnings (losses) of the investees since the date of acquisition and are reduced by cash dividends received by the Company or Subsidiaries from the investees. The share in net earnings (losses) of the investees is adjusted for the straight-line amortization, over a twenty-year period (in view of the good future business prospects of the investees), of the difference between the costs of such investments and the Company’s or Subsidiaries’ proportionate share in the fair value of the underlying net assets of investees at date of acquisition (goodwill).
A subsidiary’s investment in an associated company which uses the U.S. dollar as its functional and reporting currency is translated into rupiah using the exchange rate prevailing at balance sheet date, while the equity in the net earnings (losses) of the associated company is translated using the average rate during the period. Exchange differences arising from the translation of the investment are recorded by the Company as “Differences Arising from Changes in the Equity of Subsidiaries” account which is presented under the Shareholders’ Equity section of the consolidated balance sheets.
b. Principles of Consolidation (continued)
In compliance with PSAK No. 38 (Revised 2004), “Accounting for Restructuring of Entities under Common Control”, the differences between the cost/proceeds of net assets acquired/disposed of in connection with restructuring transactions among entities under common control and their net book values are recorded and presented as “Differences Arising from Restructuring Transactions Among Entities under Common Control” under the Shareholders’ Equity section of the consolidated balance sheets. This PSAK also provides for the realization of the restructuring differences to current year operation if the conditions stated in the PSAK are fulfilled.
In compliance with PSAK No. 40, “Accounting for Changes in the Value of Equity of a Subsidiary/ Associated Company”, the differences between the carrying amount of the Company’s investment in, and the value of the underlying net assets of, the subsidiary/investee arising from changes in the latter’s equity which are not resulting from transactions between the Company and the concerned subsidiary/investee, are recorded and presented as “Differences Arising from Changes in the Equity of Subsidiaries” under the Shareholders’ Equity section of the consolidated balance sheets. Accordingly, the resulting difference arising from the change in the equity of PT Indomix Perkasa in connection with its application of the provisions of PSAK No. 50, “Accounting for Investments in
Certain Securities”, is recorded and presented under this account (see item d below).
c. Cash Equivalents
Time deposits and other short-term investments with maturities of three months or less at the time of placement or purchase and not pledged as collateral for loans and other borrowings are considered as “Cash Equivalents”.
d. Short-term Investments
Investments in equity securities listed on the stock exchanges are classified as “Short-term Investments”.
Equity securities classified as available-for-sale are stated at market values. Any unrealized gains or losses on appreciation/depreciation in market values of the equity securities are recorded and presented as part of “Unrealized Gains/Losses on Available-for-Sale Securities” under the Shareholders’ Equity section of the consolidated balance sheets. These are credited or charged to operations upon realization.
When a decline in the fair value of an available-for-sale equity securities has been recognized directly to equity and there is objective evidence that the equity securities are impaired, the cumulative losses that had been recognized directly in equity are removed from equity and recognized in profit and loss even though the equity securities have not been derecognized.
e. Allowance for Doubtful Accounts
Allowance for doubtful accounts is provided based on a review of the status of the individual receivable accounts at the end of the year.
f. Transactions with Related Parties
The Company and Subsidiaries have transactions with certain parties which have related party relationships as defined under PSAK No. 7, “Related Party Disclosures”.
2. SUMMARY OF SIGNIFICANT ACCOUNTING POLICIES (continued)
g. Inventories
Inventories are stated at the lower of cost or net realizable value. Cost is determined using the weighted average method, except for spare parts which use the moving average method. Allowance for inventory losses is provided to reduce the carrying value of inventories to their net realizable value.
Net realizable value is the estimated selling price in the ordinary course of business less estimated cost of completion and estimated cost necessary to make the sale.
h. Prepaid Expenses
Prepaid expenses are amortized over the periods benefited using the straight-line method. The non-current portion of prepaid expenses is shown as part of “Other Non-non-current Assets” in the consolidated balance sheets.
i. Fixed Assets
Fixed assets are stated at cost, except for certain assets revalued in accordance with government regulations, less accumulated depreciation, amortization and depletion. Certain machinery and equipment related to the production of cement are depreciated using the unit-of-production method, while all other fixed assets are depreciated using the straight-line method based on their estimated useful lives as follows:
Years
Land improvements; quarry; and buildings and structures 8 - 30
Machinery and equipment 5 - 10
Leasehold improvements; furniture, fixtures and office
equipment; and tools and other equipment 5
Transportation equipment 5
Land is stated at cost and is not depreciated.
Construction in progress is stated at cost. Cost is reduced by the amount of revenue generated from the sale of finished products during the trial production run less the related cost of production. The accumulated cost will be reclassified to the appropriate fixed assets account when the construction is substantially completed and the constructed asset is ready for its intended use.
The costs of maintenance and repairs are charged to operations as incurred; significant renewals and betterments which meet the capitalization criteria under PSAK No. 16, “Fixed Assets”, are capitalized. When assets are retired or otherwise disposed of, their carrying values and the related accumulated depreciation, amortization or depletion are removed from the accounts, and any resulting gains or losses are credited or charged to current operations.
j. Impairment of Assets
k. Leases
Lease transactions are accounted for under the capital lease method when the required capitalization criteria under PSAK No. 30, “Accounting for Leases”, are met. Otherwise, lease transactions are accounted for under the operating lease method. Assets under capital lease (presented as part of “Fixed Assets” in the consolidated balance sheets) are recorded based on the present value of the lease payments at the beginning of the lease term plus residual value (option price) to be paid at the end of the lease period. Depreciation of leased assets is computed based on the methods and estimated useful lives used for similar fixed assets acquired under direct ownership.
Gain on sale-and-leaseback transactions is deferred and amortized using the same basis and methods as mentioned above.
Obligations under capital lease are presented at the present value of the remaining lease payments to be made.
l. Capitalization of Borrowing Costs
In accordance with revised PSAK No. 26, “Borrowing Costs”, interest charges and foreign exchange differences incurred on borrowings and other related costs to finance the construction or installation of major facilities are capitalized. Capitalization of these borrowing costs ceases when the construction or installation is completed and the related asset is ready for its intended use. In 2007 and 2006, no borrowing costs were capitalized.
m. Deferred Charges
In accordance with PSAK No. 47, “Accounting for Land”, costs incurred in connection with the acquisition/renewal of landrights, such as legal fees, land remeasurement fees, notarial fees, taxes and other expenses, are deferred and amortized using the straight-line method over the legal terms of the related landrights.
n. Revenue and Expense Recognition
Revenues are recognized when the products are delivered and the risks and benefits of ownership are transferred to the customers and/or when the services are rendered. Costs and expenses are generally recognized and charged to operations when they are incurred.
o. Provision for Employee Benefits
(i) Retirement Benefits
The Company has a defined contribution retirement plan (Pension Plan) covering all of its qualified permanent employees and an unfunded employee benefit liability determined in accordance with the existing Collective Labor Agreement (CLA). The unfunded employee benefit liability was calculated by comparing the benefit that will be received by an employee at normal pension age from the Pension Plan with the benefit as stipulated in the CLA after deducting the accumulated employee contribution and the related investment results. If the employer-funded portion of the Pension Plan benefit is less than the benefit as required by the CLA, the Company provides for such shortage.
2. SUMMARY OF SIGNIFICANT ACCOUNTING POLICIES (continued)
o. Provision for Employee Benefits (continued)
(i) Retirement Benefits (continued)
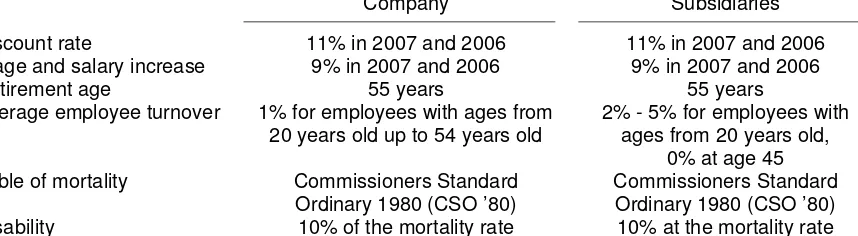
Under PSAK No. 24 (Revised 2004), the cost of providing employee benefits under the CLA/Law is determined using the projected-unit-credit actuarial valuation method. Actuarial gains or losses are recognized as income or expense when the net cumulative unrecognized actuarial gains or losses for each individual plan at the end of the previous reporting year exceed 10% of the present value of the defined benefit obligation at that date. These gains or losses are amortized on a straight-line basis over the expected average remaining working lives of the employees. Further, past service costs arising from the introduction of a defined benefit plan or changes in the benefit payable of an existing plan are required to be amortized over the period until the benefits concerned become vested.
(ii) Post-retirement Healthcare Benefits
In March 2005, the Company issued a policy regarding post-retirement healthcare benefits wherein employees who reach normal retirement age as of January 1, 2003 onwards are entitled to receive healthcare benefits for 5 years from their normal retirement date. The amount of post-retirement healthcare benefits is equivalent to the benefits limited to reimbursement for in-patient hospital bills under the same standard as that which an employee used to have prior to his retirement, for a period not exceeding 60 days per year.
p. Foreign Currency Transactions and Balances
Transactions involving foreign currencies are recorded in rupiah at the middle rates of exchange prevailing at the time the transactions are made. At balance sheet date, monetary assets and liabilities denominated in foreign currencies are adjusted to reflect the rates of exchange quoted at the closing of the last banking day of the year. The resulting gains or losses are credited or charged to current operations, except for those capitalized under PSAK No. 26 (Note 2l).
As of March 31, 2007 and 2006, the rates of exchange used are as follows:
2007 2006
Euro (EUR1) 12,154.30 10,892.73
U.S. dollar (US$1) 9,118.00 9,075.00
Japanese yen (JP¥100) 7,757.70 7,697.86
Transactions in other foreign currencies are insignificant.
q. Derivative Instruments
q. Derivative Instruments (continued)
The accounting for changes in the fair value of a derivative depends on the documented use of the derivative and the resulting designation. The Company has entered into forward and option currency contracts, and also cross currency interest rate swap to hedge market risks arising from fluctuations in exchange rates relating to its foreign currency denominated loans. However, based on the specific requirements for hedge accounting under PSAK No. 55, the said instruments can not be designated as hedge activities for accounting purposes and accordingly, changes in the fair value of such instruments are recorded directly in earnings.
r. Corporate Income Tax
Current tax expense is provided based on the estimated taxable income for the year. Deferred tax assets and liabilities are recognized for temporary differences between the financial and the tax bases of assets and liabilities at each reporting date. Future tax benefits, such as the carry-forward of unused tax losses, are also recognized to the extent that realization of such benefits is probable.
Deferred tax assets and liabilities are measured at the tax rates that are expected to be applied to the period when any of the assets is realized or any of the liabilities is settled, based on tax rates (and tax laws) that have been enacted or substantively enacted at the balance sheet date.
Amendment to a tax obligation is recorded when an assessment is received or, if appealed, when the result of the appeal is determined.
s. Segment Reporting
The Company and Subsidiaries’ businesses are grouped into three major operating businesses: cement, ready mix concrete and other businesses. Financial information on business segments is presented in Note 19.
t. Stock Issuance Costs
Based on decision letter No. KEP-06/PM/2000 dated March 13, 2000 of the Chairman of Bapepam, all costs related to the issuance of equity securities should be offset against additional paid-in capital.
u. Earnings per Share
Basic earnings per share is computed by dividing net income by the weighted average number of shares outstanding during the year, which is 3,681,231,699 shares in 2007 and 2006.
v. Use of Estimates
3. CASH AND CASH EQUIVALENTS
The details of cash and cash equivalents are as follows:
2007 2006
Cash on hand 983,798,197 945,921,397
Cash in banks
ABN-AMRO Bank N.V.
Japanese yen (JP¥200,056,817 in 2007 and
JP¥3,220,853 in 2006) 15,519,807,692 247,936,755
U.S. dollar (US$540,868 in 2007 and
US$38,357 in 2006) 4,931,633,695 348,092,316
Rupiah 1,736,039,555 2,097,130,999
Euro (EUR60,225 in 2007 and
EUR534,089 in 2006) 731,998,430 5,817,687,055
PT Bank Central Asia Tbk.
Rupiah 12,931,474,871 12,641,747,468
Euro (EUR113,074 in 2007 and
EUR697,677 in 2006) 1,374,341,152 7,599,609,258
U.S. dollar (US$65,616 in 2007 and
US$1,044,979 in 2006) 598,287,327 9,483,184,425
PT Bank Mandiri (Persero) Tbk.
Rupiah 9,342,996,513 20,040,954,641
U.S. dollar (US$257,312 in 2007 and
US$344,635 in 2006) 2,346,166,986 3,127,562,716
Euro (EUR43,361 in 2007 and
EUR464,372 in 2006) 527,018,591 5,058,283,391
The Hongkong and Shanghai Banking Corporation Ltd., Jakarta Branch
Rupiah 5,876,928,378 6,685,164,047
Others
Rupiah 3,091,133,632 3,320,783,756
U.S. dollar (US$99,100 in 2007 and
US$53,357 in 2006) 903,594,830 484,212,779
Japanese yen (JP¥109,511) - 8,430,003
Rupiah time deposits
PT Bank Central Asia Tbk. 16,500,000,000 30,500,000,000
ABN-AMRO Bank N.V. - 62,000,000,000
PT Bank Mandiri (Persero) Tbk. - 1,500,000,000
U.S. dollar time deposits
ABN-AMRO Bank N.V. (US$1,000,000 in 2007
and US$40,723,087 in 2006) 9,118,000,000 369,562,010,895
Total 86,513,219,849 541,468,711,901
Interest rates per annum:
2007 2006
Rupiah time deposits 7.50% - 8.85% 12.00% - 13.00%
U.S. dollar time deposits 5.00% - 5.15% 4.15% - 4.35%
4. TRADE RECEIVABLES
The details of trade receivables are as follows:
2007 2006
Related Party (Note 23)
Cement business
HCT Services Asia Pte., Ltd., Singapore (US$6,686,981 in 2007 and
US$5,114,813 in 2006) 60,971,894,946 46,416,931,151
Third Parties
Cement and ready mix concrete business 569,049,259,953 475,416,986,037
Allowance for doubtful accounts (11,210,612,391) (13,944,435,448)
Net 557,838,647,562 461,472,550,589
The movements of allowance for doubtful accounts are as follows:
2007 2006
Balance at beginning of period 11,067,732,391 13,835,340,496
Provision during the period 142,880,000 120,000,000
Receivables written off during the period - (10,905,048)
Balance at end of period 11,210,612,391 13,944,435,448
Based on the review of the status of the individual receivable accounts at the end of the year, management believes that the above allowance for doubtful accounts is sufficient to cover any possible losses that may arise from uncollectible accounts.
Trade receivables were used as collateral for the long-term loans from banks and financial institutions (Note 12).
4. TRADE RECEIVABLES (continued)
The details of other receivables are as follows:
2007 2006
Payments for tax assessments being contested 5,502,658,681 5,502,658,681
Others 8,370,213,031 5,875,927,819
Total 13,872,871,712 11,378,586,500
Allowance for doubtful accounts (7,371,980,358) (7,371,980,358)
Net 6,500,891,354 4,006,606,142
The movements of allowance for doubtful accounts are as follows:
2007 2006
Balance at beginning of period 7,371,980,358 7,371,980,358
Provision during the period - -
Receivables written off during the period - -
Reversal of allowance on doubtful accounts
collected during the period - -
Balance at end of period 7,371,980,358 7,371,980,358
Based on the review of the status of the individual receivable accounts at the end of the year, management believes that the above allowance for doubtful accounts is sufficient to cover any possible losses that may arise from uncollectible accounts.
6. INVENTORIES
Inventories consist of:
2007 2006
Finished goods 58,981,752,995 102,725,871,985
Work in process 89,990,614,204 136,335,071,509
Raw materials 227,074,022,782 40,713,413,863
Fuel and lubricants 121,605,766,820 129,900,510,027
Spare parts 472,080,344,557 570,146,341,539
Total 969,732,501,358 979,821,208,923
Allowance for losses (48,518,315,353) (36,540,963,445)
Net 921,214,186,005 943,280,245,478
With the exception of inventories owned by Indomix Perkasa and PBI amounting to Rp10.45 billion, all of the inventories are insured against fire and other risks under a combined insurance policy package (Note 8).
The inventories were used as collateral for the long-term loans from banks and financial institutions (Note 12).
The movements of allowance for inventory losses are as follows:
2007 2006
Balance at beginning of period 50,661,601,995 38,184,113,445
Reversals during the period - (1,643,150,000)
Inventories written off during the period (2,143,286,642) -
Balance at end of period 48,518,315,353 36,540,963,445
6. INVENTORIES (continued)
Management believes that the above allowance for inventory losses is sufficient to reduce the carrying amounts of inventories to their net realizable values.
The Company made advance payments to several foreign suppliers for the purchase of certain inventories. The outstanding balances of the purchase advances as of March 31, 2007 and 2006 amounting to Rp49,495,983,311 and Rp45,950,431,003, respectively, are presented as part of “Advances and Deposits” in the consolidated balance sheets.
7. LONG-TERM INVESTMENTS AND ADVANCES TO ASSOCIATED COMPANY
The details of this account are as follows:
The principal activities of the above investees are as follows:
Investee Country of Domicile Principal Business Activity
Stillwater Shipping Corporation Liberia Shipping
PT Cibinong Center Industrial Estate Indonesia Development of industrial estates
PT Pama Indo Mining Indonesia Mining
PT Indo Clean Set Cement Indonesia Production of clean set cement
The details of the equity in net earnings of associated companies, net of goodwill amortization, for the three months ended March 31, 2007 and 2006 are as follows:
2007 2006
PT Pama Indo Mining 982,338,410 (128,779,561)
PT Cibinong Center Industrial Estate 921,376,333 327,735,320
Stillwater Shipping Corporation 120,889,062 919,478,085
Total 2,024,603,805 1,118,433,844
The Company received cash dividends from PT Pama Indo Mining amounting to Rp2,099,307,170 in October 2006.
Based on the minutes of the shareholders’ extraordinary meeting held on December 30, 2002, which were covered by notarial deed No. 2 dated January 7, 2003 of Notary Deni Thanur, S.E., S.H., M.Kn, the shareholders approved to liquidate PT Indo Clean Set Cement (ICSC). As of March 31, 2007, the liquidation process of ICSC is still ongoing. The additional equity in net losses of ICSC after 2002 has not been recognized in the consolidated financial statements since ICSC has ceased operations and the effects of the additional equity are immaterial to the consolidated financial statements.
8. FIXED ASSETS (continued)
Construction in progress 298,412,768,646 68,814,328,546 30,118,816,606 337,108,280,586
_________________________
Transportation equipment 327,384,712,111 10,157,499,237 1,470,308,830 336,071,902,518
Furniture, fixtures and office equipment 185,179,642,028 5,236,682,618 1,112,237,497 189,304,087,149
Balance as of Additions/ Disposals/ Balance as of
Machineries under installation 316,154,234,808 128,107,140,162
Buildings and structures under construction 4,214,455,529 2,365,837,072
Others 16,739,590,249 12,408,906,848
Total 337,108,280,586 142,881,884,082
Below are the percentages of completion and estimated completion periods of the construction in progress as of March 31, 2007:
Estimated Percentage Estimated Completion
8. FIXED ASSETS (continued)
Fixed assets were used as collateral to secure the long-term loans from banks and financial institutions (Note 12).
Depreciation, amortization and depletion charges amounted to Rp132,347,429,696 and Rp119,578,239,107 for the three months ended March 31, 2007 and 2006, respectively..
The Company and Subsidiaries insured their fixed assets and inventories against losses from fire and other insurable risks under several combined policies, with a total insurance coverage of Rp120,416,605,950 and US$1,912,952,240 as of March 31, 2007. In management’s opinion, the above insurance coverage is adequate to cover any possible losses that may arise from such risks.
Based on the review of asset values at the end of the year, management believes that there is no potential impairment in the values of the assets included in the consolidated financial statements.
The Company and Subsidiaries own building/construction rights or “Hak Guna Bangunan” (HGB), land use rights or “Hak Pakai” (HP) and land ownership rights or “Hak Milik” (HM) over land covering approximately 3,221.75 hectares, and local mining rights or “Surat Izin Penambangan Daerah” (SIPD) covering approximately 10,592.36 hectares at several locations in Indonesia, with legal terms ranging from 5 to 30 years. Management believes that such titles of land rights ownerships can be extended upon their expiration.
As of March 31, 2007, the Company is still in the process of obtaining the titles of ownership or rights over land covering a total area of approximately 33,170 square meters. The Company is also in the process of acquiring land rights covering a total area of approximately 2,681,196 square meters. The total expenditures amounting to Rp23,369,144,459 as of March 31, 2007 incurred in relation to the above land rights acquisition process are recorded as part of “Other Non-current Assets” in the consolidated balance sheets.
The Company made advance payments for the purchase of certain machinery, equipment and spare parts from several suppliers. The outstanding balances of the purchase advances as of March 31, 2007 and 2006 amounting to Rp13,287,013,779 and Rp14,274,386,044, respectively, are presented as part of “Other Non-current Assets” in the consolidated balance sheets.
9. SHORT-TERM LOAN
This account consists of the following:
2007 2006
Third Parties - Cement and ready mix concrete business
Rupiah 73,217,252,321 72,375,999,864
U.S. dollar (US$1,468,537 in 2007 and
US$1,500,492 in 2006) 13,390,116,429 13,616,965,729
Other foreign currencies 15,480,636,893 5,934,497,739
Total - Third Parties 102,088,005,643 91,927,463,332
Related Party - Cement business (Note 23) - 2,252,157,512
Total Trade Payables 102,088,005,643 94,179,620,844
10. TRADE PAYABLES (continued)
The above trade payables arose mostly from purchases of raw materials and other inventories from the Company’s main suppliers as follows:
Suppliers Materials Supplied
Pertambangan Minyak dan Gas Bumi Negara (PERTAMINA) Fuel
PT Adaro Indonesia Coal
PT Masa Jaya Perkasa Coal
PT Trubaindo Coal Mining Coal
Eurocan Pulp & Paper Co. Kraft paper
Fujian Qingshan Paper Industry Co., Ltd. Kraft paper
Billerud AB Kraft paper
Itochu Co. Gypsum
PT Politama Pakindo Woven paper
United Tractors Spare parts
Value added tax 23,550,900,612 45,897,338,850
Total 47,940,778,829 53,642,881,039
b. The reconciliation between income before corporate income tax expense, as shown in the consolidated statements of income, and estimated taxable income of the Company for the three months ended March 31, 2007 and 2006 is as follows:
2007 2006
Income before corporate income tax expense per
consolidated statements of income 164,168,375,145 241,713,281,937
Income of Subsidiaries before corporate income
tax expense - net (4,474,754,784) (6,061,127,396)
Reversal of inter-company eliminating entries
during consolidation (120,889,062) (919,478,085)
Income before corporate income tax expense
attributable to the Company 159,572,731,299 234,732,676,456
2007 2006
Add (deduct):
Temporary differences
Provision for employee benefits - net 3,097,779,299 1,141,934,896
Provision for post-retirement healthcare
benefits - net 651,811,898 814,508,813
Depreciation of fixed assets (including
leased assets) (18,517,491,661) (38,388,531,777)
Provisions for doubtful accounts and
inventory losses (write-off of accounts
and inventories against allowance) - net (2,143,286,642) (1,643,150,000)
Payments of obligations under capital lease (718,451,141) -
Provision for recultivation - net (Note 24q) (211,096,250) (481,833,126)
(17,840,734,497) (38,557,071,194)
Permanent differences Non-deductible expenses
Employees’ benefits 9,600,930,131 14,674,792,942
Donations 1,187,115,509 747,338,982
Public relations 593,795,900 327,471,158
Others 178,830,656 371,989,409
Equity in net earnings of associated
companies - net (1,903,714,743) (198,955,759)
Income already subjected to final tax (746,786,869) (5,534,375,872)
8,910,170,584 10,388,260,860
Estimated taxable income of the Company 150,642,167,386 206,563,866,122
Estimated tax loss carryforward at beginning of
year - (256,930,304,261)
Corrections by the Tax Office - 6,359,790,385
Estimated taxable income (tax loss
carryforward at end of period) 150,642,167,386 (44,006,647,754)
11. TAXATION (continued)
c. The details of corporate income tax expense (benefit) are as follows:
2007 2006
Current
Company 45,175,150,100 -
Subsidiaries 2,046,031,300 2,099,158,500
47,221,181,400 2,099,158,500
Deferred
Company 5,352,220,349 75,444,218,311
Subsidiaries (902,968,359) (314,214,723)
4,449,251,990 75,130,003,588
Total 51,670,433,390 77,229,162,088
d. The calculation of estimated claims for income tax refund is as follows:
2007 2006
Current income tax expense
Company 45,175,150,100 -
Subsidiaries 2,046,031,300 2,099,158,500
Total 47,221,181,400 2,099,158,500
Prepayments of income tax
Company 47,016,170,929 2,715,792,010
Subsidiaries 3,527,123,180 2,543,015,175
Total 50,543,294,109 5,258,807,185
Estimated claims for income tax refund - presented as part of “Prepaid Taxes” in the consolidated balance sheets
Company 1,841,020,829 2,715,792,010
Subsidiaries 1,549,685,917 991,958,362
Total for the current year 3,390,706,746 3,707,750,372
Claims for income tax refund from prior years: Company
2005 10,414,347,316 10,368,661,923
2004 - 8,328,973,769
Subsidiaries 3,388,423,817 18,149,552,017
Total 17,193,477,879 40,554,938,081
In March 2007, the Company received a decision letter from the Tax Office wherein the Tax Office approved to refund the claim for 2005 income tax and increased the 2005 taxable income by Rp16,328,657,367. Out of the said total amount of assessment, Rp5,292,461,212 will be contested by the Company. In addition, the Company also received withholding tax Article 26 and value added tax assessments for 2005, whereby, according to the Tax Office, the Company has to pay additional taxes and penalties totalling Rp8,916,678,829. The Company will contest the result of the tax assessments.
In March 2006, the Company received a decision letter from the Tax Office wherein the Tax Office approved to refund the claim for 2004 income tax and increased the 2004 taxable income to Rp57,969,361,654. The difference of Rp6,359,790,385 between the amount of taxable income approved by the Tax Office and the amount reported was recognized as an adjustment to the Company’s tax loss carryforward in 2006.
In December 2006, DAP received a decision letter from the Tax Office wherein the Tax Office approved to refund DAP’s 2005 claim for tax refund amounting to Rp5,849,231,775.
In April 2006, DAP received a decision letter from the Tax Office wherein the Tax Office approved to refund DAP’s 2003 claim for tax refund amounting to Rp3,824,659,200, out of the total claim of Rp3,830,534,868.
In March 2006, DAP received a decision letter from the Tax Office wherein the Tax Office approved to refund DAP’s 2004 claim for tax refund amounting to Rp2,946,642,366, out of the total claim of Rp2,991,878,166.
In February 2004, DAP received a decision letter from the Tax Office wherein the Tax Office approved to refund DAP’s 2002 claim for tax refund amounting to Rp6,195,133,712, out of the total claim of Rp11,605,908,212. DAP has contested the result of the tax assessment and the disapproved portion of the claim has remained as part of “Prepaid Taxes” in the 2005 consolidated balance sheet. Furthermore, on August 16, 2006, the Tax Court issued a decision in favor of DAP and the refund was received by DAP in October 2006. The Tax Office, however, asked for a judicial review by the Supreme Court. As of March 31, 2007, the Supreme Court has not rendered any decision on the matter.
e. The reconciliation between income before corporate income tax expense (after the reversal of inter-company eliminating entries during consolidation) multiplied by the applicable tax rate and corporate income tax expense as shown in the consolidated statements of income for the three months ended March 31, 2007 and 2006 is as follows:
2007 2006
Income before corporate income tax expense 164,168,375,145 241,713,281,937
Reversal of inter-company eliminating entries
during consolidation (120,889,062) (919,478,085)
Combined income, net of loss, before income tax
of the Company and Subsidiaries 164,047,486,083 240,793,803,852
11. TAXATION (continued)
2007 2006
Tax expense at the applicable tax rate 49,161,745,722 72,185,640,775
Tax effects on permanent differences:
Non-deductible expenses 3,525,015,581 5,123,796,999
Equity in net earnings of associated
companies - net (571,114,423) (59,686,728)
Income already subjected to final tax (445,213,490) (1,928,526,074)
Tax corrections - 1,907,937,116
Corporate income tax expense per consolidated
statements of income 51,670,433,390 77,229,162,088
f. Deferred tax assets (liabilities) consist of:
Deferred Tax
Estimated liability for employee benefits 14,398,065,929 929,333,790 15,327,399,719
Allowance for doubtful accounts and
inventory losses 13,156,064,068 (642,985,993 ) 12,513,078,075
Reserve for recultivation 5,353,174,181 (63,328,875 ) 5,289,845,306
Estimated liability for post-
retirement healthcare benefits 2,267,282,321 195,543,570 2,462,825,891
Obligation under capital lease 2,635,889,954 (215,535,342 ) 2,420,354,612
Others 833,851,800 - 833,851,800
Sub-total 38,644,328,253 203,027,150 38,847,355,403
Subsidiaries 7,642,479,221 914,624,892 8,557,104,113
Total 46,286,807,474 1,117,652,042 47,404,459,516
Deferred Tax Liabilities: Company
Difference in net book value of fixed assets between tax and
accounting bases (639,347,120,920) (5,836,709,968) (645,183,830,888)
Net book value of assets under
capital lease (5,565,844,588) 281,462,469 (5,284,382,119)
Sub-total (644,912,965,508) (5,555,247,499) (650,468,213,007)
Subsidiaries (1,747,728,636) (11,656,533) (1,759,385,169)
Total (646,660,694,144) (5,566,904,032) (652,227,598,176)
Net Deferred Tax Assets:
Subsidiaries 5,894,750,585 902,968,359 6,797,718,944
Net Deferred Tax Liabilities:
Company (606,268,637,255) (5,352,220,349) (611,620,857,604)
Deferred Tax
Estimated liability for employee benefits 13,156,508,384 342,580,469 13,499,088,853
Tax loss carryforward 77,079,091,278 (63,877,096,953 ) 13,201,994,325
Allowance for doubtful accounts and
inventory losses 9,412,817,503 (492,945,000 ) 8,919,872,503
Reserve for recultivation 3,814,876,992 (144,549,938 ) 3,670,327,054
Estimated liability for post-retirement
healthcare benefits 1,322,794,200 244,352,644 1,567,146,844
Others 833,851,800 - 833,851,800
Sub-total 105,619,940,157 (63,927,658,778 ) 41,692,281,379
Subsidiaries 6,566,388,568 235,660,435 6,802,049,003
Total 112,186,328,725 (63,691,998,343) 48,494,330,382
Deferred Tax Liabilities: Company
Difference in net book value of fixed assets between tax base and
accounting base (600,757,677,552) (11,516,559,533) (612,274,237,085)
Subsidiaries (1,162,146,908) 78,554,289 (1,083,592,619)
Total (601,919,824,460) (11,438,005,244) (613,357,829,704)
Management believes that the above deferred tax assets can be fully recovered in future periods.
12. LONG-TERM LOANS FROM BANKS AND FINANCIAL INSTITUTIONS
This account consists of loans from:
2007 2006
Third parties
Rupiah 313,157,894,736 52,895,195,220
U.S. dollar 285,537,368,479 895,915,981,205
Japanese yen 219,077,448,000 1,135,540,216,205
Sub-total 817,772,711,215 2,084,351,392,630
12. LONG-TERM LOANS FROM BANKS AND FINANCIAL INSTITUTIONS (continued)
Less current maturities 256,304,049,660 363,000,000,000
Long-term maturities 1,929,168,661,555 3,082,601,392,630
The balances of the above loans in their original currencies are as follows:
2007 2006
Rupiah
Third parties
PT Bank Central Asia Tbk. 313,157,894,736 37,968,922,322
PT Bank Mandiri (Persero) Tbk. - 14,926,272,898
Total rupiah loans 313,157,894,736 52,895,195,220
Bayerische Hypo und Vereinsbank AG, Singapore - 14,495,663
Other creditors (each below US$10 million) - 57,044,736
Japan Bank for International Cooperation, Tokyo - 2,495,181,503
Total Japanese yen loans JP¥ 2,824,000,000 JP¥ 14,751,375,268
The ranges of interest rates per annum for the above indebtedness are as follows:
2007 2006
Japanese yen 1.38% - 1.55% 2.30% - 3.80%
U.S. dollar 6.26% - 6.56% 5.25% - 6.60%
Prior to their refinancing in April 2006 as described below, the Company’s debts represented restructured debts under a Post HZ Entry Master Facility Agreement (HZMFA) dated December 29, 2000. The HZMFA provided for, among others, the mechanism, amounts and schedules of loan installment repayments, collateral, interest rates, restrictions on granting of guarantees or loans, issuance of warrants to the lenders, restrictions on issuance of new shares or other securities, restrictions on declarations and payments of cash dividends without prior written consent from the creditors, restrictions on capital expenditures, appointment of monitoring accountants, determination and transfer of surplus cash, and restrictions on derivative transactions.
The HZMFA, which had been amended from time to time, also required the Company to:
• Establish and maintain escrow accounts in JPMorgan Chase Bank, N.A. Usages or withdrawals of
funds from these escrow accounts should be subjected to strict monitoring and review by the monitoring accountants.
• Maintain an aggregate balance for all other current bank accounts (other than the current bank
accounts agreed by the lenders) in an amount not exceeding the working capital buffers as defined in the HZMFA.
In compliance with the above requirements, the Company opened and maintained eleven (11) escrow accounts with JPMorgan Chase Bank, N.A. As of March 31, 2006, the balances of deposits maintained in such escrow accounts totaled Rp293,747,199,919 (consisting of Rp1,445,910, US$25,394,676 and JP¥822,164,491) and are presented as part of “Restricted Cash and Time Deposits” in the consolidated balance sheets. In May 2006, following the full repayment of the outstanding balance of the HZMFA loan and the termination of the HZMFA, the Company closed all the escrow accounts and the remaining cash balances in those accounts totaling Rp339,511,121 were transferred to “Cash and Cash Equivalents”.
Furthermore, as stated in the HZMFA, the loan repayment installments would be as follows:
(i) Fixed quarterly installment payments totaling US$10,500,000 in 2002; US$33,500,000 in 2003; US$58,750,000 in 2004; US$78,500,000 in 2005; US$84,500,000 in 2006; US$87,250,000 in 2007; and US$22,000,000 in 2008 (final).
(ii) Quarterly payments equal to the amount of excess cash available in the above-mentioned escrow accounts after the payments or applications required under the HZMFA.
As specified in the HZMFA, the restructured loans were secured/collateralized by the following:
• All of the above-mentioned escrow accounts maintained in JPMorgan Chase Bank, N.A., including
all time deposit and demand deposit placements made from the funds in the escrow accounts
• All receivables of the Company
• All land, buildings, site improvements and other fixtures owned by the Company, except for:
- Cement plants 6, 7 and 8, including their supporting facilities and land
- Land where cement plants 1 and 2 are located
- Quarry and the expansion of the Citeureup cement plants, including the land located within
12. LONG-TERM LOANS FROM BANKS AND FINANCIAL INSTITUTIONS (continued)
• Fiduciary transfers of all proprietary rights over the inventories, and plant and equipment owned by
the Company, including the related insurance coverage and/or proceeds from insurance recoveries.
• Shares of capital stock of Indomix and DAP.
On March 8, 2005, HeidelbergCement Finance B.V., a related party, purchased a portion of the restructured debt under the HZMFA.
The HC Finance B.V. loan has a term of four (4) years and will be fully repaid at the end of the fourth year (2009). This loan bears interest at the rate of 1.8% above the 3 Months’ LIBOR with the same interest payment schedule as that of the other HZMFA creditors. Starting July 1, 2006, the interest rate was reduced from 3 Months’ LIBOR + 1.80% per annum to 3 Months’ LIBOR + 1.15% per annum.
To reduce the exposure to exchange rate fluctuations relating to the above-mentioned refinancing transaction with HC Finance B.V., the Company entered into a Cross Currency Interest Rate Swap (CCIRS) transaction with a notional amount of US$150 million with Standard Chartered Bank, Jakarta Branch. The CCIRS contract has the same period as the HC Finance B.V. loan (Note 25).
Total principal payments made from the escrow accounts amounted to Rp99,273,996,569 for the three months ended March 31, 2006.
Total interest payments made by the Company through its escrow accounts amounted to Rp48,116,300,811 (consisting of US$3,807,646, JP¥109,349,575 and Rp1,564,997,242) for the three months ended March 31, 2006. The unpaid interest charges amounting to Rp59,809,429,468 as of March 31, 2006, are presented as part of “Accrued Expenses” in the 2006 consolidated balance sheet.
For the three months ended March 31, 2006, total prepayments of the principal loan installments amounted to US$4,334,814 (equivalent to Rp42,383,356,775).
On March 29, 2006, the Company obtained the approval of independent shareholders to obtain a corporate guarantee from HeidelbergCement AG (HC), a related party (which is considered a conflict of interest), in connection with the Company’s plan to refinance its debt under the HZMFA. The corporate guarantee is issued to:
• Standard Chartered Bank as Coordinating Lead Arranger of the syndicated loan with a total amount
equivalent to US$158 million (consisting of US$60 million, Rp350 billion and JP¥7,068 million)
• Marubeni Corporation for the bilateral loan of JP¥1,178 million.
(i) Term loan facility of US$35 million and revolving credit facility of US$25 million, with annual interest rate at US$ LIBOR plus 0.9%
(ii) Term loan facility of Rp350 billion, with annual interest rate at SBI plus 1%
(iii) Term loan facility of JP¥7,068 million, with annual interest rate at JP¥ LIBOR plus 0.9%.
The Facility will expire in five years from the date of the first drawdown. The term loans will be repaid in 19 equal quarterly installments with the first installment commencing six months from the first drawdown date, while for the revolving credit facility, each drawdown shall be repaid on the last day of its interest period, and may be re-borrowed during the credit facility period.
The above Facility agreement (the “agreement”) covers certain matters, among others,
(i) cross default between the Company and the Guarantor should the Company or the Guarantor not be able to pay any of its financial indebtedness with an outstanding amount in excess of US$25,000,000 on the due date
(ii) negative pledge whereby the Company shall not, among others:
a. pledge, sell, transfer, dispose of any of its assets on terms whereby they are or may be leased to or re-acquired by the Company
b. sell, transfer, or otherwise dispose of any of its receivables or recourse them c. items (a) and (b) do not apply for transactions in the ordinary course of business.
The agreement also states that HC, as a Guarantor, should maintain:
(i) The Group’s Net Debt/Earning Before Interest, Tax, Depreciation and Amortization (EBITDA) ratio at levels not higher than:
a. 3.25:1 for the period ending June 30, 2006, 2007, 2008, 2009, 2010 b. 3.00:1 for the period ending December 31, 2006, 2007, 2008, 2009, 2010
(ii) Consolidated Net Worth of the Guarantor Group at a level not lower than EUR3,500,000,000 at any time.
On April 11, 2006, the Company (as the Borrower) signed a bilateral loan facility agreement with Marubeni Corporation (as Lender) to partially refinance the Marubeni Contractor Facility in the amount of JP¥1,178 million that was set to mature on December 29, 2012 and the JBIC P11 Guarantee Facility in the amount of JP¥2.4 billion, which was guaranteed by Marubeni Corporation. The loan from Marubeni Contactor Facility was fully paid in October 2006 and the JBIC P11 Guarantee Facility was fully paid in December 2006.
The bilateral loan bears annual interest at Long-Term Prime Rate (LTPR) plus 0.9%. The guarantee fees paid to Marubeni Corporation arising from the previous loans were reduced from 1% to 0.7% per annum in 2006.
The Facility and the Marubeni Contractor Facility mentioned above are secured by the Corporate Guarantee of HC. The Company pays a guarantee fee of 0.2% per annum of the available loan facility balance as compensation to HC.
On April 20, 2006, the Company terminated the existing HZMFA and repaid the outstanding principal
balance of Rp1,801,595,022,984 (consisting of US$98,723,524, JP¥11,078,193,765 and