Monetary Policy Review
February 2010
The Monetary Policy Review (MPR) is published monthly by Bank Indonesia after the Board of Governors’ Meeting each February, March, May, June, August, September, November, and December. This report is intended as a medium for the Board of Governors of Bank Indonesia to present to the public the latest evaluation of monetary conditions, assessment and forecast for the Indonesian economy, in addition to the Bank Indonesia monetary policy response published quarterly in the Monetary Policy Report in January, April, July, and October. Specifically, the MPR presents an evaluation of the latest developments in inflation, the exchange rate, and monetary conditions during the reporting month and decisions concerning the monetary policy response adopted by Bank Indonesia.
Board of Governors
Darmin Nasution Deputi Gubernur Senior
Hartadi A. Sarwono Deputi Gubernur
Siti Ch. Fadjrijah Deputi Gubernur
S. Budi Rochadi Deputi Gubernur
Muliaman D. Hadad Deputi Gubernur
Ardhayadi Mitroatmodjo Deputi Gubernur
Table of Contents
I. Monetary Policy Statement ...3
II. The Economy and Monetary Policy ...5
Developments in the World Economy ...6
Economy Growth in Indonesia ...7
Inflation ...10
Rupiah Exchange Rate ...11
Monetary Policy ...13
Interest Rates ...13
Deposits, Credits, and Money Supply ...15
Stock Market ...16
SUN Market ...16
Mutual Funds Market ...17
Banking Conditions ...18
I. MONETARY POLICY STATEMENT
Global economy continues to recover. Global economic recovery was mainly buoyed by expansion in emerging countries, like China. In addition, it is also backed by stronger domestic demand in developed countries, like the U.S. and Japan, although with a more moderate pace. Meanwhile, a recovery in Euro area run somewhat slower due to continued weakening consumption as a result of high unemployment level and worsening fiscal deficits in some countries. Based on those developments, the global economic growth for 2010 is revised up.
In the global financial markets, global economic recovery continues to support the performance of the global financial markets. Stock index was on an upward trend, although it was interrupted by negative sentiment came from signal of monetary policy tightening in China. Optimism in the global financial markets was also sustained by the improved risk perception in emerging markets. This has led to large capital inflows to emerging markets, which supports favorable financial markets condition and currency appreciation in some countries. Global inflation is estimated to remain relatively low, making the monetary authorities in most developed countries continue their accommodative monetary policy. With that, capital inflows to emerging countries, including Indonesia, is expected to persist.
In terms of prices, inflation slightly picked up in January, 2010, but will remain within the target range of 5 ± 1% in 2010. Inflation in January 2010 was 0.84% (mtm), or 3.72 (yoy), higher than the previous month of 0.33% (mtm) or 2.78 (yoy). Inflation came mainly from volatile foods due to lower production of rice. This rice price hike was triggered by the decline related to seasonal factor and was also pushed by the increase in Government Purchasing Price of rice (HPP) by 10% as well as expectations on the rising Highest Retail Price (HET) of subsidized fertilizer in April 2010. Meanwhile, the pressure from fundamental factors, which are reflected in core inflation, was relatively stable. From the domestic side, supply was still sufficient to respond to increasing demand, which managed to keep price in check. Meanwhile, from external side, imported inflation in certain commodities surged, especially sugar. This was in line with rising international sugar prices. However, continued rupiah appreciation trend was able to tame inflation pressure from external factors.
Improved export performance coupled with capital flows continues to keep Indonesia’s balance of payments in surplus. Favorable global economic condition, particularly in Indonesia’s trading partner countries, supports the improvement of exports performance. The increase in exports is expected to offset higher imports came from higher economic activity. In addition, rising international commodity prices will support growing optimism in the exports performance during the first quarter of 2010. That condition supports current account surplus. Performance in the Balance of Payment was also supported by surplus in the capital and financial account corresponding with strong capital flows. The main factor behind this surplus were stability in Indonesia’s economy, attractive yield in rupiah denominated assets, as well as Fitch rating upgrade further improved the attractiveness of rupiah assets. Issuance of government’s medium term notes in the global market amounted USD 2 billion had contributed to the capital and financial account surplus. With these developments, foreign exchange reserves at the end of January 2010 arrived at 69.6 billion U.S. dollars, sufficient to finance 5.9 months of imports and government foreign debt. Solid performance of Indonesia’s balance of payments stimulated the strengthening of the rupiah. The rupiah on average gained 1.90% to Rp9.275 per U.S. dollar. At the end of the period rupiah arrived at Rp9.350 or gained 0.8% (ptp) from the year-end.
improved global sentiment. In currency markets, increased banks liquidity is reflected in the declining risk in interbank money market as well as interest rate of O/N interbank money market which is maintained at around the BI Rate. In the stock market, JCI gained 3.02% (mtm). Better stock performance was corresponded with improving liquidity in the stock market. Stock rally was interrupted by negative sentiment characterized by global dynamics such as tightening in China, expectations of the banking activity restrictions, exit policy in the U.S, as well as fiscal sustainability in Greece. In the bond market, improving foreign debt rating of Indonesia to BB+ from BB has encouraged reduction in SUN yield nearly across all maturity spectrum. SUN yield dropped by 11 bps (mtm) on average.
Transmission of monetary policy in the financial sector also continued. This was reflected in declining deposit rates and lending rates amid unchanged BI rate since September 2009. Credit at the end of 2009 rose compared to the previous month. On a monthly basis, the increase of credit (including channeling) in December 2009 reached Rp39, 9 trillion, or posted 2.8% growth. Going forward, the transmission of monetary policy is expected to improve further in line with better perception on the economy and the commitment of banks to cut interest rates.
From the banking sector, national banking conditions remained stable. Banking stability is reflected in the maintained capital adequacy ratio (CAR) as of December of 17.4%. Meanwhile, the ratio of gross non-performing loans (NPLs) remain under control at 3.8%, with a net ratio of 0.9%. Banks liquidity, including liquidity in the interbank money market, and deposits growth continued to improve.
On 4 February 2009, the Board of Governors’ Meeting at Bank Indonesia decided to keep the BI Rate unchanged at 6.5%. This decision was taken on the basis that the BI Rate at this level remains consistent with achievement of the 2010 inflation target, set at 5%±1%, and is supportive of measures to strengthen the economic recovery process, safeguard the financial stability and promote banking intermediation.
II. THE ECONOMY AND MONETARY POLICY
although for the whole year is predicted to stay in the target range. Meanwhile, monetary policy relaxation in 2009 to had encouraged higher asset prices, including JCI. On the banking sector, national banking conditions remain stable.
Developments in World Economy
The global economic recovery continued supported by strong growth in developing countries, especially Asia. Meanwhile, the economic recovery process in developed countries also continued, though at more moderate pace. Slowed recovery in developed countries was still overshadowed by high unemployment and limited banking credit. However, the fiscal stimulus in the U.S. and Japan had been able to push domestic demand, reflected by higher household consumption. Stronger household consumption can be seen through better indicator of retail sales and household spending. Meanwhile, the recovery in the Euro area also slowed as household consumption weakened caused by rising unemployment and worsening fiscal deficits in some countries such as Greece and Ireland.
U.S. economy posted better growth amid unstable improvement in labor market. U.S growth was backed by higher consumption as reflected in the indicators of retail sales, household expenditure (Graph 2.1), and consumer confidence. The increasing household consumption was driven by year-end holiday period and the stimulus rebate for the car purchase (cash for clunkers). On the other hand, the U.S. unemployment rate remained at a high level of 10.0% in December 2009. The figure had came down from its highest level of 10.2% in October last year.
Production sector in the U.S. had responded to higher demand. Year-end holiday season and fiscal stimulus had encouraged higher domestic consumption and lead to rising production in the U.S. manufacturing sector. Improvement in U.S. production was seen in rising production index and production capacity after falling in QII-2009 (Graph 2.2). In line with those indicators, Purchasing Manager Index (PMI) went up in December.
Excess liquidity and policies by the Fed and other major central banks to keep interest rates at low levels had encouraged persistent capital inflow to emerging markets. However, the global financial market performance was interrupted by the pressure came from signal of monetary tightening in China and the U.S. Federal Reserve’s plan to restrict the speculative
Graph 2.1 US Household Real Income Spending
Graph 2.2 US Industrial Production and Capacity Utilization
����������������� ������������
������������
�������� ������
�������� �����������
�� �� �� � � � �
��� ��� ��� ��� ��� ��� ��� ��� ��� ��� ��� ���
���� ���� ����
��� ���
��� ���
�����������������
������ �
���� ����
����
�� �� �� ��
��
���� ����
�������������������� ����������������������������
���
���
����
�����
�����
banking activity. Substantial capital flow into emerging markets and the maintained risk perception have led to the strengthening of exchange rates and stock markets in Asia.
Global inflationary pressures began to picked up corresponded to rising commodity prices and world economic activity. Global inflation forecasts for 2010, in January 2010, rose slightly to 3.05% (yoy). Policy rates in developed countries remained at low levels. In January 2010, most major central banks like the U.S. and Japan still keep interest rates unchanged in an effort to boost domestic economic recovery. On the other hand, the BoE has a difficult choice due to the slow economic recovery but at the same time was faced with high inflationary pressure, higher than its inflation target.
Meanwhile, the Danish central bank had lowered the interest rates by 10 bps to reconcile to the rate in the euro area of 1.0%. Injection of liquidity and purchase of toxic assets under the framework of quantitative easing policy was still carried out by several major central banks like the U.S. and the UK, although at smaller scale. Signal of monetary tightening in developing countries began to surface despite the fact that the policy rate hike was still on hold. The rapid economic recovery and rising inflationary pressures in Asian countries has made some Asian central banks to hold interest rates cut. Some countries such as China and India have started tightening their monetary policy by raising reserves requirement ratio, by 50 bps and 75 bps respectively.
Economic growth in Indonesia
Improved economic growth is expected to persist in the first quarter of 2010 in line with higher demand and global economic development. On the demand side, higher GDP growth is driven by stronger growth in household consumption, investment and exports. Household consumption is estimated to pick up slightly driven mainly by better purchasing power and improved consumer confidence. Exports is also expected to improve further, sustained by the surging demand from trading partner countries and higher international commodity price. Accordingly, investments are also expected to chart better growth corresponded to stronger demand and business confidence. Responding to higher domestic and external demand, imports will also go up. On the supply side, some sectors are forecasted to perform better along with higher external and domestic Graph 2.3 Sales of Electronic Product
��������
��� ��� �� �� �� ��
� � � � �
��������
���� ���� ����
� �� ��� �� � �� ��� �� � �� ��� ���
demand in the first quarter of 2010. Better demand is expected to stimulate growth in some main sectors including manufacturing as well as trade, hotels and restaurants sectors. Meanwhile, the performance of other sectors such as transport and communications sector remain strong and become a main driver to economic growth.
Private consumption in the first quarter of 2010 is forecasted to post stable growth. This estimation is in line with better leading indicators of household consumption. Government plan to raise civil servants, TNI and the Police salary by 5% and an increase in Minimum Regional Wage (UMP) in early 2010 will support higher purchasing power. Improvement in household consumption was also supported by some prompt indicators. Consumption of durable goods such as cars, motorcycles, and electronics went up (Graph 2.3). Retail sales index also rose, up to fourth quarter of 2009, buoyed by expanding consumption in the clothing and equipment as well as food and tobacco (Graph 2.4). Better consumption growth was also reflected in the rising growth of imports of consumption goods (Graph 2.5). In keeping with these developments, indicators related to consumption financing such as real M1 growth also trend up (Graph2.6).
Investment growth (GFCF) in the first quarter of 2010 is forecasted to edge up along with encouraging development in external and domestic demand. Higher investment is sustained mainly by the construction as indicated by high cement consumption (Graph 2.7). This is also accompanied by imports of capital goods (Graph 2.8) that grew along with better business optimism. The major driver of investment growth in the first quarter of 2010 comes from construction. However, financial support from banking remains limited, as indicated by declining growth of real investment credits (Graph 2.9). Business perception survey, conducted by Bank Indonesia showed optimist investor’s appetite to invest. Business Survey (SKDU-BI), also showed that business activities during the fourth quarter of 2009 expanded slightly, lower than the previous quarter of 15.33%, mainly contributed by the financial sector, leasing and corporate services, mining sector, and agricultural sector (Graph 2.10). Although slowed, business activity in the first quarter of 2010 is expanding driven by optimism on the business situation and the company’s financial condition as well as higher price relative to the previous quarter.
Along with continued improvement in Indonesia’s trading partner countries, exports in the first quarter of 2010 is expected to pick up. This is reflected in the improvement of demand in the developed countries,
Graph 2.4 SPE BI : Retail Sales Index
especially US, and Asia emerging markets such as China and Singapore. Optimism in exports growth is supported by an upward trend in the production index, consumer confidence levels and business sentiment in G3 countries and China until the year-end of 2009. In addition, an upward trend in international commodity prices had a positive impact on world trade volume, which is reflected in the rising Baltic Dry index. According to the sectors and groups of commodities, non-oil export growth was sustained by exports of primary commodities in mining sector such as coal and manufacturing products such as palm oil.
Growth of imports in the first quarter of 2010 is also forecasted to go up in line with growing domestic and external demand. Higher import growth is sustained by the improvement in household consumption and demand for raw materials and capital goods for production activities primarily in the manufacturing sector. In addition, continued increase in import growth is confirmed by higher import duties in 2009. Higher import duties reflecting increased value of imports. Following the implementation of the AC-FTA in January 2010, imports of manufacturing products such as textiles come from China is also expected to increase. The source of imports growth will mainly come from higher imports growth of raw materials. Imports growth during January-December 2009 was driven by some commodities associated with added production capacity, such as machinery / mechanical appliances and electrical machinery and equipment.
From production side, improvement is expected to continue in the first quarter of 2010 along with the stronger external demand and stable domestic demand. Major sectors, namely the manufacturing and trade sector are forecasted to perform better in the early quarter of 2010. Meanwhile, the performance of other major sectors, agricultural sector, is forecasted to chart lower growth compared to the previous quarter. Lower growth might come from delayed planting season in October-December 2009 due to El Nino. Transportation and communication sectors as well as electricity, gas and water are still in the high growth rate. The high growth in transportation and communication sector is mainly supported by strong performance in the telecommunications sub-sector. Meanwhile, the mining sector is forecasted to have the potential to grow higher supported by the increasing trend in demand for mining commodities in line with better global economic conditions. The largest share of the economy is still coming from the manufacturing sector, trade, hotels and restaurants sector, as well as the agricultural sector. Meanwhile, the main drivers of Graph 2.7 Growth of Cement Consumption
Graph 2.8 Growth of Imports of Capital Goods
growth are transportation and communications sector, trade, hotels and restaurants sector, as well as the manufacturing sector.
Inflation
Entering 2010, inflationary pressures went up slightly due to non-fundamental factors. However, for the entire year inflation is estimated to stay within its target range of 5% ± 1%. Inflation in January 2010 was recorded at 0.84% (mtm) or 3.72% (yoy), higher than the previous month of 0.33% (mtm) or 2.78% (yoy). Increased inflation pressure mainly came from non-fundamental factors, particularly in the volatile foods, primarily due to rising prices of strategic food commodities (rice). Meanwhile, the pressure of fundamental factors as reflected in core inflation also slightly picked up. From the external side, the continued trend of rupiah appreciation can reduce imported inflation amid certain commodity prices increase. From the domestic side, the interaction of demand and supply side has not led to pressure on prices in general.
Looking from its affecting factors, rising inflation was mainly driven by increases in volatile food. Higher volatile food inflation was mainly contributed by the increase in rice prices in line with the decline in rice production related to seasonal factor. In addition, government policy to raise government purchasing price (HPP) of rice by 10% and the estimated increase of highest retail price (HET) of subsidized fertilizer in April
2010 had pushed up the price of rice. On the other hand, international commodity prices only had a benign impact on domestic food inflation.
In general, increased inflation pressure mainly occurred in the related food category related to reduced production of main food commodities such as rice due to seasonal factors, the psychological impact of increased in HPP of rice and HET of subsidized fertilizer. On a monthly basis, food category also became the biggest contributor to inflation in January 2010 amounted of 0.40%. Other category also contribute to CPI inflation pressure is the processed food category with a contribution of 0.33%. In the meantime, the only group that contributed to deflation in January 2010 is clothing category related to falling gold price.
Administered prices inflation is still relatively low due to no strategic price policies issued by the Government in the reporting period. Administered price inflation in January 2010 was recorded at 0.44% (mtm), lower than
Graph 2.10 Business Plan (SKDU-BI)
Graph 2.11 Inflation
�������������������������
Graph 2.12 Inflation by Category of Goods and Services (%, mtm)
the previous month of 0.68% (mtm). The main commodity contributed to the inflation is the fuel of households (0.03%) and cigarettes (0.04%). Administered inflation in the month of January 2010 among others came from non subsidized fuel price hike (pertamax, Pertamax Plus, etc.), although only have mild impact to inflation in January 2010.
Volatile food inflation rose, both in monthly and annual basis came mainly from lower domestic rice production related to the seasonal pattern (Graph 2.13). Planting season for 2010 is estimated to be delayed around 10-20 days associated with the El Nino effect, although for the whole year of 2010 rice production is predicted to go up. The psychological impact of an increase in HPP of rice on January 1, 2010 and HET of subsidized fertilizer scheduled on April 2010 had pushed volatile food inflation. With these developments, volatile food inflation was recorded at 1.98% (mtm) or 5.17% (yoy), higher than the previous month of -0.19% (mtm) and 3.95% (yoy).
Core inflation began to pick up, both in monthly and yearly basis, although remain relatively low along with benign external pressure and maintained inflation expectations. Core inflation was recorded at 0.59% (mtm) or 4.43% (yoy), slightly went up compared to the previous month of 0.40% (mtm) or 4.28% (yoy). The continuing trend of appreciation of the rupiah can reduce pressure on imported inflation came from higher prices in certain commodity (Graph 2.14). Rising international commodity price are still relatively moderate, except for sugar (Graph 2.15). Meanwhile, gold contribute to deflation to the core inflation (0.04%). On the other hand, economic recovery has not put pressure on the demand as response from the supply side remained adequate. Increased demand also reflected in the higher sales index in December of 3.7% (mtm) and 32.3% (yoy) (Graph 2.16).
Rupiah Exchange Rate
During January 2010, the rupiah strengthened, although had a slight pressure at the end of the month. Prospects for the domestic economy which is quite solid and attractive yield in rupiah assets among the Asian countries were able to support the stability of the rupiah. Pressure occurred at the end of months, were influenced by, among other, the negative sentiment in global financial markets. Negative sentiment came after Graph 2.13 Quantity of Rice for Poor
and Rice Prices
Graph 2.14 Retailer Inflation Expectation (Bank Indonesia Retail
the release of JP Morgan’s losses and the U.S. financial sector policies, worsening fiscal deficits in several European countries, and the decision of the India and China monetary authority to raise reserve requirement (GWM).
Entering the year of 2010, the rupiah strengthened. During January 2010, the average rupiah strengthened 1.90% to Rp9.275 per U.S. dollar (Graph 2.17) and closed at Rp9.350 per dollar or strengthening 0.80% relative to last month. The rupiah had touched the level of Rp9.153 per U.S. dollar, the strongest level since October 2008, although it was later weaken due to the negative sentiment triggered by uncertainties in the external sector. Exchange rate movements during January 2010 have an impact on the increasing volatility of 0.20% (December 2009 position) to 0.96% in the reporting period (Graph 2.18).
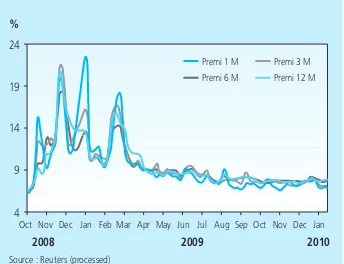
Risk perception is still relatively well preserved in line with maintained expectations on the rupiah. Although increased as a response from the global financial market, Indonesia’s risk perception is relatively stable compared to December 2009 due to solid economic fundamentals and rating upgrade by Fitch from BB to BB +. This provides incentives for investment prospects in Indonesia. Spread EMBIG moved up to 323 bps from 294 bps level at the period of December 2009 (Graph 2.21). Yield spread between Indonesia global bond and U.S. T-Note also went up to 228 bps from 174 bps at December 2009. Meanwhile, the CDS spread was slightly down from 192 bps in December 2009 to 190 bps in line with the CDS movement in Asian emerging markets. Other risk indicators, ie, the swap premium was also stable indicating no pressure on the rupiah (Graph 2.22).
Relatively wide spread of rupiah denominated assets with those in other currencies had helped support the stability of the rupiah. Uncovered Interest Rate Parity (UCIP) in January 2010 was 6.48%, relatively stable when compared with the level of 6.51% in the previous month. Meanwhile, a little increased risk indicator at the end of the period have caused covered interest rate parity (CIP) went down to 4.21% from 4.77% in December 2009. Although declining, rupiah yield spread was still higher than other countries in the region make Indonesia remain attractive for global investor (Graph 2.23). Those condition supported the stability of the rupiah amid disruption in the global financial market.
Graph 2.16 Real Sales Growth
(Bank Indonesia Retail Sales Survey)
Graph 2.17 Average Rupiah Exchange Rate
��
Monetary Policy
Interest Rates
In January 2010, monetary policy transmission to short-term interest rates went well. Under unchanged BI rate of 6.50%, average daily rate of O/N inter-bank money market (PUAB) dropped 3 bps to 6.23%. The development showed that O/N PUAB rate is relatively stable around the BI Rate. In addition, monetary policy also transmitted to longer maturity PUAB rate. Abundant banks liquidity have pushed PUAB rates to continue falling, especially for periods of over 27 days. This condition indicates the improved perception of counterparty risk.
Maintained liquidity in financial markets was in line with better risk perception. Liquidity in the money market was more evenly distributed, as reflected in the narrower spread between the highest and lowest interest rates daily average. That condition, in part, came from Bank Indonesia’s efforts to maintain adequate liquidity in the money market through Open Market Operations and the interest rate corridor (standing facilities).
Amid stable BI rate, deposit rates continue to decline significantly. In December 2009, 1 month deposit rates were reduced by 29bps, larger than the previous month of 22bps. In 2009, 1 month deposit rate fell 353bps greater than the decline in the BI Rate of 300bps. Meanwhile, interest rate of deposits for all maturities went down 33bps on average in December 2009. The largest drop occurred in 12 months deposit rate, which went down 86bps, while 24 months deposit rate went up 4bps. That condition reflected banks intention to provide more incentives for longer-term fund placement. From the category of banks, state-owned banks posted the largest deposits rate decline during the period. In December 2009, state-owned banks registered lower deposit rates of 51bps, followed by national private banks of 23bps and joint venture banks of 14bps.
Monetary policy transmission to the credit rates was limited. Although slowed, the decline in credit rates continued until December 2009. In aggregate (average of interest rates of working capital credit, investment credit, and consumption credit) in December 2009 fell by 13bps, or better than the previous month of merely 9bps. The largest interest rate cut occurred in working capital credit (KMK) which was down by 29bps, while Graph 2.20 Appreciation/Depreciation
Exchange Rate Average (January 2010 compare to December 2009)
Graph 2.19 Performance of Global Stock Markets
Graph 2.21 Indonesia Risk Perception Indicator
investment credit (KI) and credit consumption (KK) went down by 7bps and 5bps respectively. Private national banks posted the largest credit rates cut, followed by state-owned company.
Limited monetary policy transmission to the credit mainly related to bank’s risk perception and high margin. Bank’s high risk perception is reflected in wide interest rate spreads between credit rates and Base Lending Rate (BLR), while bank’s high can also be indicated by widening spread between real deposit rates and real credit rates. On the other hand, bank’s cost of fund was somewhat higher than the 2007-2008 period despite the fact that current BI rate was lower than in the 2007-2008 period. The condition is mainly related to the realignment process of deposit rates that made deposit rates higher than the BI rate during the global crisis in October 2008.
Graph 2.22 Swap Premium
Graph 2.23 Comparison of Some Regional Countries Yield Spread Government Bond
�
� � �� �� ��
��������� ��������� ��������� ����������
���� ����
����������������������������
��� ��� ��� ��� ��� ��� ��� ��� ��� ��� ��� ��� ��� ��� ��� ��� ����
�
�� � � �� �� ��
����������������������������������������� �����������������
��������� �������� ����������� �������� ���������
��� ��� ������������ ��� ��� ������ ��� ��� ��� ��������������� ��� ��� ������ ��� ��� ���
���� ���� ����
����
����
���� ����
�����
Table 2.1
Development of Various Interest Rates
Interest Rate (%)
BI Rate 8.75 8.25 7.75 7.5 7.25 7.00 6.75 6.50 6.50 6.50 6.50 6.50
Deposit Guarentee 9.50 9.00 8.25 7.75 7.75 7.50 7.25 7.00 7.00 7.00 7.00 7.00
1-month Deposit (Weighted Average) 10.52 9.88 9.42 9.04 8.77 8.52 8.31 7.94 7.43 7.38 7.16 6.87
Base Lending Rate 14.18 13.98 13.94 13.78 13.64 13.40 13.20 13.00 12.96 13.01 12.94 12.83
Working Capital Credit 15.23 15.08 14.99 14.82 14.68 14.52 14.45 14.30 14.17 14.09 13.96 13.69
Invesment Credit 14.37 14.23 14.05 14.05 13.94 13.78 13.58 13.48 13.20 13.20 13.03 12.96
Consumption Credit 16.46 16.53 16.46 16.48 16.57 16.63 16.66 16.62 16.67 16.53 16.47 16.42
2009
Deposits, Credits, and Money Supply
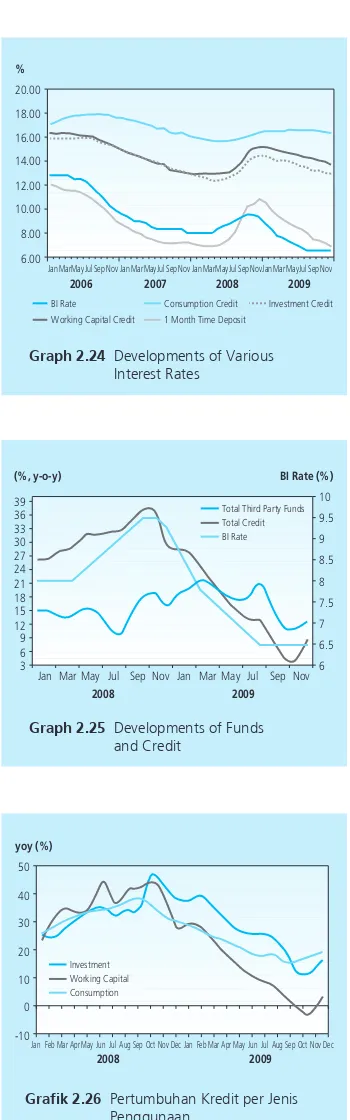
In December 2009, deposits increased by Rp76, 1 trillion to Rp1.973 trillion. This increase comes from rupiah funds specifically rupiah saving deposits of Rp50 trillion and Rp19, 9 trillion in rupiah time deposits. Meanwhile, increasing rupiah demand deposit was relatively lower, amounted Rp8, 1 trillion, which mainly came from the increase in ownership of a private companies and individuals. Although overall deposits picked up, the deposits in 2009 posted a somewhat slower growth relative to previous year, from 12.5% (yoy) to 16.1% (yoy) (Graph 2.24).Credit growth in monthly basis increased. In December 2009 the growth of credit (including Channeling) reached 8.7% (yoy) higher than the previous month of 4.3% (yoy). Credits (including Channeling) in December 2009 rose Rp39, 9 trillion from the previous month, the highest increase in 4 (four) years in the same period. From its category, the driver of credit growth came from consumer credits. Meanwhile, working capital credits have started to improve. On annual basis, growth in working capital credits, investment credits and consumer credits in December 2009 reached 2.7%, 16.4%, and 19.0% respectively (Graph 2.25).
Although picking up in the monthly basis, credit growth for 2009 is still lower than it was in the previous year. Restraint transmission of monetary policy through credit lines came both from the demand and the supply side. From the demand side, credit growth slowed in line with slowing domestic and external demand coupled with high interest rates (Graph 2.26). Meanwhile, from the supply side, credit extension was constraints by high risk perception triggering resistance in further credit rate cut.
Liquidity in December 2009 improved relative to the previous month. On an annual basis, growth in M1, M2, and M2 rupiah rose 8.4%, 13.1% and 13.9% (yoy) respectively, higher than the previous month of 6.8%, 11.5% and 13.0 % (yoy) (Graph 2.27). M1 went down Rp1, 9 trillion to Rp505, 6 trillion associated with the seasonal pattern of government expenditure at the year-end. Meanwhile, M2 and M2 rupiah positions increased Rp77, 7 trillion and Rp80, 1 trillion respectively, in line with rising quasi-money component. Those conditions reflecting slowed economic activities as can also be seen in M1 growth which remained at a level lower than its historical average.
Graph 2.24 Developments of Various Interest Rates
Stock Market
JCI improved in January 2010. JCI rose by 3.02% and was closed at 2610.8. Market get a signals that there is no significant inflationary pressure until the first semester of 2009. Unchanged BI Rate is translated as central bank efforts to boost the momentum of economic growth while maintaining the inflation target in 2010. It is then responded with an increase in market transactions in the stock market.
Development in the global financial markets held back the JCI rally in early year. Monetary policy tightening and plan to limit credit expansion in China, U.S. exit plan, adjustment in monetary operations, and controlling the size and business activities of banks in the U.S. as well as Greek debt market crisis due to worsening fiscal deficits had caused correction in the regional index, which in turn also affect the performance of JCI. However, JCI eventually succeeded to rebound backed by: (1) moves by the Fed to maintain the Fed Funds Rate at 0-0,25%, (2) plans of tax cuts by the U.S. Government, (3) U.S. President’s speech confirming that there is no intention to “punish” banks, and (4) stable political condition (5) improved rating for the eight domestic commercial banks by FITCH rating agency, from ‘BB’ to ‘BB +’. Indonesian government’s debt rating was also raised to a level below investment grade. Such developments ultimately could lead JCI to outperform the regional index (Graph 2.28)
Improved performance is also in line with better liquidity in the stock market. Trading volume in the domestic market during January 2010 picked up by Rp3.79 trillion per day compared to Rp2, 9 trillion per day in December 2009 (Graph 2.29). Those developments had improved confidence in the market during January 2010. In the midst of increasing trade volume, net foreign buying recorded only Rp0.58 trillion in December 2009, lower than it was in December 2009 of Rp3.84 trillion.
SUN Market
Transmission of monetary policy in a SUN market was characterized by declining SUN yield for almost all maturity spectrum. SUN yield fell 11bps on average compared to the previous month. SUN yield decline was also driven by improved external debt in line with better Indonesia’s economic growth prospects. Lower SUN yield were seen mainly in the medium and long term SUN by 25bps and 16bps respectively, while yield for short-term
Graph 2.27 Growth of Currency in Circulation (Nominal)
Graph 2.29 JCI and Regional Index
tenor was up by 22bps in response to economic condition in China, USA and Greece.
Lower SUN yield derived its origin from some factors that come from both external and domestic. External factors contribute positively to the SUN encouraging performance as reflected in the foreign investor’s appetite in the market and rupiah stability and improved credit default swap index. Meanwhile, strong economic fundamentals, such as positive growth and controlled inflation also provided a positive sentiment to the market. Fiscal risks do not put pressure on the SUN market after global commodity prices adjustment in January 2010. However, along with restrictions on credit expansion plans in China and restrictions on US banks investments in mid-January 2010, the declining trend in SUN yield was somewhat restrained.
Declining SUN yield during January 2010 was followed by increased trading volume. On average, SUN trading volume went up to Rp3, 3 trillion per day compared to Rp2.9 trillion per day in December 2009 (Graph 2.30). In line with the increasing trading volume, foreign ownership of SUN rose by Rp25 trillion. Higher trading activity in the SUN market had increased the frequency of the daily average trading to 255 times per day in January 2010 compared to 196 times per day in December 2009 (Graph 2.31).
Mutual Fund Market
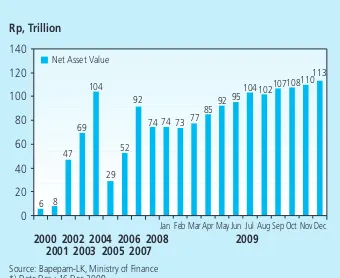
Positive developments in the stock and SUN market along with deposit rate cuts encouraged the development of mutual fund. Improving performance in the mutual fund underlying assets continue to support higher Net Asset Value (NAV) at the end of 2009 (December 16, 2009). NAV in December 2009 reached Rp112, 9 billion jumped from Rp 74.3 in the beginning of the year (47.7% -YTD) (Graph 2.32).
Along with rising NAV, the average daily yield per mutual fund products in the last 12 months also surged. Yield for stock-based mutual funds reached 99.2% with the number of products were 63, the yield for fixed-income mutual funds was 15.15% with 114 products, mutual funds yield reached 49.6% with the number of products of 104, money market mutual fund yields reached 3.8% with the number of products of 27. Meanwhile, the types of mutual funds that contribute most to higher NAV is stock-based mutual fund, which increased by Rp16.6 trillion or grew 83.9% (YTD). Increased stock-based mutual funds was in line with rising stock prices with JCI went up by 86.1% during 2009.
Graph 2.30 JCI and Average Trading Volume
������������
� � � � � ��
���� ���� ���� ���� � � � � � � � � �������� � � � � � � � �������� � � � � � � � �����������
����� ����� ����� ����� �����
���������������������������� ����������
Graph2.31 Government Securities Volume
������������ �
� � � � � ��
���� ���� ���� ���� ���� ���� � � � � � ��� � � � � ��� � � � � ��� � � � � ��� � � � � �� ��
�� �� ��
�������������������������������������� �������������������
Graph 2.32 Government Securities Trading Frequency
������������
� ����� ����� ����� ������ ������ ������
���� ���� ���� ���� � � � � � � � � �������� � � � � � � � �������� � � � � � � � ��������
Banking Conditions
In general, the performance of the banking sector remains solid. Key banking indicators such as the banking capital adequacy ratio (CAR), non-performing loan (NPL), Net interest margin (NIM) and return on assets (ROA) remain stable amid unstable global conditions. NPLs in December 2009 was much lower and arrived at 3.8%, while CAR is still solid in the level of 17.4%, far above the BI stipulated minimum level of 8%. Meanwhile, ROA and NIM remained stable at 2.6% and 0.5% (Table 2.2).
Graph 2.33 Development of Mutual Fund
������������
��������������������������������������� �������������������������
� �� �� �� �� ��� ��� ���
���������������
��� ��� ������ ������ ��� ��� ��� ��� ��� ��� ����
�������������������������������� ���� � �
�� ��
���
�� ��
�� �� �� �� ��
���� �� ��� ���������
��� ���
Table 2.2
Main Indicators of Banking System
Main Indicators
Total Asset (T Rp) 2,310.6 2,307.1 2,344.9 2,352.1 2,327.4 2,309.8 2,354.3 2,331.4 2,384.6 2,388.6 2,392.7 2,439.7 2,534.1
DPK (T Rp) 1,753.3 1,745.6 1,767.1 1,786.2 1,780.9 1,783.6 1,824.3 1,806.6 1,847.0 1,857.3 1,863.5 1,897.0 1,973.0
Credit (T Rp) 1,353.6 1,325.3 1,334.2 1,342.1 1,332.1 1,339.2 1,368.9 1,370.2 1,400.4 1,399.9 1,410.4 1,430.9 1,470.8
LDR (%) 77.2 75.9 75.5 75.1 74.8 75.1 75.0 75.8 75.8 75.4 75.7 75.4 74.5
NPLs Gross* (%) 3.8 4.2 4.3 4.5 4.6 4.7 4.5 4.6 4.5 4.3 4.3 4.4 3.8
NPLs Net * (%) 1.5 1.6 1.6 1.9 2.0 1.9 1.7 1.7 1.5 1.3 1.2 1.4 0.9
CAR (%) 16.2 17.6 17.7 17.4 17.6 17.3 17.0 17.0 17.0 17.7 17.6 17.0 17.4
NIM (%) 0.5 0.5 0.3 0.6 0.5 0.5 0.5 0.5 0.5 0.4 0.5 0.5 0.5
ROA (%) 2.3 2.7 2.6 2.8 2.7 2.7 2.7 2.7 2.7 2.6 2.7 2.6 2.6
2008 2009
Dec Jan Feb Mar Apr May Jun Jul Aug Sep Oct Nov Dec
III. MONETARY POLICY RESPONSE
* Provisional Figures
* Using 2000 base year (BPS-Statistic Indonesia) 1) end of week
2) weighted average 3) end period closing 4) closed file
Sources : Bank Indonesia, except stock market data (BAPEPAM), CPI, export/import and GDP (BPS)
Latest Indicators
FINANCIAL SECTOR
H A R G A
SEKTOR EKSTERNAL
INDIKATOR KUARTALAN
INTEREST RATE & STOCK One month SBI 1) Three month SBI 1) One month Deposit 2) Three month Deposit 2) One week JIBOR 2) JSX Indices 3)
MONETARY AGGREGATES (billions Rp) Base Money
M1(C+D) Currency (C) Demand Deposit (D) Broad Money (M2 = C+D+T)
Quasi Money (T) Quasi Money (Rupiah) Time Deposit Saving Deposit Foreign Currency Deposit Broad Money Rupiah
Claim on Business Sector Credit by DMBs
CPI - monthly (%, mtm) CPI - 1 year (%, yoy)
Rp/USD (endperiod,midrate) Non oil/gas Export (f.o.b, million USD) 4) Non oil/gas Import (c$f, million USD) 4) Net International Reserve (million USD)
Real GDP Growth (% y-o-y) Consumption Investment Changes in Stocks Export Import
9.50 8.74 8.21 7.59 7.25 6.95 6.71 6.58 6.48 6.49 6.47 6.46 -
9.93 9.25 8.61 7.95 7.39 7.05 6.79 6.63 6.55 6.60 6.59 6.59
-10.52 9.89 9.42 9.04 8.77 8.52 8.31 7.94 7.43 7.38 7.16 6.87 -
11.34 11.13 10.65 10.09 9.68 9.25 8.99 8.73 8.35 7.97 7.68 7.49
-9.43 8.71 8.30 8.03 7.69 7.09 6.96 6.56 6.46 6.46 6.47 6.46
-1,333 1,285 1,434 1,723 1,917 2,027 2,323 2,342 2,468 2,368 2,416 2,534 2,611
314,662 303,777 304,718 308,277 309,232 322,994 322,850 324,663 354,297 364,869 376,938 402,118
-437,388 434,233 448,452 454,221 455,364 483,053 469,346 490,575 490,501 485,979 495,554 507,682
-191,339 186,611 186,538 191,194 192,143 203,838 201,172 200,871 210,822 206,305 212,547 228,009
-246,049 247,622 261,914 263,027 263,221 279,215 268,174 289,704 279,679 279,674 283,007 279,673 -
1,754,293 1,773,980 1,794,004 1,794,888 1,807,388 1,859,690 1,841,112 1,871,955 1,889,157 1,900,907 1,928,840 2,004,617
1,316,905 1,339,747 1,345,553 1,340,667 1,352,024 1,376,637 1,371,766 1,381,381 1,398,656 1,414,928 1,433,286 1,496,935
1,175,565 1,190,990 1,202,724 1,205,976 1,217,906 1,245,822 1,245,247 1,251,225 1,272,217 1,285,497 1,297,781 1,359,001
-686,919 703,027 706,002 705,379 715,139 726,088 724,888 727,889 731,202 741,072 738,118 755,996
-488,645 487,964 496,722 500,597 502,767 519,733 520,359 523,336 541,015 544,425 559,663 603,005
-141,341 148,757 142,828 134,691 134,118 130,815 126,519 130,156 126,439 129,431 135,505 137,934
1,612,953 1,625,223 1,651,176 1,660,197 1,673,270 1,728,875 1,714,594 1,741,800 1,762,718 1,771,476 1,793,335 1,866,683
1,391,619 1,403,408 1,401,342 1,387,947 1,392,747 1,419,799 1,435,290 1,465,870 1,463,662 1,478,447 1,503,304 1,543,901
1,293,600 1,305,681 1,303,885 1,292,306 1,298,095 1,320,131 1,333,469 1,351,511 1,348,857 1,361,096 1,383,567 1,408,669
--0.07 0.21 0.22 -0.31 0.04 0.11 0.45 0.56 1.05 0.19 -0.03 0.33 0.84
9.17 8.60 7.92 7.31 6.04 3.65 2.71 2.75 2.83 2.57 2.41 2.78 3.72
11,355 11,980 11,575 10,713 10,340 10,225 9,920 10,060 9,681 9,545 9,480 9,400 9,365
6,345 6,713 7,473 7,053 8,229 8,470 8,437 8,966 8,200 9,714 8,678 -
-5,706 5,008 5,819 5,488 6,366 6,987 7,720 7,313 5,589 7,405 7,109 -
-47.96 47.17 50.68 51.72 51.65 50.99 50.72 50.84 53.81 55.68 56.15 57.69 61.59
4.40 4.00 4.20
7.30 6.30 5.40
-0.80 3.20 4.20
-146.40 88.20 23.80
-18.70 -15.50 -8.20
-26.00 -23.90 -18.30
Jan Feb Mar Apr May Jun Jul Aug Sep Oct Nov Dec Jan
2009 2010