Key to Solve Nervous System at PT. Schneider Electric
Manufacturing Batam
Gracia Vicki Widarso1, Jani Rahardjo2
Abstract: PT. Schneider Electric Manufacturing Batam is an industry that concern in electrical component. There is a team in this company that conduct a Master Production Planning (MPP) and vendor forecast, the MPP is a production planning that contain several constrains. But there is a missing constrain, is a warehouse capacity. By using DMAIC approach this project was started. In this project, there is a tools that can control the inventory level at SEMB’s warehouse (Batam Logistics Platform/BLP). With this tools, we can be knowing the utilization rate of the warehouse for six months ahead and knowing the most contribute of the warehouse base on supplier view and commodity view. Available capacity in BLP is 10,412.70 m3 with contain 47 rows. Then the utilization rate of warehouse in May until June is about 63%-69% when demand is in low level. The utilization rate warehouse in May until June when demand is in stable level is about 44%-54%. And when demand is in high level, the utilization rate is about 34%-48%. The additional information is to knowing the suppliers which use 80% space of warehouse capacity and the commodity. There are 35 suppliers and there are 8 commodities that use more space in warehouse.
Keywords: MPP, Vendor Forecast, Warehouse, DMAIC, Inventory
Introduction
PT. Schneider Electric Manufacture Batam (SEMB) is a manufacture industry that produce electrical components. This industry has been established since 1991. Industry that located in Jalan Beringin Muka Kuning Batam has four plant. Four plant are divided into three plant for production area, they are Production Electrome-chanic (PEM), Production Electronic (PEL), and Sensors and the last plant is especial for the storage of raw materials referred to Batam Logistic Platform (BLP).
BLP is warehouse that SEMB has and support those three plants. BLP was initiated before 2011 and since 2009 there are three times leader change. Finally, BLP was started in 2014 and from 2014 until now there are several projects started and transferred to SEMB. Sales in SEMB since year 2000 until 2015 has increased. Every month, downstream planning team and upstream planning team have done regular process, it is to conduct Master Production Planning (MPP).
1,2 Faculty of Industrial Technology, Industrial Engineering Department, Petra
Christian University. Jalan Siwalankerto 121-131, Surabaya 60236. Email: [email protected], [email protected]
MPP is to define production quantity which have count several constrains, which is like supplier capacity, production capacity, materials, etc. That constrains is without warehouse capacity which mean assume that warehouse can keep all the raw material. But, in fact, there are about 20 containers that cannot unload in warehouse since the capacity in BLP is not enough. In SEMB, there is a parameter to control the stock in-ventory. The parameter in healthy or unhealthy stock. Stock inventory will be said healthy if the stock inventory is in between healthy stock minimum and healthy stock maximum. In January 2016, the inventory stock is on target.
Methods
time, in order to minimize system wide costs while satisfying service level requirements [1]. Van Den Berg [2] said that a warehouse should be viewed as a temporary place to store inventory and as a buffer in supply chains. Raw materials storage is one of the several warehouses.
DMAIC is a problem solving for the process improvement. There are five steps in DMAIC, they are Define, Measure, Analyze, Improve, and Control [3]. In the step Define, we collect the all of data that needed to complete this project. The next step is to measure all of the data needed. Then, analyze the data, and in this step we build a tool to be a template. There are four step to build the tool. First is design the tool with name Warehouse Space Requirement Plan. Next is define error analysis from each data input through data integration. Then, generate required queries to get required information. And the last is generate summary. The fourth step on DMAIC we execute this project and make six months warehouse space requirement. And the last step is to control this project mean to give some feedback and recommendation.
Result and Discussion
Data Collection
BLP is divided by two lot, they are Lot 15 and Lot 16. BLP contain 46 rows at all. Warehouse capacity need to be captured to show the available space in the BLP. After measuring manually, the capacity of Lot 15 is 3,005.18 m3 and the capacity of Lot 16 is 7,407.52 m3. Thus, the total capacity of BLP is 10,412.70 m3. SEMB has 11,886 materials in total. Those all materials are active part. Then, data that needed to complete this project is the dimension box and quantity per box of each material. The additional information is commodity and supplier for each material. Next data is outstanding open Purchase Order (PO). Outstanding open PO is quantity that haven’t delivered from supplier. Since this project is measure monthly, thus, the outstanding open PO is collect monthly too. The outstanding open PO is from May until November.
Forecast consumption quantity can be defined by Average Monthly Forecast (AMF), it is mean how many quantities that consumed in a month.
Minimum Order Quantity is the amount of the minimum order. Safety stock is the planned or actual amount of extra inventory used to product against fluctuations in demand or supply or the planned or actual inventory position just before a replenishment order is received in inventory sometimes called buffer stock, reserve stock, or inventory buffer [4]. The last data input is vendor forecast quantity, which mean forecast to order to supplier when the system haven’t
Warehouse Space Requirement Plant
The purpose of warehouse space requirement plant is to know whether warehouse capacity is able to storage materials or not in six months ahead. There are two type of replenishment strategy in this company. First is normal replenishment strategy, which means order with PO then the supplier process it then delivers to SEMB. Then, special replenish-ment strategy like consignreplenish-ment, kanban, etc. This strategy let the supplier know the stock in SEMB and let the supplier manage about the replenishment. SEMB just manage the safety stock and the forecast, then job description of the supplier is to fulfil the quantity until the safety stock level. This special strategy will influence the calculation in this project. That replenishment strategy will impact on the calculation space needed. The calculation for special replenishment strategy is used calculation space with the safety stock quantity. Because of the target of this strategy is stock level in the safety stock quantity every day. The space calculation is directly uses roundup from safety stock divided by quantity per box then times with dimension packing box. Otherwise, the normal replenishment is uses several formula in May, to get June quantity the formula is Stock1 in May summed with outstanding open PO in June then minus with AMF. The similar formula can be use in several months ahead.
Warehouse Space Requirement Plan base on Healthy Stock Maximum
Space requirement plan in this section is base on healthy stock maximum. Then, the vendor forecast quantity will be calculated if the quantity in Stock1 is less than healthy stock maximum. The formula to get the vendor forecast quantity is if Stock1 less than HS max then quantity to order is roundup the difference of HS Max with Stock1 divided with the MOQ and then times with MOQ else zero. Back to the purpose on this project, need to know the space requirement in the warehouse in every month. That stock require-ment will be converted to space m3. To get the space requirement, first need is the total box in each material. Total box in each material can get from stock requirement divided by quantity per box. Total box times volume per box will be the space require-ment in that material. The next data is to evaluate the stock level, it is in less than HS Min, in between HS Min and HS Max, or in higher than HS Max.
Warehouse Space Requirement Plan base on Safety Stock
Vendor forecast quantity in this condition is to trigger order to supplier if the quantity in Stock1 is less than safety stock. Thus, if Stock1 is less than SS then quantity to order is roundup the difference of SS with Stock1 divided with the MOQ and then times with MOQ else will be zero. After the Stock1 and vendor forecast quantity has been declared, the real stock to convert into space requirement can be known. The real stock is a result from summed Stock1 and vendor forecast quantity. The formula to get the space requirement is roundup the quantity divided by quantity/box then times with volume box. The next data is to evaluate the stock level, it is in less than HS
Min, in between HS Min and HS Max, or in higher than HS Max.
Warehouse Space Requirement Plan base on Healthy Stock Minimum
The third condition to get space requirement plan in six months ahead is order base on healthy stock minimum. As per discussed in the section before, the difference calculation is in the vendor forecast quan-tity. HS Min is used to be a comparison with the Stock1, so if the quantity in the Stock1 is lower than HS Min level, then vendor forecast will trigger to order to the supplier. The final stock requirement formula is similar with the stock requirement before. It has the result from sum between Stock1 and vendor forecast quantity. The space needed when the vendor forecast base on HS Min are will be lower than base on SS and HS Max. The next data is to evaluate the stock level, it is in less than HS Min, in between HS Min and HS Max, or in higher than HS Max.
Analysis Warehouse Space Requirement Plan
Warehouse space requirement plan is to compare the available space in warehouse and space requirement for 11,866 materials. Every month there are movement in those materials, arrival from supplier and consumption. Then, when the materials are buffer in warehouse, it will impact in utilization rate of warehouse. The utilization rate warehouse when 100% is 10,412.70 m3. SEMB has a target that 70% utilization rate is fully enough. The 70% of total capacity is 7,288.89 m3. Thus, if there are a month with space requirement higher than 7,288.89 m3, the space in warehouse is overloaded. Summary of space requirement will have divided by three depend on three situations have explained in section before.
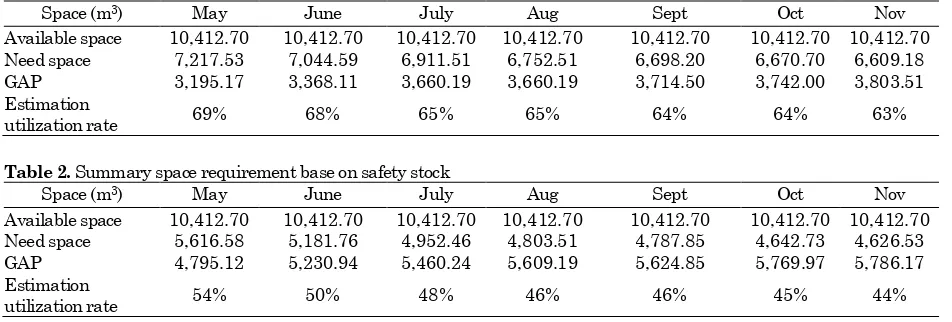
Table 1. Summary space requirement base on healthy stock maximum
Space (m3) May June July Aug Sept Oct Nov
Available space 10,412.70 10,412.70 10,412.70 10,412.70 10,412.70 10,412.70 10,412.70
Need space 7,217.53 7,044.59 6,911.51 6,752.51 6,698.20 6,670.70 6,609.18
GAP 3,195.17 3,368.11 3,660.19 3,660.19 3,714.50 3,742.00 3,803.51
Estimation
utilization rate 69% 68% 65% 65% 64% 64% 63%
Table 2. Summary space requirement base on safety stock
Space (m3) May June July Aug Sept Oct Nov
Available space 10,412.70 10,412.70 10,412.70 10,412.70 10,412.70 10,412.70 10,412.70
Need space 5,616.58 5,181.76 4,952.46 4,803.51 4,787.85 4,642.73 4,626.53
GAP 4,795.12 5,230.94 5,460.24 5,609.19 5,624.85 5,769.97 5,786.17
Estimation
Table 3. Summary space requirement base on healthy stock minimum
Space (m3) May June July Aug Sept Oct Nov
Available space 10,412.70 10,412.70 10,412.70 10,412.70 10,412.70 10,412.70 10,412.70
Need space 5,012.73 4,307.38 4,009.56 3,903.86 3,765.80 3,642.45 3,544.24
GAP 5,399.97 6,105.32 6,403.14 6,508.84 6,646.90 6,770.25 6,868.46
Estimation
utilization rate 48% 41% 39% 37% 36% 35% 34%
Table 4. Number of stock keeping unit
Numb. Of SKU May June July Aug Sept Oct Nov
Higher than HS Max 6,081 5,635 5,458 5,284 5,194 5,069 5,054
In Between 5,803 6,249 6,426 6,600 6,690 6,815 6,830
Less than HS Min 0 0 0 0 0 0 0
Data in Table 1, Table 2, and Table 3 says that warehouse can keep all material for six months onward. Utilization rate of warehouse that can say full is in 70% so if look on the summary there is no constrain with the warehouse. By looking for those tables, when demand is in low level so impact to the consumption and make the warehouse almost full but still in the comfort level. Otherwise, when the demand is in stable level and high level, the warehouse utilization rate is about 30%-50%. The other summary of space requirement is to convert into pallet requirement with volume can be fill in one pallet is 0.768 m3.
Process maintains to keep stock in healthy level is know the stock keeping unit (SKU). The numbers in SKU is the total material that in its level, which means there are some material in position higher than HS Max, in between HS Max and HS Min, and less than HS Min. Calculate of number of SKU is just on normal condition, it refers to warehouse space requirement plan base on safety stock. Table 4 show that around 50% from total material are in level higher than HS Max. By these data, we can know that control of material need to take more attention since there are half of total material is not in healthy level. This situation can influence the space in warehouse. The additional information in this tool is to knowing top 80% space occupancy based on supplier view. About 20% of all suppliers who used approximately 80% space in warehouse. Total suppliers who support SEMB business is 362 suppliers. Then, there are 32 suppliers that need more space in BLP. Thus, with this tool, the action to reduce the used space in warehouse is to focus with those suppliers.
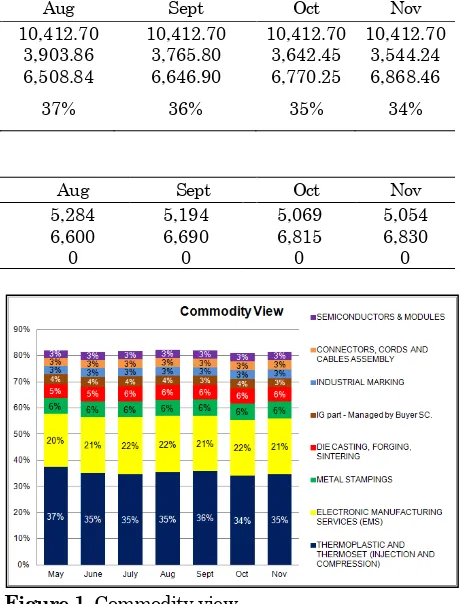
Furthermore, the other view is based on commodity view as seen in Figure 1. From these data the highest space occupied is in commodity thermoplastic and thermoset (around 30% this commodity occupy space in warehouse). There are eight commodities that use 80% of space in warehouse.
Figure 1. Commodity view
Error Analysis
There are some errors in this tool like not complete in collecting the data. There are several materials that not have dimension and quantity per box. Material that doesn’t have dimension packing box is about 3% it is mean 899 materials of 11,886 total materials not yet detect in dimension packing box. Otherwise, in quantity per box view, we can see that 8% from 11,886 materials don’t have quantity per box, that quantity is 407 materials. The quantity of material doesn’t have dimension is sure doesn’t have quantity per box too.
Conclusion
Knowing the capacity of warehouse is one of part in company. BLP has been built in 2014 and have support to keep raw material to three plants in SEMB. There are 46 rows in BLP and the total available space is 10,412.70 m3 and utilization rate to be alerted when warehouse full is 70% of total available space. Warehouse available space will have compared with spare requirement plan for six months ahead. Warehouse space requirement plan can give information whether warehouse have enough space or not. To fulfil this requirement, there is a tool that can help to knowing the gap between available spaces and need space.
From warehouse space requirement, we can know the utilization rate every month. Then, there is highlight information about which material that in unhealthy level whether less than healthy stock minimum or higher than healthy stock maximum. Space requirement is outcome from collaboration between stock and vendor forecast quantity. Other information from this tool is to knowing top 80% space occupied based on supplier view and commodity view. Thus, with this tool, management can be easier to manage the stock level in raw material that impact in warehouse capacity.
Implementation of warehouse space requirement plan in May until November 2016 can give us capture about utilization rate in six months ahead. When demand is in stable level, which means order process based on safety stock, the wareh6ouses are enough to keep the materials. Also, the additional information is we have known there is 25 suppliers that need to take more attention since these suppliers has occupied 80% from warehouse capacity. Thus, with this tools the deficiency in the report of MPP will be defined. One of constrain in Master Production Planning can be added, that is a warehouse capacity planning.
Reference
1. Simchi-Levi, D., Kaminsky, P., Simchi-Levi, E., & Shankar, R. (n.d.). Designing and
Managing the Supply Chain. The
McGraw-Hill Companies.
2. Richards, G. (2014). Warehouse Management. Kogan Page.
3. Montgomery, D. C. (2009). Introduction to
Statistical Quality Control. Wiley.
4. Hill, A. V. (2012). The Encyclopedia of
Operations Management. New Jersey: