Full Terms & Conditions of access and use can be found at
http://www.tandfonline.com/action/journalInformation?journalCode=vjeb20
Download by: [Universitas Maritim Raja Ali Haji] Date: 11 January 2016, At: 20:54
Journal of Education for Business
ISSN: 0883-2323 (Print) 1940-3356 (Online) Journal homepage: http://www.tandfonline.com/loi/vjeb20
Test Item Order, Level of Difficulty, and Student
Performance in Marketing Education
Brian Anthony Vander Schee
To cite this article: Brian Anthony Vander Schee (2013) Test Item Order, Level of Difficulty, and Student Performance in Marketing Education, Journal of Education for Business, 88:1, 36-42, DOI: 10.1080/08832323.2011.633581
To link to this article: http://dx.doi.org/10.1080/08832323.2011.633581
Published online: 19 Nov 2012.
Submit your article to this journal
Article views: 102
ISSN: 0883-2323 print / 1940-3356 online DOI: 10.1080/08832323.2011.633581
Test Item Order, Level of Difficulty, and Student
Performance in Marketing Education
Brian Anthony Vander Schee
Aurora University, Aurora, Illinois, USA
Using multiple-choice exams, instructors can discourage student cheating by making more than one version. However, this may unintentionally compromise student performance as sequencing items from easy to hard was traditionally viewed as the most constructive. The author examined the scores on 1,335 multiple-choice exams in a principles of marketing course to investigate student performance based on level of difficulty test item order, gender, and major. The results suggest that test item order and its interaction with gender or major is not a significant factor in student performance. Thus, faculty who teach introductory marketing courses with students from various business majors should feel comfortable randomizing on multiple-choice exams.
Keywords: level of difficulty, marketing education, multiple-choice exams, test item order
Marketing educators routinely utilize multiple-choice exams to assess student learning. There are critics to this approach; however, examinations formatted in this way are efficient and convenient, particularly in larger course sections. Instructors often utilize more than one version of a particular exam to minimize the opportunity for students in close proximity to copy responses. In making various versions with the same test items included in all versions, items can appear in the same order that the material was covered in class, reverse order, or randomly regardless of chronology. Each student can have test items presented in a uniform order with the options for each item scrambled by exam version. Test items can also be ordered based on level of difficulty where harder items appear first, then medium, and finally easier items (hard-easy). This order can be reversed with easier items appearing first, then medium, and finally harder items (easy-hard). Test item order based on difficulty level can also be randomized (random).
Conflicting results regarding multiple-choice testing leads to the question, does difficulty level test item order influ-ence student performance on multiple-choice exams? Fur-ther, does the interaction between demographic factors such as gender or major and exam version account for differences in performance to a greater degree? In this study I used a
Correspondence should be addressed to Brian Anthony Vander Schee, Aurora University, Dunham School of Business, 347 S. Gladstone Avenue, Aurora, IL 60506, USA. E-mail: [email protected]
principles of marketing course to add insight and provide clarification.
LITERATURE REVIEW AND HYPOTHESES
Studies focused on multiple-choice testing are prevalent in business education including accounting (Canlar & Jackson, 1991), economics (Becker & Johnson, 1999), finance (Heck & Stout, 1991), and marketing (Bacon, 2003). They have re-searched various aspects of the exams and the students. For example, multiple-choice testing and student academic per-formance has been examined with student confidence (Koku & Qureshi, 2004; Swartz, 2006), personal qualities (Burns, 2005), expectations (Balch, 2007), and testing speed (Petti-john & Sacco, 2007).
In marketing education much research has focused on test item order. More specifically, this line of inquiry considers whether test item order influences student performance. His-torically it was believed that items on a multiple-choice exam should be constructed with the easiest items first, followed by medium-level items, with the hardest items appearing at the end of the exam (Ahmann & Glock, 1971; Remmers & Gage, 1943; Ruch, 1929). The rationale being that this decreases test anxiety and therefore increases student perfor-mance (Munz & Smouse, 1968). It also avoided frustration and blocking by weaker students who became discouraged due to their inability to answer the initial harder items suc-cessfully (Thorndike, 1971).
TEST ITEM ORDER 37
Test item order has since been examined in terms of se-quencing items based on test item difficulty. Some previ-ous studies show no significant difference in student per-formance with level of difficulty test item order (Laffite, 1984; Monk & Stallings, 1970; Skinner, 1999). This was the case even when negative credit for incorrect responses to dissuade student guessing was incorporated in the study (Di-Battista, Gosse, Sinnige-Egger, Candale, & Sargeson, 2009). However, a meta-analysis of studies involving test item order based on difficulty level found that students do perform better on exams beginning with easier items than those beginning with harder items or a random order (Aamodt & McShane, 1992).
Other studies confirm this finding where scores on the easy-hard version were higher (Brenner, 1964; MacNicol, 1960). This may be accounted by students’ assumption that the test items will appear in easy-hard order. Expectancy the-ory explains that the anxiety caused by encountering harder items first may compromise exam scores as students do not perceive they have the ability to perform well overall based on the first few items (Vroom, 1964). This is particularly the case when students proceed with the assumption that items later on in the exam will be even more difficult than the harder items presented at the beginning of the exam because they expected the initial items to be relatively easier (Hambleton & Traub, 1974).
Why might students perform better on the hard-easy ver-sion? Helson’s (1930) adaptation level theory may shed some light on this topic as his model proposes that perceptions are relative. He suggested that the degree of a measure only has meaning within its context. In other words a 1-lb apple would be considered very heavy whereas a pumpkin would have to weigh over 20 lbs to be considered rather plump. Apply-ing this concept to test item order, students who encounter the most difficult questions first will perceive the easier ones later on as relatively even easier compared with students who receive the easier questions at the outset. Thus, students who receive the exam with the harder items first may gain con-fidence, or adapt and perform better as a result. In contrast, those who encounter the easier items first may perceive the harder items as relatively even more challenging compared to the items they experienced initially. This would suggest that those who receive the hard-easy version have an advantage over those who receive the easy-hard version.
Thus, conflicting results in previous studies as well as a lack of research regarding introductory marketing courses led to the first hypothesis in the study:
Hypothesis 1: Student performance on multiple-choice
ex-ams in a principles of marketing course would be af-fected by difficulty level test item order.
Differences in student performance should also be con-sidered with other factors besides difficulty level test item order. One such factor is gender. The general performance
gap between men and women entering college has not only narrowed (American College Testing, 2010), women have consistently outperformed men in collegiate academic achievement (Hassmen & Hunt, 1994) and college degree completion (Adebayo, 2008). Even though women gener-ally do better academicgener-ally in college, multiple-choice ex-ams have been historically viewed as favoring male students in terms of academic performance (Bolger & Kellaghan, 1990; Diamond, 1976; Selkow, 1984). Other studies show that any differences noted in multiple-choice exam perfor-mance based on gender have been negligible (Ghorpade & Lackritz, 1998; Klimko, 1984). When specifically consider-ing difficulty level test item order, Plake, Ansorge, Parker, and Lowry (1982) reported a gender-based differential sensitivity where men performed at a higher level than women in the easy-hard exam version. However, men did not outperform women in the easy-hard test item arrangement in a qualitative developmental psychology course (Plake, Melican, Carter, & Shaughnessy, 1983) or in a quantitative mathematics course (Hambleton & Traub, 1974). The results regarding the in-fluence of gender on student performance on various exam versions are not consistent and suggest that results are related to academic discipline. Further, no studies have examined the possible interaction in courses related to business, and mar-keting in particular. This lack of clarity and application in business disciplines led to the second hypothesis:
Hypothesis 2: Student performance on multiple-choice
ex-ams in a principles of marketing course would be af-fected by difficulty level test item order and gender.
Another factor that may influence student performance on various exam versions is academic major. When it comes to field of study, marketing majors are perceived as be-ing weak academically (Davis, Misra, & Van Auken, 2002; Duke, 2002; Remington, Guidry, Budden, & Tanner, 2000). In fact, they have not performed as well as their business-related counterparts when it comes to academic merit or stan-dardized tests scores (Aggarwal, Vaidyanathan, & Rochford, 2007). When specifically considering student performance on multiple-choice exams in a marketing course, as ex-pected marketing majors do perform better than students from other business-related majors (Petit, Baker, & Davis, 1986).
However, no studies have been conducted to date to de-termine whether academic major influences student perfor-mance on various exam versions. This is relevant to instruc-tors who teach introductory courses in a business-related discipline because successful completion of their courses is likely a requirement for graduation by all business ma-jors. This is done to give students a basic understanding of the various functional areas in business. As a result the class comprises students from marketing, management, ac-counting, and finance, or any other business major offered by the institution. Thus, the third hypothesis was designed
to explore the potential connections and fill the gap in the literature:
Hypothesis 3: Student performance on multiple-choice
ex-ams in a principles of marketing course would be af-fected by difficulty level test item order and major.
METHOD
This study was conducted at a small private college in the Midwest. It involved 17 sections of a principles of market-ing course taught by the same instructor over a 3.5-year period. The course is designated as a second year course and is required for every business-related major. Test item or-der was manipulated on three different exams comprising 50 multiple-choice items each. The exams were administered at one third, two thirds, and at the end of the semester. They were mutually exclusive in terms of content and each carried the same weight in the overall point distribution in the course. All test items and level of difficulty designations were taken from the publisher’s test bank provided with the course text-book. The reliability (Cronbach’sα) on all three exams was
moderate to good with .83, .78, and .80 for Exams 1, 2, and 3, respectively. The total points earned on the three exams comprised 50% of the final grade in the course. The other 50% was made up of 12 quizzes, two written case analyses, and two group presentations.
Each exam had three different versions. The first version had 17 harder items first, followed by 16 medium-level items, and finally 17 easier items (hard-easy). The second version included the exact same items, but in reverse order, namely, easy, medium, hard (easy-hard). The third version also in-cluded the exact same items; however, they were presented in random order regardless of difficulty level. Every item had four choices with only one choice as correct. No penalty was assessed for incorrect responses.
Procedure
Consistent with the experimental procedure of Paretta and Chadwick (1975), the test item order version for the first exam was assigned to students by classroom seating columns. Thus, students seated in Columns 1 and 4 received the easy-hard version, those in Columns 2 and 5 the random version, and those in Columns 3 and 6 the hard-easy version. This helped to control for the fact that higher achieving students tend to sit in the first few rows (Benedict & Hoag, 2004; Hol-liman & Anderson, 1986) and thus increased randomization of the process. In fact, the results of an analysis of variance (ANOVA) using cumulative grade point average (GPA) as a dependent variable showed that there was no significant difference between the groups based on initial exam version assignment,F(2, 442)=0.18,p=.83.
The first and last exams covered four chapters each while the second exam covered five chapters. The exams in this study were considered power tests as opposed to speeded tests
in that even though there was a 75-min time limit, all students completed the exam with time to spare. For the second and third exams students were administered the exam versions to which they had not been previously exposed. Thus, every student took three exams and was exposed to each exam version (i.e., hard-easy, easy-hard, random) once throughout the semester. For example, a student who had the random version for Exam 1 took the easy-hard version of Exam 2 and hard-easy version of Exam 3.
Overall, this arrangement ensured that each student re-ceived each exam version one time. This was designed to minimize cheating opportunities in each exam administra-tion. Unintended test item order effects such as warming up, learning, guessing, and fatigue (Zwick, 1991) were also min-imized by this process. Again, any advantage in the course of having a particular exam version was minimized in that every student took one exam of each exam version (i.e., one easy-hard, one hard-easy, and one random). If this was not the case, the tenets of item response theory suggest that some students may have been advantaged over the others merely by the exam version administered to them on that particular day (Hambleton, Swaminathan, & Rogers, 1991; Hohensinn et al., 2008).
Sample
There were 458 students enrolled in the course over the 3.5-year period; however, only the results of 445 students were recorded for the purpose of this study because 13 students withdrew from the course after taking only one or two exams. Gender was rather balanced in this study with 46% women. Most students who took the course were in a business-related major with 39% business administration; 16% accounting; 14% marketing; 11% finance, management, and manage-ment information technology (MIT); and 20% other. Classi-fication was skewed toward more experienced students with 7% freshman, 26% sophomore, 46% junior, and 21% senior.
Measures
Exams 1, 2, and 3 were analyzed separately as each exam contained unique content. Analysis of variance was utilized to test Hypothesis 1 for each exam. Hypotheses 2 and 3 were then analyzed using factorial ANOVA for each exam. This was done to determine if student performance on the exams in the principles of marketing course differed significantly based on the interaction of difficulty level test item order and gender or major. In each case the dependent variable was the average exam score expressed as a percentage for a particular group of students or a particular exam version. Each analysis was conducted at the .05 alpha level.
RESULTS
To address Hypothesis 1 an ANOVA was conducted for each of the three exams to see if there were any differences in
TEST ITEM ORDER 39
TABLE 1
Mean Exam Scores (%), by Exam Number and Test Item Order
Exam 1 Exam 2 Exam 3
Item order n M SD n M SD n M SD
Easy-hard 150 68.69 14.67 150 73.16 12.11 146 74.59 13.81
Hard-easy 146 70.41 13.73 150 72.11 13.03 149 74.26 14.74
Random 149 69.05 14.15 145 71.01 12.19 150 73.97 14.37
Overall 445 69.38 14.18 445 72.10 12.46 445 74.27 14.28
student performance based on difficulty level test item order. Table 1 shows the average percentage of correct responses for each of the three exams based on difficulty level test item order. Although overall student performance increased significantly over time, F(2, 1,332)= 14.33, p < .01, no
significant differences were found based on difficulty level test item order for Exam 1,F(2, 442)=0.60,p=.55; Exam 2,F(2, 442)=1.10,p=.33; or Exam 3,F(2, 442)=0.03,
p=.98. These results provide no support for Hypothesis 1. Factorial analysis of variance was conducted for each exam to address Hypotheses 2 and 3 regarding student per-formance on various exam versions and gender or major. For Exam 1 there was a significant interaction between gender and difficulty test item order in that women (72.8%) scored significantly higher than men (65.8%) on the random ver-sion,F(2, 439)=4.06,p=.02. There was no interaction between gender and difficulty level test item order regarding student performance for Exams 2 or 3. Thus Hypothesis 2 is supported by Exam 1 but not for Exams 2 or 3.
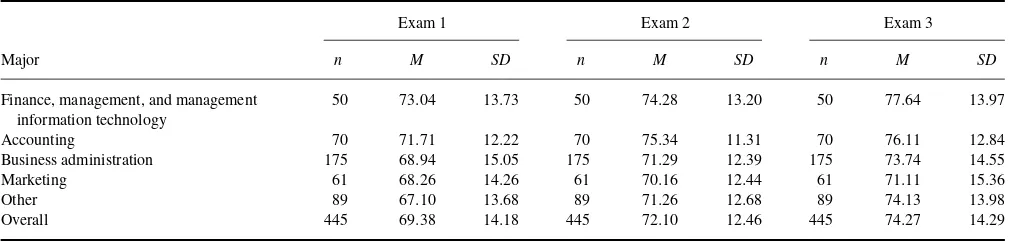
There was no significant difference in student perfmance based on major and level of difficulty test item or-der for each of the three exams. This result show no support for Hypothesis 3 in that there is no significant interaction between major and difficulty level test item order regarding student performance. However, Table 2 shows that finance, management, and MIT majors as well as accounting majors consistently scored the highest on each exam whereas mar-keting majors scored second lowest on Exam 1 and the lowest on Exams 2 and 3.
Given the low performance of marketing majors it was worth investigating if any relationship existed between
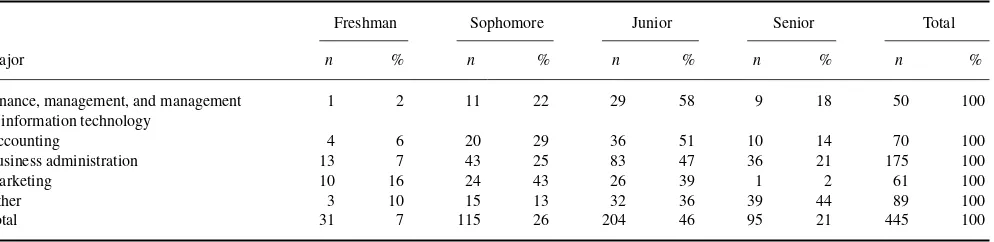
ma-jor and classification. Although a factorial ANOVA demon-strated no interaction effect, the distribution of students based on classification and major is still interesting to note. Table 3 shows that 76% of the finance, management, and MIT majors and 66% of the accounting majors were juniors or seniors whereas 59% of the marketing majors were fresh-men or sophomores and only 2% of the marketing majors were seniors. Regarding the freshmen in this study in partic-ular, 32% were marketing majors whereas only 13% and 2% were accounting or finance, management, and MIT majors respectively.
DISCUSSION
Although students scored the lowest on the random version on all three exams, the differences were not significant. This finding in the principles of marketing course is consistent with previous studies in other courses where no differences in student performance were evident using test item order based on difficulty level (DiBattista et al., 2009; Howe & Baldwin, 1983; Laffite, 1984; Perlini, Lind, & Zumbo, 1998).
No main effects related to gender and student performance were evident. When considering exam version women did not perform any better on any particular version relative to their own scores on any of the three exams. The same was true for men. However, when the interaction of gender and test item order was analyzed, women outperformed men on the random version of Exam 1. Why was there a differential sen-sitivity to exam version based on exam version? Perhaps the women were simply better prepared for the first test. Women
TABLE 2
Mean Exam Scores (%), by Exam Number and Major
Exam 1 Exam 2 Exam 3
Major n M SD n M SD n M SD
Finance, management, and management information technology
50 73.04 13.73 50 74.28 13.20 50 77.64 13.97
Accounting 70 71.71 12.22 70 75.34 11.31 70 76.11 12.84
Business administration 175 68.94 15.05 175 71.29 12.39 175 73.74 14.55
Marketing 61 68.26 14.26 61 70.16 12.44 61 71.11 15.36
Other 89 67.10 13.68 89 71.26 12.68 89 74.13 13.98
Overall 445 69.38 14.18 445 72.10 12.46 445 74.27 14.29
TABLE 3
Student Representation, by Classification and Major Cross Tabulation
Freshman Sophomore Junior Senior Total
Major n % n % n % n % n %
Finance, management, and management information technology
1 2 11 22 29 58 9 18 50 100
Accounting 4 6 20 29 36 51 10 14 70 100
Business administration 13 7 43 25 83 47 36 21 175 100
Marketing 10 16 24 43 26 39 1 2 61 100
Other 3 10 15 13 32 36 39 44 89 100
Total 31 7 115 26 204 46 95 21 445 100
have typically achieved at a higher level in college and such was the case in this study as the 3.120 average cumulative GPA was significantly higher than the 3.008 average cu-mulative GPA for men, t(443) =1.96, p =.05. It is also possible that men compensated on Exam 2 and 3 with better preparation or the effects of maturation and learning con-founded interactions that might otherwise be evident.
Although no significant differences in student perfor-mance were noted regarding the interaction of difficulty level test item order and academic major, marketing majors con-sistently scored below the overall student average. In this study, a disproportionate percentage of freshmen students were marketing majors (32%) compared with finance, man-agement, and MIT majors (3%) or accounting majors (13%). At the same time, only 1% of the seniors and 12% of the juniors were marketing majors. This is not unusual, as stu-dents who will major in marketing tend to take the principles of marketing course early in their academic experience as a prerequisite to all other marketing courses whereas stu-dents from other business majors simply need to complete the principles of marketing course by graduation.
With a lack of representation of marketing majors as up-per classmen, it seems plausible that their under up-performance is more likely related to lack of academic experience and not academic major. However, it very well could also be reflective of the overall low achievement of students choos-ing to study marketchoos-ing compared to other business majors as demonstrated by low ACT and Scholastic Aptitude Test (SAT) scores. This carries forward after graduation with mar-keting majors earning the lowest average Graduate Manage-ment Admission Test (GMAT) scores compared with stu-dents from other business disciplines (Aggarwal et al., 2007). The effect of maturation and testing was also evident in this study. Students scored significantly higher on Exam 3 than Exam 2 as well as higher on Exam 2 than Exam 1. Test-ing could be a contributTest-ing factor as well as students became more familiar with the exam format and the kind of items they encounter. Perhaps these confounding variables over-rode any potential effect related to gender and difficulty level test item order that was only evident on Exam 1. Students will not always face problems in like fashion where they can
utilize previous experiences to solve challenging situations in the present.
With the exception of the first exam administration where women may benefit over men from the random version, no group of students is advantaged to a great degree by any particular exam version. Therefore, using test items based on difficulty level in random order appears to be fair to students from a variety of business majors while offering confidence to instructors that cheating will be dissuaded. Further, the random version may actually assist students in developing skills in independent decision making.
Implications
A common way to discourage students from cheating while taking multiple-choice exams is to make more than one ver-sion of the exam so students cannot simply copy the re-sponses of a neighboring student. Based on the results of this study, randomizing the test item difficulty level in a princi-ple of marketing course does not disadvantage any particular student based on gender or major. Thus, instructors who teach an introductory marketing course with students en-rolled from a variety of majors can prepare randomized ver-sions of multiple-choice exams knowing that while cheating will be deterred, all students are treated fairly in the pro-cess. This is contrary to the previously held notion that men outperform women on the easy-hard version.
Limitations and Directions for Future Research
Instructors should consider the setting of this study in making application to other venues as is the case with any study limited to one institution and multiple sections of one course. Consideration should also be given to major as most students in this study were enrolled in a business-related area of study. Although the design of the study ensured that each student received one of each exam version throughout the semester, maturation or testing could still be considered limitations as students tend to increase their performance in repeated test settings regardless of other factors.
Future research could parallel studies regarding the influ-ence of student expectations on academic performance. For
TEST ITEM ORDER 41
example, Balch’s (2007) exploratory work found that stu-dents who anticipated a short-answer test performed better on a multiple-choice exam than students who did not have the same expectation. This could be applied to multiple-choice exam test item difficulty level. Perhaps students who expect more difficult items may perform better regardless of the ac-tual item difficulty level due to their method of preparation. Thus altering the preparation process may be promising for improving student performance and learning.
Another line of inquiry could further explore the reli-ability of the stated publisher-supplied test bank difficulty level ratings. This could examine whether hard items are perceived by students as being more difficult and whether their actual performance is in line with the publisher’s stated rating. By adding more than the typical three levels, namely hard, medium, and easy, to perhaps five or six levels would enhance an instructor’s ability to distinguish not only which students have an understanding of the course content, but also their level of such understanding compared with other students in the course.
REFERENCES
Aamodt, M. G., & McShane, T. (1992). A meta-analytic investigation of the effect of various test item characteristics on test scores and test completion times.Public Personnel Management,21, 151–160.
Adebayo, B. (2008). Gender gaps in college enrollment and degree at-tainment: An exploratory analysis.College Student Journal,42, 232– 237.
Aggarwal, P., Vaidyanathan, R., & Rochford, L. (2007). The wretched refuse of a teeming shore? A critical examination of the quality of undergraduate marketing students.Journal of Marketing Education,29, 223–233. Ahmann, J. S., & Glock, M. D. (1971).Measuring and evaluating
educa-tional achievement. Boston, MA: Allyn & Bacon.
American College Testing. (2010).ACT profile report: National graduating class 2010. Iowa City, IA: Author.
Bacon, D. R. (2003). Assessing learning outcomes: A comparison of multi-ple choice and short-answer questions in a marketing context.Journal of Marketing Education,25, 31–26.
Balch, W. R. (2007). Effects of test expectation on multiple choice perfor-mance and subjective ratings.Teaching of Psychology,34, 219–224. Becker, W. E., & Johnston, C. (1999). The relationship between multiple
choice and essay response questions in assessing economics understand-ing.Economic Record,75, 348–357.
Benedict, M. E., & Hoag, J. (2004). Seating location in large lectures: Are seating preferences or location related to course performance?Journal of Economic Education,35, 215–231.
Bolger, N., & Kellaghan, T. (1990). Method of measurement and gender dif-ferences in scholastic achievement.Journal of Educational Measurement,
27, 165–174.
Brenner, M. H. (1964). Test difficulty, reliability, and discrimination as functions of item difficulty order.Journal of Applied Psychology,48, 98–100.
Burns, D. J. (2005). Performance on the final exam in the Principles of Marketing course: Relationship with self-handicapping.Journal for Ad-vancement of Marketing Education,6, 10–27.
Canlar, M., & Jackson, W. K. (1991). Alternative test question sequencing in Introductory Financial Accounting.Journal of Education for Business,
67, 116–119.
Davis, R., Misra, S., & Van Auken, S. (2002). A gap analysis approach to marketing curriculum assessment: A study of skills and knowledge.
Journal of Marketing Education,24, 218–224.
Diamond, E. E. (1976). Minimizing sex bias in testing.Measurement and Evaluation in Guidance,9, 28–34.
DiBattista, D., Gosse, L., Sinnige-Egger, J., Candale, B., & Sargeson, K. (2009). Grading scheme, test difficulty, and the immediate feedback assessment technique. The Journal of Experimental Education, 77, 311–336.
Duke, C. R. (2002). Learning outcomes: Comparing student perceptions of skill level and importance.Journal of Marketing Education,24, 203–217. Ghorpade, J., & Lackritz, J. R. (1998). Equal opportunity in the classroom: Test construction in a diversity-sensitive environment.Journal of Man-agement Education,22, 452–471.
Hambleton, R. K., Swaminathan, H., & Rogers, H. J. (1991).Fundamental of item response theory. Newbury Park, CA: Sage.
Hambleton, R. K., & Traub, R. E. (1974). The effects of item order on test performance and stress.Journal of Experimental Education,43, 40–46. Hassmen, P., & Hunt, P. (1994). Human self-assessment in multiple choice
testing.Journal of Educational Measurement,31, 149–160.
Heck, J. L., & Stout, D. E. (1991). Initial empirical evidence on the relation-ship between finance test-question sequencing and student performance scores.Journal of Applied Finance,1, 41–47.
Helson, H. (1930). The nature and problem of perception. In R. H. Wheeler (Ed.),Readings in psychology(pp. 389–410). New York, NY: Crowell. Hohensinn, C., Kubinger, K. D., Reif, M., Holocher-Ertl, S., Khorramdel,
L., & Frebort, M. (2008). Examining item-position effects in large-scale assessment using the Linear Logistic Test Model.Psychology Science Quarterly,50, 391–402.
Holliman, W. B., & Anderson, H. N. (1986). Proximity and student density as ecological variables in a college classroom.Teaching of Psychology,
13, 200–203.
Howe, K. R., & Baldwin, B. A. (1983). The effects of evaluative sequencing on performance, behavior, and attitudes.The Accounting Review, 58, 135–142.
Klimko, I. P. (1984). Item arrangement, cognitive entry characteristics, sex, and test anxiety as predictors of achievement examination performance.
Journal of Experimental Education,52, 214–219.
Koku, P. S., & Qureshi, A. A. (2004). Overconfidence and the performance of business students on examinations.Journal of Education for Business,
79, 217–224.
Laffitte, R. G. Jr. (1984). Effect of item order on achievement test scores and students’ perception of test difficulty.Teaching of Psychology,11, 212–213.
MacNicol, K. (1960). Effects of varying order of test item difficulty in an unspeeded verbal test. Unpublished manuscript, Educational Testing Service, Princeton, NJ.
Monk, J. J., & Stallings, W. M. (1970). Effects of item order on test scores.
Journal of Educational Research,63, 463–465.
Munz, D. C., & Smouse, A. D. (1968). Interaction effects of item-difficulty sequence and achievement-anxiety reaction on academic performance.
Journal of Educational Psychology,59, 370–374.
Paretta, T. L., & Chadwick, L. W. (1975). The sequencing of examination questions and its effects on student performance.The Accounting Review,
50, 595–601.
Perlini, A. H., Lind, D. L., & Zumbo, B. D. (1998). Context effects on ex-aminations: The effects of time, item order and item difficulty.Canadian Psychology,39, 299–307.
Petit, K. L., Baker, K. D., & Davis, L. D. (1986). Unconscious biasing of stu-dent examination scores: A case of sequential versus random information retrieval.Journal of Marketing Education,8(2), 20–24.
Pettijohn, T. F., & Sacco, M. F. (2007). Multiple choice exam question order influences on student performance, completion time, and perceptions.
Journal of Instructional Psychology,34, 142–149.
Plake, B. S., Ansorge, C. J., Parker, C. S., & Lowry, S. R. (1982). Ef-fects of item arrangement, knowledge of arrangement, test anxiety, and
sex on test performance.Journal of Educational Measurement,19, 49– 57.
Plake, B. S., Melican, G. J., Carter, L., & Shaughnessy, M. (1983). Differen-tial performance of males and females on easy to hard item arrangements: Influence of feedback at the item level.Educational and Psychological Measurement,43, 1067–1075.
Remington, S. Guidry, J. A., Budden, M. C., & Tanner, J. R. (2000). When were the good old days? Revisiting perceptions of marketing students’ prior preparation.Journal of Marketing Education,22, 188–198. Remmers, H. H., & Gage, N. L. (1943). Educational measurement and
evaluation. New York, NY: Harper.
Ruch, G. M. (1929).The objective or new-type examination. New York, NY: Scott Foresman.
Selkow, P. (1984).Assessing sex bias in tests. Westport, CT: Greenwood. Skinner, N. F. (1999). When the going gets tough, the tough get going:
Effects of order of item difficulty on multiple choice test performance.
The North American Journal of Psychology,1, 79–82.
Swartz, S. M. (2006). Acceptance and accuracy of multiple choice, confidence-level, and essay question formats for graduate students. Jour-nal of Education for Business,81, 215–220.
Thorndike, R. L. (1971).Educational measurement. Washington, DC: Amer-ican Council on Education.
Vroom, V. H. (1964).Work and motivation. New York, NY: Wiley. Zwick, R. (1991). Effects of test item order and context on estimation of
NAEP reading proficiency.Educational Measurement: Issues and Prac-tice,10(3), 10–16.