54 ISSN: 2052-6393(Print), ISSN: 2052-6407(Online)
STOCK INVESTMENT ANALYSIS: CASE IN INDONESIA STOCK
EXCHANGE (IDX)
Moh Benny Alexandri Universitas Padjadjaran
Nita Jelita
ABSTRACT: This study show the growing interest of investors to invest in Indonesia's capital market as emerging market. Before investing, it was very important for investor to consider the risk and rate of return factors. One method used to analyze the relationship between return and risk in stock investment is the Capital Asset Pricing Model (CAPM). This study aims to analyze the CAPM method to describe the risk and stock returns, and investment options to determine the best stock in the pharmaceutical company that listed in the Indonesian Stock Exchange (IDX) period 1/1/2009-31/12/2012.The study used 8 samples of pharmaceutical companies listed in the Indonesian Stock Exchange (IDX) period 1/1/2009-31/12/2012. The sample selection was purposive sampling technique with some criteria of research necessity. Results showed there were 5 pharmaceutical companies listed in Indonesian Stock Exchange (IDX) has a beta greater than 1 (β> 1) with the highest expected rate of return, and 3 pharmaceutical company has a beta less than 1 (β < 1) with the lowest expected rate of return . Furthermore, the results of the analysis of stock investment decisions that used the Capital Asset Pricing Model (CAPM) were 7 companies from 8 companies were classified as undervalued stocks, it was recommended to buy the stock, and 1 company classified as overvalued, it was recommended to sell the stock.
KEYWORDS: CAPM, return, beta, stock investment decision
INTRODUCTION
55 ISSN: 2052-6393(Print), ISSN: 2052-6407(Online)
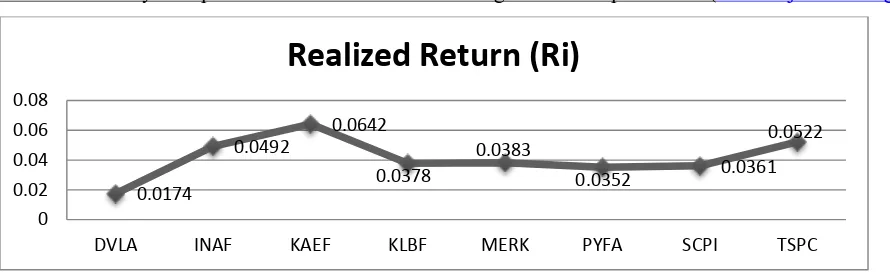
Figure A. Realized Return of Pharmaceutical Companies Listed Period 1/1/2009-31/12/2012
There –were 9 companies’ shows a positive realized return. Realization of a positive return indicates the increase of the stock price was greater than it decrease, so it will be beneficial for investors. Invest in pharmaceutical companies will provide lower risk compared with a commercial company , it is because of advances in technology , medical equipment business , medicine , and hospitals is growing rapidly in Indonesia , this condition will be a major consideration for potential investors to make decisions investments in pharmaceutical companies .
The investment decision is an individual decision and it depends on potential investor’s decision as a free person. Purchase of stocks is based on the original purpose of investment activity which is to obtain the return. Before making an investment decision, rational investors will choose to invest in a portfolio which is the most efficient in all existing portfolios. Rational investors will choose the efficient portfolio that are formed by optimizing the portfolio by one of two reasons, the expected return or risk portfolio .An investor should be able to calculate the risk factors or uncertainties factors and can determine the expected rate of return. Assessment efficient portfolio viewed from the position of the stock. They are overvalued or undervalued. If the rate of return of realized return greater than expected return, the stock is undervalued or eligible to be purchased. Whereas, if the realized rate of return smaller than the expected returns, the stock is overvalued or ready to be sold.
This study aimed to analyze the Capital Asset Pricing Model (CAPM) methods in describing the risk and the rate of return of pharmaceutical companies stocks in Indonesia Stock Exchange (IDX) and to analyze the best stock investment options on pharmaceutical companies in Indonesia Stock Exchange (IDX) as an emerging market.The reminder of the study is organized as follows. Section II discusses the literature review. Section III outlines the methodology. Section IV contains the results/ findings. Section V contains discussion, Section VI concludes with some implications to research and practice, Section VII provides
a conclusion to this
study
and finally section VIII future research.
LITERATURE REVIEWS
Capital Asset Pricing Model
Capital Assets Pricing Model (CAPM) was first introduced by Sharpe, Lintner and Mossin in the mid-1960s . CAPM is a model that links the expected rate of return on a risky asset with
0.0174
DVLA INAF KAEF KLBF MERK PYFA SCPI TSPC
56 ISSN: 2052-6393(Print), ISSN: 2052-6407(Online)
the risk of the asset in a balanced market conditions (Tandelilin , 2010: 187) . CAPM is based on portfolio theory that proposed by Markowitz. Based on the Markowitz model, each investor is assumed diversify on their portfolio and selecting the optimal portfolio by preferences of investors for risk and return which located along the line of efficient portfolios. Besides those assumption, there are several others in the CAPM assumptions which are made to simplify the existing realities, such as:
:
a. All investors have an identical level of probability distribution of future returns, because they have hope or expectation that almost the same . All investors are using resources such as rate of return , the variance of return , and the same correlation matrix in relation to the establishment of an efficient portfolio .
b) All investors have the same time period. .
c) All investors can borrow or loan money at the risk-free rate of return. . d) There are no transaction costs .
e) There is no income tax f) There is no inflation .
g) There are a lot of investors , and no single investor can affect the price of a security. All investors are price - takers .
h) The market is in a state of balance .
Equilibrium Trade - Off between Risk and Return
According Jogiyanto (2010 : 492) , the CAPM is the equilibrium model that includes two important relationships , they are:
a) Capital Market Line (CML).
Market equilibrium concerning on the risk and expectations return and the risk can be described by the capital market line (CML). Capital Market Line (CML) is a line that shows all of the possible combinations of efficient portfolio which consist of risky assets and risk-free assets .
According Jogiyanto (2010 : 492) , the CAPM is the equilibrium model that includes two important relationships , they are :
a) Capital Market Line (CML)
Some things to note for CML are as follows:
1. CML only consist of efficient portfolio that contains the risk-free assets , the market portfolio or portfolios combination of both.
2. If the market portfolio containing only assets are not at risk , then the risk will be
equal to zero ( σp = 0 ) and return the same expectations with RBR .
3. If the portfolio consists of all existing assets , then the risk is for σM with return expectations of E ( RM ) .
4. Return expectations for the portfolio of risky assets , namely E ( RM ) is greater than the expected return portfolios with risky assets ( RBR ) .
5. The difference between the two returns of [ E ( RM ) - RBR ] is a premium on the
market portfolio as at greater risk , the amount of σM .
57 ISSN: 2052-6393(Print), ISSN: 2052-6407(Online)
7. Due to the assumption of market equilibrium then the CML should have a positive slope increases or in other words E ( RM ) must be greater than RBR . This makes sense because the smallest risk is zero ( risk-free ) and there is no risk of a negative . Negative slope occurs for historical returns , but it does not mean its validity is reduced only shows that historical returns / different realization of the return expectations .
b) Security Market Line (SML).
Security Market Line (SML) shows the tradeoff between risk and return expectations for individual securities as a graphic depiction of the CAPM model . In contrast with CML who describe the tradeoff between risk and return expectations for efficient portfolio, but not individual securities .For a portfolio, the expected additional return occurs because due to the additional risk of the portfolio in question . Individual securities for the expected additional return attributable to the additional risk of individual securities as measured by beta . Beta determine the magnitude of the expected additional return for individual securities with the argument that in order to diversify the portfolio in perfect then no systematic risk tends to be lost and the relevant risks only systematic risk as measured by beta . This argument is based on the assumption that for the expected homogeneous, all investors will form a diversified portfolio in the market perfectly, so that the relevant risks for each of the securities in the portfolio is the beta .
Beta for the market portfolio is worth 1. A securities that has beta < 1 mean risk is smaller than the risk of the market portfolio. Instead of a security that has a beta value of > 1 is said to have a larger systematic risk than market risk. If a security has a beta equal to the market portfolio beta or equal to 1 , it is expected to receive a greater return expectations compared with the expected return of the market portfolio or E (RM) . The expected return and beta relationship can be described in the securities market line (SML).
E(Ri) = RBR+ βi . [E(RM)-RBR]
Simple equation is called the Capital Asset Pricing Model ( CAPM ) . With this equation , then the expected return of a portfolio or an individual securities can be determined .
To establish a SML equation , investors have to estimate three variables , they are : the risk-free rate of return , rate of return expectations by the market (represented by the market index) , and the amount of beta by the respective securities . Generally estimated using the risk-free return the data return bonds issued by the government , for example, be used to Indonesian Bank Indonesia Certificates (BIrate) . While the general market return estimated using market index data , such as the Indonesia Composite Index ( ICI ) and LQ 45.
a) whether the stock is undervalued or overvalued condition , used hypotheses :
b) a) Ri < E ( Ri ) , the stock is considered overvalued (the price is too high) , the investment decision should be taken by investors are selling stocks .
58 ISSN: 2052-6393(Print), ISSN: 2052-6407(Online)
RESULTS/FINDINGS
Realized return is the return that has occurred. Realized return can be calculated using historical data. Realized return is important because it is used as one measure of the performance of the company and as a basis for determining the (expected return) and risk in the future. Realized return can be calculated using the following formula:
Ri = ��− ��−1
��−1
Value Pt is a closing stock price for month t , while P(t - 1) is the closing price of the stock prior
for month t. Both of the data is obtained from the Indonesia Stock Exchange (JXS) website.
The following table is the result of the calculation of individual realized stock returns all companies in the research samples.
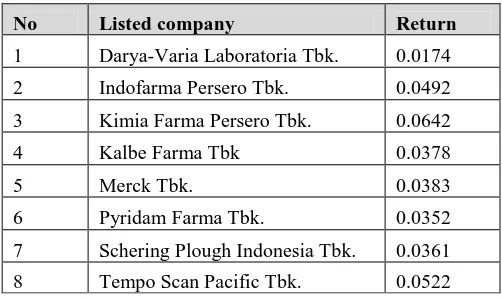
Table A. Realized Rate of Return All Pharmaceutical Companies Period 1/1/2009 – 31/12/2012
No Listed company Return
1 Darya-Varia Laboratoria Tbk. 0.0174
2 Indofarma Persero Tbk. 0.0492
3 Kimia Farma Persero Tbk. 0.0642
4 Kalbe Farma Tbk 0.0378
5 Merck Tbk. 0.0383
6 Pyridam Farma Tbk. 0.0352
7 Schering Plough Indonesia Tbk. 0.0361
8 Tempo Scan Pacific Tbk. 0.0522
Overall of rate of realized return entire pharmaceutical companies were positive, this indicates that the stock price increase was greater than the decline, so it will be beneficial for investors. In other words, shares of pharmaceutical company can be an option to invest
Calculation of the market return in this study using market index data is Composite Stock Price Index (CSPI) during the observation period were obtained from reports Indonesia Stock Exchange (IDX) . Composite stock price index is the sum of all shares listed on the exchange . The market return can be calculated using the following formula :
� = � ��� ���− � ���−1
�−1
CSPIt value is a market index for month t , while the CSPI (t - 1) is a market index before month
t.
The average level of market return during the period of observation was equal to 0.0264 with the distribution of the observation time (48 months).
59 ISSN: 2052-6393(Print), ISSN: 2052-6407(Online)
exceeded the highest level of market return of the entire observation period . The highest level of market return during the observation period occurred in April 2009 , which is equal to 0.2013 . In April 2009 showed that trading on the stock exchange is very active , fast moving , and general market conditions dominated by the purchaser , causing stock prices to rise. Meanwhile , the market return rate was lowest in the month of May 2012 is equal to 0.0832
In May 2012 showed that trade on the stock exchange transactions was sluggish, slow moving , and the condition of the market was dominated by the seller , so it causing stock prices rise. Based on the calculation of the level of market return and the risk-free rate of return , it can be seen that in the period 1/1/2009 – 31/12/2012 market return was greater than the risk-free rate of return (0.0264 > 0.0054) . It shows that the share of investment performance was good .Generally estimated return for the risk-free asset return was the data return of bonds issued by the government, for example, Central Bank of Indonesia Certificate (BI rate).BI Rate, in January 2009, was at the highest level, that was equal to 0.0875 . This indicates that if an investor bought the BI Rate with 8.75 % interest rate , it was certain that at the time the BI Rate maturity , the investor will receive a return for 8.75 % .Meanwhile, the lowest level of the BI Rate was in February to December 2012, that was equal to 0.0575 . It mean SBI rate during this period provide a low return . BI rate level was in average rate during 2009-2012 was 0.0650 . While the magnitude of the risk-free asset return was 0.0054 . Return of the risk-free asset was obtained by dividing the average value of BI rate by the number of months in a year , so that the result risk-free rate of return of assets , was RBR 0.0650 / 12 = 0.0054 .
Risk-free asset return value is less than the market return value , this suggests that investors will obtain a greater rate of return when investing in stocks compared to invest in BI Rate, because the company's shares have a greater risk than BI Rate did not have to return the resulting risk of the stock would be greater .
DISCUSSION
Systematic Risk Calculation ( Beta ) Each Individual Stocks.
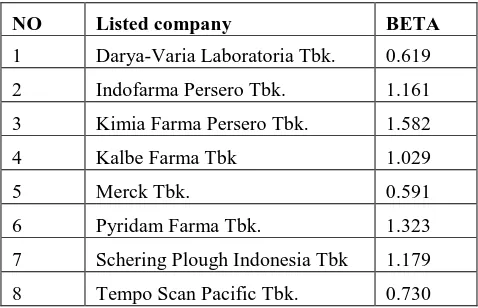
The following table is the result of the entire company stock beta calculation.
Table B Beta Stocks All Pharmaceutical Companies In IDX The period 1/1/ 2009- 31/12/2012
NO Listed company BETA
1 Darya-Varia Laboratoria Tbk. 0.619
2 Indofarma Persero Tbk. 1.161
3 Kimia Farma Persero Tbk. 1.582
4 Kalbe Farma Tbk 1.029
5 Merck Tbk. 0.591
6 Pyridam Farma Tbk. 1.323
7 Schering Plough Indonesia Tbk 1.179
8 Tempo Scan Pacific Tbk. 0.730
Ri is the value of i-the stock returns , value of RBR returns was a risk-free asset represented by
60 ISSN: 2052-6393(Print), ISSN: 2052-6407(Online)
the value of βi is beta securities .Based on this formula , it can be calculated the expected rate
of return of all the pharmaceutical shares company into the study variables as follows :
Table C
Return of expected CAPM All Pharmaceutical Company on the Stock Exchange (Period 1/1/2009- 31/12/2012)
NO Listed company RF RM BETA E(RI)
1 Darya-Varia Laboratoria Tbk. 0.0054 0.0264 0.62 0.0184
2 Indofarma Persero Tbk. 0.0054 0.0264 1.16 0.0298
3 Kimia Farma Persero Tbk. 0.0054 0.0264 1.58 0.0386
4 Kalbe Farma Tbk 0.0054 0.0264 1.03 0.0270
5 Merck Tbk 0.0054 0.0264 0.59 0.0178
6 Pyridam Farma Tbk. 0.0054 0.0264 1.32 0.0332
7 Schering Plough Indonesia Tbk. 0.0054 0.0264 1.18 0.0302
8 Tempo Scan Pacific Tbk. 0.0054 0.0264 0.73 0.0207
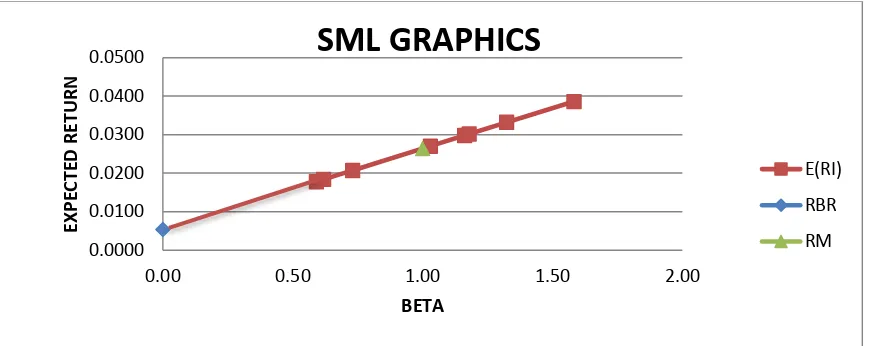
Overall from the table it can be seen that the higher the beta, the higher the return that would be obtained by investors. In other words, systematic risk (beta) is directly proportional to the expected return of the stock of the company. Security Market Line (SML) is a line that connects the level of expected returns of securities with systematic risk (beta) . SML is used to assess individual securities in a balanced market conditions, which assesses the level of expected return of an individual securities at a certain level of systematic risk. SML will describe the best stock options that can be taken into consideration for investors in making investment decisions. Stocks which above the line SML is thinking about the expected returns and the largest beta, so this is the preferred shares to selected investors. While stocks were under SML is the expected return and the stock with the smallest beta, so investors need to consider returning to invest in shares of this company.The depiction of the relationship between the beta value with the expected rate of 8 companies sample are presented in the figure below :
61 ISSN: 2052-6393(Print), ISSN: 2052-6407(Online)
IMPLICATION TO RESEARCH AND PRACTICE
The relationship between return and risk were relationships are unidirectional and linear . That was, the greater the risk of an asset, the greater the expected returns on those assets , and vice versa . When we perform an empirical test of the CAPM then some hypotheses can be formulated. First, that the higher the risk (beta) the higher level of benefits. Second, that the rate of profit has a linear relationship with the beta. This translates to an increase in beta with the same unit, the same level of profit occurs.
Table E The order of level of Beta and Expected Return Pharmaceutical Company Shares for period 1/1/2009- 31/12/2012
Listed companies BETA E(RI)
Kimia Farma Persero Tbk. 1.58 0.0386
Pyridam Farma Tbk. 1.32 0.0332
Schering Plough Indonesia Tbk. 1.18 0.0302
Indofarma Persero Tbk. 1.16 0.0298
Kalbe Farma Tbk 1.03 0.0270
Tempo Scan Pacific Tbk. 0.73 0.0207
Darya-Varia Laboratoria Tbk. 0.62 0.0184
Merck Tbk 0.59 0.0178
The best stocks in the pharmaceutical sub-sector will be very profitable for investors. Performance pharmaceutical subsector has a significant growth in the year 2013 . National pharmaceutical industry market is expected to grow for 17 % this year . The growth was much higher than the pharmaceutical industry market last year. It rose only 11-12 % . Indonesian pharmaceutical industry market growth was still higher than other South East Asia countries. By using data such as financial reports, stock prices and stock expected returns on calculations using the CAPM method, the authors will compare shares of pharmaceutical companies so that investors can decide the best stock investments.
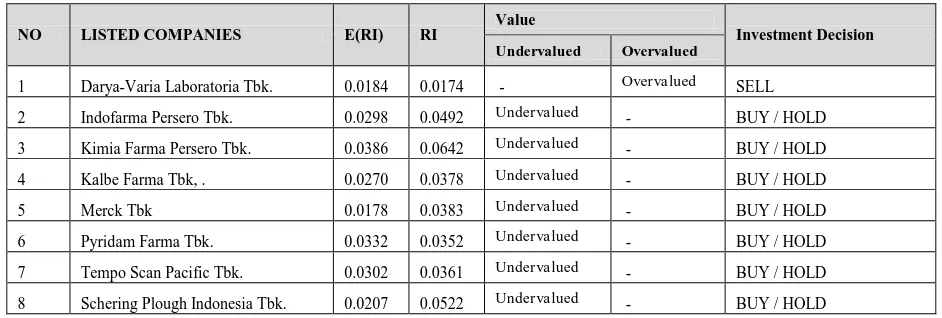
Table F. Classification Of Undervalued / Overvalued And Stock Investment Decisions
NO LISTED COMPANIES E(RI) RI
Value
Investment Decision
Undervalued Overvalued
1 Darya-Varia Laboratoria Tbk. 0.0184 0.0174 - Overvalued SELL
2 Indofarma Persero Tbk. 0.0298 0.0492 Undervalued - BUY / HOLD
3 Kimia Farma Persero Tbk. 0.0386 0.0642 Undervalued - BUY / HOLD
4 Kalbe Farma Tbk, . 0.0270 0.0378 Undervalued - BUY / HOLD
5 Merck Tbk 0.0178 0.0383 Undervalued - BUY / HOLD
6 Pyridam Farma Tbk. 0.0332 0.0352 Undervalued - BUY / HOLD
7 Tempo Scan Pacific Tbk. 0.0302 0.0361 Undervalued - BUY / HOLD
62 ISSN: 2052-6393(Print), ISSN: 2052-6407(Online)
Shares of undervalued companies were Indofarma Persero Tbk , Kimia Farma Tbk Persero , Kalbe Farma Tbk , Merck Tbk , Tempo Scan Pacific Tbk , Pyridam Farma Tbk , and Schering Plough Indonesia Tbk . Seventh pharmaceutical company that has a return value realisasian (Ri) which was greater than the expected return (E(Ri)) . Instead , the company's stock Darya -
Varia Laboratoria Tbk was relatively overvalued by the recommendation to sell shares . The company's stock has a realized return value (Ri) which was smaller than the expected return
(E(Ri)) .
CONCLUSIONS
Pharmaceutical companies with the highest level of the expected return was the Kimia Farma
Tbk Limited , was 0.0386 with the level of risk (β) was 1582 which was the highest risk level
of highest among eight companies. For investors who have the characteristics of risk averse would definitely choose the investment in the shares of the company. Kimia Farma Tbk Persero as it has the expected highest return despite having the highest systematic risk , because investors with these characteristics like high level of risk with high return rate anyway . Fourth shares of other companies were Pyridam Farma Tbk . , Schering Plough Indonesia Tbk , Indofarma Persero Tbk , and Kalbe Farma Tbk also has a beta value greater than 1 , which means that the company's stock was expected will get the expected return which greater than the expected return of the market .This indicates that the company's fourth stock was very good to be used as an investment option because the stock is quite aggressive to market changes.
1. While that has the lowest level of the expected return was Merck Tbk , amount 0.0178
with the level of risk ( β ) 0.0591 which was the lowest level of the lowest risk among eight
companies. Investors who tend to avoid risk may invest in company stock Merck Tbk has low risk level . Tempo Scan Pacific Tbk . and Darya - Varia Laboratoria Tbk . has a beta value less than 1 , which means that the company's stock was expected will get the expected return wass smaller than the expected market return . This indicates that the company's fourth stock was also less attractive to be used as an investment option because it is classified as a defensive stock to market changes .Both points above prove that the theory of relationship retun and risk a linear relationship, and the higher the risk of a stock, the higher the return that would be obtained by investors.
2. Based on the above results , stock investment decisions using SML graphic depiction in the previous explanation recommendation 5 best stocks to be used as an investment option which as Kimia Farma Tbk Persero of 0.0386 , 0.0332 Tbk.sebesar Pyridam Farma , Pyridam Farma Tbk of 0.0302 , Indofarma Persero Tbk amounted to 0.0298 , and Kalbe Farma Tbk Persero of 0.0270 . Fifth stocks based depiction SML also includes the shares belonging to the category undevalued best because it has the value [Ri > E (Ri)] .
FUTURE RESEARCH
63 ISSN: 2052-6393(Print), ISSN: 2052-6407(Online)
REFERENCES
Azmi, R (2006) “Mutual Funds Performance: Does Gender Matter in an Emerging Market” D.A.I. Dayaratne , D.G Dharmaratne , SA Haris . (2005). Measuring the Risk and Performance
in Plantation Sector Based CAPM Using Jensen 's Alpha . Journal of Finance and Accounting University of Sabaragamuwa Belihuloya .
Eduardus Tandelilin . (2010). Portfolio and Investment Theory and Applications . Yogyakarta: Canisius .
Elton, E.J. and Gruber,M (2003) Modern Portfolio Theory and Investment Analysis, 6th Edition, John Wiley & Son,Inc.
H.M , Jogiyanto . (2003). Portfolio Theory and Investment Analysis , Second Edition . BPFE - UGM .
Sharpe, William (1964), “ Capital Asset Prices : A Theory of Market Equilibrium under