http://dx.doi.org/10.17503/Agrivita-2012-34-3-p278-285
SELECTION IN YIELD OF WHEAT (
Triticum aestivum L.
) LINES
IN MIDDLE LAND AND UPLAND
Izmi Yulianah*), Catur Suciari Kurnia, Niken Kendarini, and Sumeru Ashari
1)
Department of Agronomy Faculty of Agriculture University of Brawijaya Jl. Veteran Malang 65145 East Java Indonesia
*) Corresponding author Phone : +62-341-570471 E-mail: [email protected]
Received: June 12, 2012/ Accepted: September 19, 2012
ABSTRACT
Development of wheat can be carried out by cultivating wheat which is able to adapt well and has high productivity in Indonesia. The research was conducted in middle latitude and upland located in Dadaprejo and Cangar with the altitude of 560 m and 1650 m above sea level respectively from May to December 2011. The materials used in this research comprised thirteen wheat lines and two treated varieties. The experiment conducted in each location was arranged using randomly blocked design repeated three times. The data obtained in each location were analysed with variant analysis which was then followed by advanced experiment using 5% LSD. The result showed that six wheat lines were able to adapt and produced higher yields than Selayar varieties in the upland, namely 38, 82, G-17, G-20, H-14, H-19 and in the middle land obtained three lines that is line 82 , G-17 and H-19. Difference of yield decreases between upland and middle land is processed food products such as instant noodles, cake and so forth. High carbohydrates and protein are mostly found in wheat flour instead of other kinds. In Indonesia, wheat plays an important role,
for almost all processed food products are consumed in daily basis. Interestingly, the con-sumption of instant noodles far outweighs that of other processed food products made of corn and cassava.
The increase of wheat consumption has impact on the import of wheat. Flour consumption, for example, grew from 9.9 kg per capita in 2002 to 17.11 kg per capita in 2007 which was around 12% of food consumption in Indonesia. Moreover, the import of wheat seeds reached 5.85 million tons equal to 4.3 million tons of flour consumption. It is predicted that the wheat consumption will keep increasing 6% per annum in Indonesia (Aptindo, 20011), and this will significantly affect the foreign exchange of the country.
To reduce such a dependency of wheat production on other countries, the development in wheat requires continual action. Breeding pro-gramme on wheat can also be proposed to obtain well-adapting varieties with high productivity.
Climatic factors determining the growth and production are rainfall, temperature and humidity (Azwar,1987; Bahar et al., 1988 and Ismal, 1984). High temperature is able to reduce the plant age and other output components such as the number of leaf, plant height, productive seedling and can decrease when the temperature is over 35ºC. Moreover, it causes the plant to die when the temperature reaches over 40ºC.
To grow, wheat requires at least 2°C to 4°C, optimum temperature from 15°C to 25°C, and at most around 37°C. Meanwhile, seed germi-nation requires relatively low temperature and high humidity, for the pathogenic fungi are inactive in such temperature. Seed germination requires air temperature of 12oC to 16oC, while more seedling roots grow from 12oC to 16oC in soil temperature. At 28oC to 32oC, roots are formed before plumula, and, on the other way around, plumula emerges before the roots at 28oC to 32oC.
Wheat cultivation in Indonesia requires varieties which are able to adapt well in tropical regions that the wheat can produce high yields followed by appropriate cultivation techniques (Bahar and Kaher, 1989). Middle lands and up-lands have become the target for wheat cultivation in Indonesia. Several research show that the potential yield of wheat in upland such as Malino (1350 m asl) can achieve 3-5 t.ha-1 (Hamdani et al., 2002), in Tosari (1850 m asl) potential yield reached 6,5 t.ha-1 (Pabendon et al., 2010). In middle land in the Urut Sewu Boyolali (675 m asl) the yield of wheat reached 0,71-2,34 t.ha-1 . In Dau and Tumpang (Malang) (600 m asl) the yield reached 1,52 t.ha-1 and 1,89 t.ha-1 (Ashari et al., 2012). This research was aimed at obtaining expected wheat lines with high yield potency in middle land and upland.
MATERIALS AND METHODS
The research was conducted from May to December 2011 in two locations such as Dadap-rejo and Cangar with different altitude, rainfall and temperature between those locations. Dadaprejo had the altitude of + 560 above sea level, rainfall wheat and two treated varieties (Table 1).
The experiment applied Randomly Blocked Design in each location and was repeated thrice. Thirteen lines of wheat and three treated varieties were used in this research. The wheat lines used in this experiment were selected from the last experiment (Ashari et al., 2012). The data were analysed using variant analysis, followed by the multiple comparison test using Least Significant Difference (LSD) in 5% level.
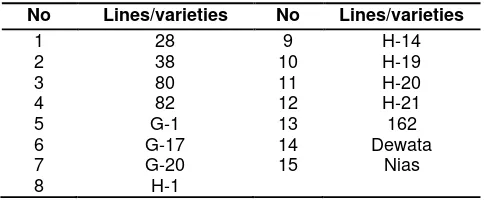
Table 1. Lines of wheat tested
No Lines/varieties No Lines/varieties
1 28 9 H-14
With the altitude of 560 m above sea level, the temperature of +25oC, and the rainfall of + 1700 mm/year, Dadaprejo (7°54'54" Southern Latitude 112°35'19"Eastern Latitude) had fertile soil with alfisol type with micro and macro environment suitable for wheat planting. Moreover, Cangar, which had the altitude of 1700 m above sea level, the average temperature of 18oC, had better micro and macro environment in which the planting environment represented the sub tropic area where wheat usually grows.
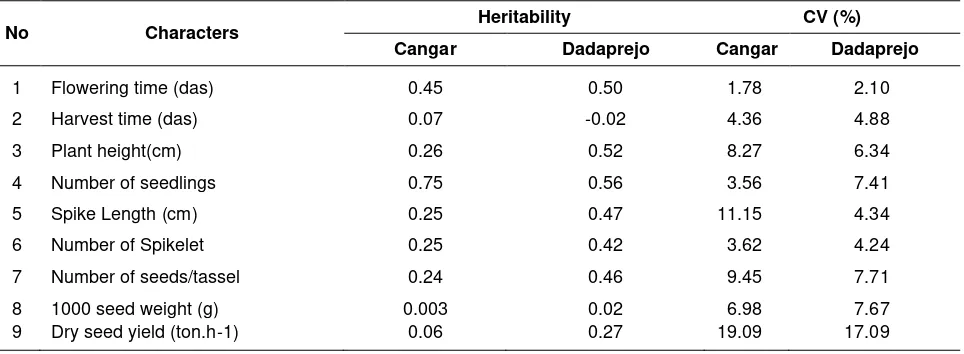
Table 2. Heritability and coefficient of Variance of wheat character in Dadaprejo and Cangar
No Characters Heritability CV (%)
Cangar Dadaprejo Cangar Dadaprejo
1 Flowering time (das) 0.45 0.50 1.78 2.10
2 Harvest time (das) 0.07 -0.02 4.36 4.88
3 Plant height(cm) 0.26 0.52 8.27 6.34
4 Number of seedlings 0.75 0.56 3.56 7.41
5 Spike Length (cm) 0.25 0.47 11.15 4.34
6 Number of Spikelet 0.25 0.42 3.62 4.24
7 Number of seeds/tassel 0.24 0.46 9.45 7.71
8 1000 seed weight (g) 0.003 0.02 6.98 7.67
9 Dry seed yield (ton.h-1) 0.06 0.27 19.09 17.09
The result of heritability and coefficient of variance of wheat character in Cangar and Dadaprejo showed that almost all the character had a low heritability and coefficient of variance. It showed that the variance between lines in same character was homogeneous because the source of lines was the result of continuous selection in the last experiment so the character phenotype was the same. The heritability result cannot be used as selection criteria to get high yield wheat variety. In Dadaprejo, the coefficient of genetic diversity ranged from 12.10% - 17.09%, which was considered low. The coefficient of genetic diversity in Cangar was considered low, for it ranged from 2.10% to 17.09%.
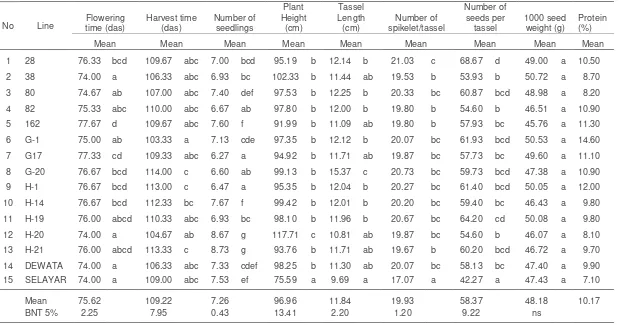
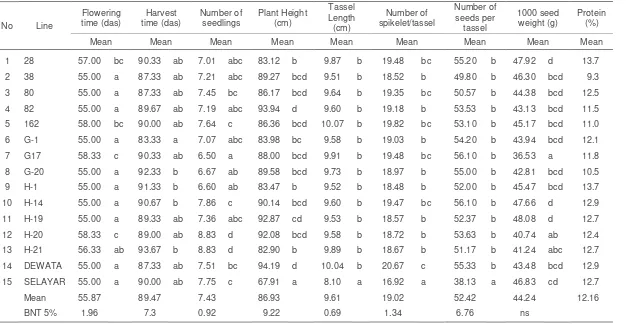
It was found that the wheat had faster flowering time and harvest time in the middle land Dadaprejo than that of the upland Cangar. Such a difference was due to the diverse latitude which brought different temperature. The moderate temperature in Dadaprejo, which was around 24oC, triggered massive respiration in plant which led the plant to having faster life cycle. On the other hand, Cangar, with its average temperature of around 18oC, tended to cause the plant to have longer life than that planted in middle land since the area of Cangar represented the subtropic area where the wheat is usually grown. The lines that flowered faster in two locations were 38, Dewata and Selayar.
Line H-20 and H-21 had more numbers of seedlings in both locations ( Table 3 and Table 4) than the other lines and treated varieties, while line G-17 had the least seedlings. The more seedlings meant the more tassels per plant, for one seedling could produce at least one tassel of wheat.
Selayar line had the lowest average of plant height in both locations. Cangar had higher average of plant height than Dadaprejo, which was due to the different environmental condition affecting the wheat growth.
The result showed that the average number of tassels per m2 in the middle land of Dadaprejo was 9.61 cm, while it was 11.84 cm in the upland of Cangar. The number of tassels in the upland was bigger than that in the middle land. The number of tassels per m2 in Dadaprejo ranged from 8.10 cm to 10.7 in which Selayar variety had the shortest tassels, while line 162 had the longest tassels. Meanwhile, in Cangar, the shortest tassels were found in Selayar variety, and the longest ones (15.37 cm) were in line G-20.
The result indicated that there were differences either in the middle land of Dadaprejo or the upland Cangar. The significant difference found in the number of spikelet per tassel was mainly caused by genetic factors. In Dadaprejo, the number of spikelet per tassel ranged from 16.92 to 20.67 where Selayar line had at least 16.92, while line 28, 80, 162, G-17, H-4 and Dewata had the most number of spikelet per tassel. In Cangar, Selayar variety had the least number of spikelet per tassel, while the most number (21.03) was produced from line 28.
It was found in the middle land of Dadaprejo that the average number of seeds per tassel
(52.42) was considered low, while it was considered high (58.27) in the upland of Cangar.
In the middle land, it was found that the average of 1000 seed was 44.24 g, which was considered high, while it was considered high in the upland at 48.12. In Dadaprejo, line H-19 had the most 1000 seed weight (48.08 g), while line 38 and G-1 had the most weight of 50.72 and 50.53 g respectively in Cangar. The weight of 100 seeds could be referred as one of criteria in selecting and determining the potency of wheat crops (Bahar, 1987 and Azwar et al., 1988).
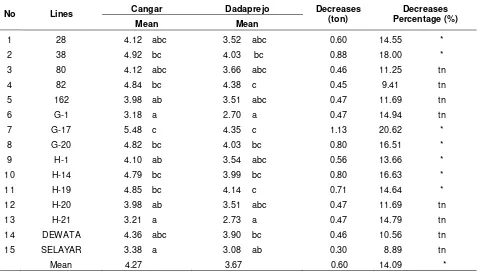
Table 6. Yield dry seed weight (ton.h-1) in two locations and decreases of yield
No Lines Cangar Dadaprejo Decreases
(ton)
Decreases Percentage (%)
Mean Mean
1 28 4.12 abc 3.52 abc 0.60 14.55 *
2 38 4.92 bc 4.03 bc 0.88 18.00 *
3 80 4.12 abc 3.66 abc 0.46 11.25 tn
4 82 4.84 bc 4.38 c 0.45 9.41 tn
5 162 3.98 ab 3.51 abc 0.47 11.69 tn
6 G-1 3.18 a 2.70 a 0.47 14.94 tn
7 G-17 5.48 c 4.35 c 1.13 20.62 *
8 G-20 4.82 bc 4.03 bc 0.80 16.51 *
9 H-1 4.10 ab 3.54 abc 0.56 13.66 *
10 H-14 4.79 bc 3.99 bc 0.80 16.63 *
11 H-19 4.85 bc 4.14 c 0.71 14.64 *
12 H-20 3.98 ab 3.51 abc 0.47 11.69 tn
13 H-21 3.21 a 2.73 a 0.47 14.79 tn
14 DEWATA 4.36 abc 3.90 bc 0.46 10.56 tn
15 SELAYAR 3.38 a 3.08 ab 0.30 8.89 tn
Mean 4.27 3.67 0.60 14.09 *
Table 3. Average of quantitative characters in Cangar
No Line time (das) Flowering Harvest time (das) Number of seedlings
Plant Height
(cm)
Tassel Length (cm)
Number of spikelet/tassel
Number of seeds per
tassel
1000 seed weight (g)
Protein (%)
Mean Mean Mean Mean Mean Mean Mean Mean Mean
1 28 76.33 bcd 109.67 abc 7.00 bcd 95.19 b 12.14 b 21.03 c 68.67 d 49.00 a 10.50
2 38 74.00 a 106.33 abc 6.93 bc 102.33 b 11.44 ab 19.53 b 53.93 b 50.72 a 8.70
3 80 74.67 ab 107.00 abc 7.40 def 97.53 b 12.25 b 20.33 bc 60.87 bcd 48.98 a 8.20
4 82 75.33 abc 110.00 abc 6.67 ab 97.80 b 12.00 b 19.80 b 54.60 b 46.51 a 10.90
5 162 77.67 d 109.67 abc 7.60 f 91.99 b 11.09 ab 19.80 b 57.93 bc 45.76 a 11.30
6 G-1 75.00 ab 103.33 a 7.13 cde 97.35 b 12.12 b 20.07 bc 61.93 bcd 50.53 a 14.60
7 G17 77.33 cd 109.33 abc 6.27 a 94.92 b 11.71 ab 19.87 bc 57.73 bc 49.60 a 11.10
8 G-20 76.67 bcd 114.00 c 6.60 ab 99.13 b 15.37 c 20.73 bc 59.73 bcd 47.38 a 10.90
9 H-1 76.67 bcd 113.00 c 6.47 a 95.35 b 12.04 b 20.27 bc 61.40 bcd 50.05 a 12.00
10 H-14 76.67 bcd 112.33 bc 7.67 f 99.42 b 12.01 b 20.20 bc 59.40 bc 46.43 a 9.80
11 H-19 76.00 abcd 110.33 abc 6.93 bc 98.10 b 11.96 b 20.67 bc 64.20 cd 50.08 a 9.80
12 H-20 74.00 a 104.67 ab 8.67 g 117.71 c 10.81 ab 19.87 bc 54.60 b 46.07 a 8.10
13 H-21 76.00 abcd 113.33 c 8.73 g 93.76 b 11.71 ab 19.67 b 60.20 bcd 46.72 a 9.70
14 DEWATA 74.00 a 106.33 abc 7.33 cdef 98.25 b 11.30 ab 20.07 bc 58.13 bc 47.40 a 9.90
15 SELAYAR 74.00 a 109.00 abc 7.53 ef 75.59 a 9.69 a 17.07 a 42.27 a 47.43 a 7.10
Mean 75.62
109.22
7.26
96.96
11.84
19.93
58.37
48.18
10.17
BNT 5% 2.25 7.95 0.43 13.41 2.20 1.20 9.22 ns
Remarks: The value followed by the same letters in one column is not significantly different at average test 5% LSD
282
Iz
m
i Yu
lia
n
a
h
et a
l.: Se
lec
tio
n th
e Yi
eld
o
f Wh
ea
t………
Table 4. Average of quantitative characters in Dadaprejo
Remarks: The value followed by the same letters in one column is not significantly different at average test 5% LSD
Moreover, in the upland of Cangar, the seed yields reached 4,27 ton.h-1, while it was 3,67 ton.ha-1 in the middle land. The yield increased directly proportional with the altitude (Ashari et al., 2012). In Cangar, the seed yields ranged from line G-1 had the least number of yields, while line 82 (4.38 ton.ha-1), G-17 (4.35 ton.ha-1) and H-19 (Ashari et al., 2012). The effect of yield difference between upland and middle land indicated that the selection had to be performed in each location.
The protein content in wheat was also found different in each treated line of both locations. The highest protein content in Dadaprejo was dominated by line H-1, and line 38 for the lowest. Meanwhile, in Cangar, the highest protein content was in line G-1, and H-20 for the lowest.
CONCLUSION
The heritability could not be used as select-ion method to obtain high yield wheat variety because the variability was homogeneous. Difference of yield decreasing between upland and middle land was significant (14,09%). the result showed that the selection had to be performed in each location to obtain the high yield wheat. content was produced in line G-1, and H-20 for the lowest.
ACKNOWLEDGEMENTS
The authors would like to thank 1) PT INDOFOOD SUKSES MAKMUR, TBK in the framework of INDOFOOD RISET NUGRAHA PROGRAMME 2011 – 2012 for the financial support in this research 2) Dean of Agriculture Faculty, Brawijaya University 3) Head of Research and Community Service Department, Brawijaya University.
REFFERENCE
Ashari. S., B. Waluyo, I. Yulianah, N. Kendarini and M. Jusuf. 2012. Stability of wheat genotypes adapted in tropical medium and lowland. Agrivita 34(1): 75-83
Aptindo. 2011. Impor gandum RI hampir 6 juta ton. available at: www.us.detikfinance. com/. Diakses 18 Maret 2011.
Azwar, R. 1987. Wheat adaptation in the tropic: I Genotype-environment interaction. Pemberi-taan Penelitian Sukarami 9:3-7
Azwar, R., T. Danakusuma dan A.A. Daradjat. 1988. Prospek pengembangan terigu di Indonesia. Makalah disajikan pada Simpo-sium Tanaman Pangan II. Puslitbangtan, Bogor 12-13 Maret 1988.
Bahar, H. 1987. Evaluasi hasil dan componen hasil terigu (Triticum aestivum L) pada beberapa tinggi tempat. Thesis Pasca Sarjana (tidak dipublikasikan). Fakultas Pascasarjana. UGM, Yogyakarta. pp. 86. Bahar H., Nasrullah, Soemartono, R. Azwar. 1988.
Pengaruh faktor lingkungan terhadap hasil terigu (Triticum aestivum L). Pemberitaan Sukarami 15:13-18
Hamdani, M., Sriwidodo, Ismail and M. M. Dahlan. 2002. Evalusai galur gandum introduksi dan CIMMYT. Prosiding Kongres IV dan Simpo-sium Nasional PERIPI. Universitas Gadjah Mada. Yogyakarta
Ismal. G. 1984. Ekologi tumbuhan dan tanaman pertanian. Universitas Andalas Padang. 196 halaman.Tanaman Pangan II. Puslitbang-tan, Bogor 12-13 Maret 1988.
Pabendon, M.B., R. Haeruddin and M. Hamdan. 2010. Kemajuan pemuliaan gandum tropis. Warta Penelitian dan Pengembangan Perta-nian 32(4): 3-4
Rawson, H.M. 1987. Effects of high temperatures on the development and yield of wheat and practices to reduce dekterions effects. p 44-62. In. A.R. Klatt (ed). A proceedings of the International Conference. January 19-23, 1987. CIMMYT.