327
Copyright © 2016. Vandana Publications. All Rights Reserved.
Volume-6, Issue-4, July-August 2016
International Journal of Engineering and Management Research
Page Number: 327-332
Partial Least Square Structural Equation Modeling (PLS-SEM) with
Biner Data (Case Study: Knowledge Creation on Dairy Cooperative in
Indonesia)
Riwi Dyah Pangesti1, I Made Sumertajaya2, Anggraini Sukmawati3
1,2Department of Statistics, Faculty of Mathematics and Natural Science, Bogor Agricultural University, Bogor,
INDONESIA
3
Department of Management, Faculty of Economics and Management, Bogor Agricultural University, Bogor, INDONESIA
ABSTRACT
Structural Equation Modeling (SEM) is an analysis method that consists of two models: the measurement and structural model. The assumtion of SEM modeling is multivariate normally distribution and large relatively sample size. In some cases there are data that doesn’t meet these assumptions so that required some handeling. In this study, the handling is done by using the approach Partial Least Square (PLS). Furthermore, changing the likert scale into binary scale
Keywords— PLS-SEM, Binary Data Data, Likert Scale . Finally, compare the model of knowledge creation in Indonesian dairy cooperatives using PLS-SEM analysis of data likert scale questionnaire and the likert scale that has been converted into binary categories.The author uses the data creation knowledge for example the application of PLS-SEM. The results obtained that the binary data is no less good than the likert scale data. It is shown from the R-square value, F-square, Q-square, RMSEA, SRMR, NFI, and GFI these two models are not much different.Likewise indicated by the Composite Reliability and Cronbach Alpha was good.Based on the t-statistic value, a likert scale of only 14 of the 24 indicators were valid. Whereas the binary scale, there are 21 valid indicators. Thus, the contruction of the questionnaire can use the binary scale.
I.
INTRODUCTION
Unobserved variables are variables that cannot be observed directly. Yet, they can be measured through indicators (observed variables) which reflect those observed variables. Indicators should be able to be explained theoritically, have an acceptable logical value and also high degree of validity and reliability.
Unobserved variables are measured in questionnaire format with indicator in the form of items of question from each construct. Most questionnaires apply Likert scale. However, it has disadvantage as respondents have to choose one of many options.
Further, these multiple choices lead to several impacts: respondents become confuse and lazy to fill the questionnaire (human error), respondents avoid extreme answers and only want to satisfy researchers (not firm answer), bias on data since respondents are more concerned with values prevailing in society than their real condition (not honest answer), and possibility of the existence of validity which is difficult to be demonstrated. A solution to handle those problems is questionnaire applying Guttman scale which only provides two choices of answer, yes/no, agree/disagree, right/wrong or other opposite options. Guttman scale will easily facilitate the respondents in filling out questionnaires because respondents should only choose one of two options to produce a firm answer.
When indicators are used to measure an observed variable, there will be two main problems, those are problem in measurement and problem due to causal relationships between variables [1]. Statistical technique that can solve these problems is Structural Equation Modeling (SEM) which can measure or analyze patterns of relationships and influence simultaneously, either directly or indirectly. It also can identify the indicators that can determine whether the observed variables are valid and reliable or not (Mattjik [1], Latan [2], Ghozali [3]).
328
Copyright © 2016. Vandana Publications. All Rights Reserved.
relationship that has no theoretical basis yet (Latan [2], Ghozali [3], Jaya [4] mengutip dari Wald, 1982).
Dairy cooperative in Indonesia is a modern organization which follows the principles of management in carrying out its functions. It also accommodates the cow milk from farmers and distributes it directly to the Dairy Processing Industry (IPS). The cooperative is a bridge between farmers and IPS thus it is necessary to develop the Knowledge Creation.
Sustainable Knowledge Creation is intended to improve the performance and output of the cooperative and expected to be an extremely important source of innovation. Indicators affecting Knowledge Creation are personal skills development, tacit knowledge sharing, conceptualization, crystallization, assessment and dissemination of knowledge (Purwanto [5]; Rahayu [6] in Sangkala, 2007).
Five factors in Knowledge Creation enabler in an organization are Shared Vision, Conversational Management, Driving Knowledge Mobilization, Provision of a Condusive Environment, and Internal Knowledge Dissemination (Purwanto [5] in Irsan 2005 in Von Krogh, 2000 ).
This study applied PLS-SEM in modeling Knowledge Creation on dairy cooperative in Indonesia. Despite research on PLS-SEM used many non-binary data, PLS-SEM has not been applied on binary data yet. Therefore, this study focused on the analysis of PLS-SEM on binary data. It is expected that study using binary data is useful for the preparation of questionnaire. In addition, it is also expected that measurement of the scale of attitudes do not necessarily have to use the Likert scale but Guttman scale instead. The preparation of such questionnaire is expected to be easier and more efficient.
II.
METHODOLOGY
PLS-SEM modelling was performed on Likert scale and binary data by these following steps:
Conceptualization of the model including the design of structural model and measurement model
The design of the structural model was based on the problem formulation or the research hypothesis. In this research, unobserved variables were divided into two, exogenous and indigenous. Exogenous unobserved variable was Shared Vision (�1) while indigenous unobserved variables were Internal Knowledge Dissemination (�1), Dairy Cooperatives Knowledge (�2), and Knowledge Creation (�3). Previous studies revealed that �1was influenced by �1,�2 was influenced by �1and �1, while�3 was influenced by �2.
The design of the measurement model becomes very important in PLS-SEM modeling since it aims to determine whether the indicator is reflexive or formative. In this study, all indicators were assumed to be reflexive.
Constructing the path diagram
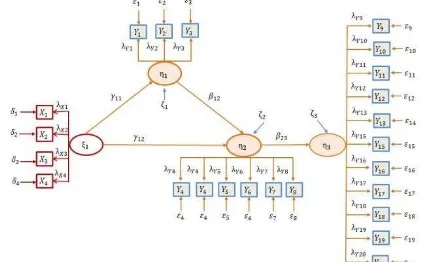
After structural model and measurement model had been designed, path diagram of those models was constructed as shown below.
Figure 1: Path Diagram of Knowledge Creation Model
Conversion of path diagram to equation system
Measurements Models
�1=��1�1+�1
�2=��2�2+�2
�3=��3�3+�3
�4=��4�4+�4
�1=��1�1+�1 �2=��2�1+�2 �3=��3�1+�3 �4=��4�1+�4 �5=��5�2+�5 �6=��6�2+�6 �7=��7�2+�7 �8=��8�2+�8
�9=��9�3+�9 �10=��10�3+�10 �11=��11�3+�11 �12=��12�3+�12 �13=��13�3+�13 �14=��14�3+�14 �15=��15�3+�15 �16=��16�3+�16 �17=��17�3+�17 �18=��18�3+�18 �19=��19�3+�19 �20=��20�3+�20
Structural Models
�1=�11�1+�1
�2=�12�1+�12�1+�2
�3=�23�1+�3
Estimation: weight, loading, and average and constants
Step 1 weight estimate
One function of PLS is to estimate the weights used to create the score of unobserved variable(Ghozali [3], Jaya [4]).
�� =� ��� ��
��� 1)
�� =� ��� ��
��� 2)
Where wkb was the weight k to form the
unobserved variable estimation �� and wki was weight k
to form the unobserved variable estimation ��.
The estimation of unobserved variables was linear aggregate of indicator which its weight value was obtained from the PLS method.
Exogenous variable on each reflexive indicator, weight wkb
��� =�����+���
, was regression coefficient of ��, while �� was standardized variable from the following equation:
(3)
thus, estimation by OLS method minimized
329
Copyright © 2016. Vandana Publications. All Rights Reserved.
��� =��� − ����� 4)
� ���2=�(��� − �����)2 5) Minimizing ∑ ���2 by deriving ∑ �
��2 on wkb
��� =
cov(���,��) var(��) which further resulted in:
6)
Step in weight estimation for indigenous variables was also similar. Iteration process would be finish when it was convergent, with limit as follows:
���∗ − ���
��� ≤10 −5
On formative indicators, weight wkb was a
multiple regression coefficient of ��. Furthermore, process of estimation coefficient of vectors wk was
similar to the process in multiple regression. Step 2 path and loading estimate
Path estimate was coefficient that linked among unobserved variables, while loading was coefficient that link between unobserved variables and indicators.
Step 3 average and parameters location (constants) estimate
Estimate of the third step was based on preliminary data matrix, the weight estimate at step 1, and the path estimate at step 2. The parameter location was a constant of bk0 for indigenous unobserved
variables while the average (��) was for the unobserved exogenous variables.
Comparing Knowledge Creation Model in Data of Likert Scale and Binary
PLS-SEM Likert scale and PLS-SEM binary data comparison was based on fitness testing of the measurement model (AVE, Composite reliability, and Cronbachs Alpha) and the structural model (R-square, f-square, Q2
Variables
, Chi-Square, RMSEA, SRMR , NFI, and GoF).
Measurement Model
TABLE1
FITNESS SIZE OF MEASUREMENT MODEL AVE
Likert Binary
SV 0.648 0.369
IKD 0.648 0.589
DCK 0.387 0.416
KC 0.648 0.303
Variables Composit Reliability Likert Binary
SV 0.88 0.677
IKD 0.846 0.81
DCK 0.79 0.81
KC 0.857 0.817
Variables Cronbach's Alpha Likert Biner
SV 0.824 0.543
IKD 0.734 0.669
DCK 0.703 0.726
KC 0.823 0.77
Value of AVE described how much variance of unobserved variable can be explained by the measurement model. AVE value of 0.5 means that the model was good enough [3]. Likert Scale generated better AVE value of each unobserved variable than binary data.
Composite reliability showed the consistency of an indicator in measuring unobserved variables. Composite reliability value > 0.7 shows that the indicator could reflect an unobserved variable [3]. Overall, both Likert scale and binary data resulted in a good Composite Reliability value, and so did the value of Cronbach's Alpha.
Based on the criteria of AVE, Composite Reliability and Cronbach's Alpha value, it can be concluded that the binary scale was as good as Likert scale.
Structural Model
Goodness test of structural model was based on the value of R-square, f-square, Q-square, and Goodness of Fit Index (GoF). Value of R-square and f-square closed to 1 indicated better model in fitting the data. R-square was used to measure how close the relationship among indigenous variables, while the f-square was used to measure how close the relationship between unobserved exogenous variables and the inidigenous unobserved variables [3]. The criteria were described as follow:
TABLE2
KRITERIA R-SQUAREANDF-SQUARE
R-square f-square Note
0.67 0.35 Strong
0.33 0.15 Medium
0.19 0.02 Low
Table 3 and 4 are depicted the R-square value and f-square on Likert scale data and the binary scale data, respectively.
TABLE3
VALUE OFR-SQUAREON LIKERT SCALE DATAAND BINARY SCALE DATA
Likert Note Binary Note
IKD 0.024 Low 0.007 Low
DCK 0.302 Medium 0.215 Low
KC 0.319 Medium 0.149 Low
330
Copyright © 2016. Vandana Publications. All Rights Reserved.
TABLE4
VALUE OF F-SQUAREON LIKERT SCALE DATAAND BINARY SCALE DATA
Likert Note Binary Note
SVvsIKD 0.025 Low 0.007 Low
SVvsDCK 0.079 Low 0.067 Low
IKDvsDCK 0.297 Medium 0.187 Medium
DCKvsKC 0.469 Kuat 0.175 Medium Goodness criteria of the model using the f-square value indicated that the Likert scale data was better when compared with the binary scale data.
Model evaluation using Q2 value was obtained through the following calculation:
�likert2 = 1−[(1− �
����2 )(1− �DCK2 )(1− �KC2 )] = 1−[(0.976)(0.698)(0.681)]
= 0.536
�binary2 = 1−[(1− �
����2 )(1− �DCK2 )(1− �KC2 )] = 1−[(0.993)(0.785)(0.851)]
= 0.663
Q2 value that was higher than zero means that the model had predictive relevance, vice versa. Q2 value for both Likert and binary model could explain more than 50% of predictive relevance.
Structural model on PLS-SEM was evaluated by GoF obtained from the following calculation (Tenenhause [7], Hussein [8], Henseler [9]).
���likert =���������������2 Both GoFLikert and GoFbinary
Overall Fit Measure
could be regarded as moderate, as their values ranged between 0.2 <GoF<0.38.
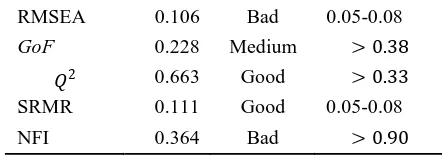
Other models were evaluated using Chi-Square (�2), RMSEA, SRMR, and NFI.
TABLE5
FITNESS SIZE OF STRUCTURAL MODEL Likert
The estimated value of path coefficient in the structural model should be significant. The significant value can be obtained through bootstraNoteng procedure with the t-statistics value. Table 6 and 7 were respectively t-statistics value on the measurement model and the structural model.
TABLE 6
T-STATISTICS VALUE OF MEASUREMENT MODEL
Latent
Variables Relationship
t-statistics value
331
Copyright © 2016. Vandana Publications. All Rights Reserved.
The table shows that the number of valid indicator on binary scale model was higher than the number of indicators on Likert scale model. Thus, based on t-statistics value, binary scale model was better than the Likert scale model.
TABLE 7
T-STATISTICS VALUE OF STRUCTURAL MODEL
Relationship
t-statistics value Likert
scale
Binary scale DCK->KC 7.418 4.372
IKD->DCK 4.647 4.583
SV->DCK 1.269 1.16
SV->IKD 0.769 0.439
Structural models hypotheses were H0: γi = 0 (exogenous unobserved variable was significant) vs H0: γi ≠ 0 (exogenous unobserved variable was not
significant) or H0: βi = 0 (indigenous unobserved variable was significant) vs H0: βi
Study which assesses the PLS-SEM and concludes that structural modelling with a relatively small sample and unfulfilled of multivariate normality assumption can apply the PLS-SEM, while model testing with a relatively large sample and data following the multivariate normal distribution can apply LISREL approach as the best approach for this model [4]. Previous study on PLS-SEM concluded that there was presumption of heterogeneity in observation units which cannot be measured directly. The heterogeneity estimation can be solved using FIMIX-PLS-SEM which was applied to obtain a model of poverty. Thus, the poverty model of this research was fit [10]. In addition, other study also applied PLS-SEM by using the package of R software [11].
≠ 0 (indigenous
unobserved variable was not significant).
As the t-statistics value was greater than or equaled with 1.96 in the measurement model, it means that the unobserved variables are significant and vice versa.
Therefore, the table produces similar conclusion. There was a significant association between the Dairy Cooperatives Knowledge and Knowledge Creation. There was a significant relationship between the Internal Knowledge Dissemination and Dairy Cooperatives Knowledge. There was no significant relationship between Shared Vision and Dairy Cooperatives Knowledge, and between Shared Vision and Internal Knowledge Dissemination.
III.
PRIOR APPROACH
Many researches on knowledge creation has been done. For example in a study entitled “Implementasi
Pengaruh Knowledge Management Terhadap Kinerja Kepuasan Karyawan dan Kepuasan Pelanggan PT. Anugrah Tata Sentika”[6]. Other study was with title
of“Model Kontribusi Aset Pengetahuan dalam
Memfasilitasi Proses Penciptaan Pengetahuan pada Koperasi Susu” [12].Other related research examined
factors supporting knowledge creation process including Shared Vision, Conversational Management, and Internal Knowledge Dissemination. These factors were found to have significant effect on the Knowledge of Dairy Cooperative Organization [5].
IV.
OUR APPROACH
PLS-SEM can be used as a confirmation of theory (theoritical testing) and recommends relationship that has no theoretical basis (exploratory) yet. PLS can solve serious problems such as inadmissible solution, that is singular matrix problem which will never happen as PLS is variance-based, not covariance. Problems of un-identified, under-identified or over-identified will also never happen because PLS works on structural models that are recursive. Factor problems that can not be determined (factor indeterminacy) arise since unobserved variable is a linear combination of its indicators that composite unobserved variables will always be obtained (Ghozali [3], Jaya [4]).
In addition to the assumption-free related to distribution of the data and the unneeded of relatively large sample, that is at least more than 30, other PLS-SEM advantages compared with CB-PLS-SEM is that the indicator of unobserved variable can be a reflexive or formative model (Ghozali [3], Jaya [4]).
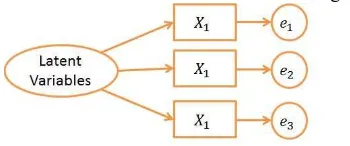
The characteristic of reflexive indicator model is that the unobserved variables are the reflection results of its indicator. Direction of the causality relationship was from construct to indicator or manifest. It is expected that indicators are correlated each other (have internal consistency reliability). Changes in indicators do not lead to changes in construct. Calculation of the measurement error (error) was at the level of indicator [13].
Model of reflexive indicator is shown in Figure 2
Figure 2: Model of reflexive indicator
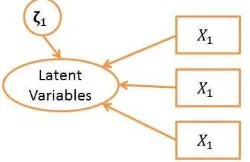
The characteristic of formative indicator model is: unobserved variables is derived (arranged) from its indicator. Direction of causality was made as if it was from indicators to construct. It is expected that indicators are not correlated each other (do not require internal consistency test or Alpha Cronbach). Changes on indicators impacted on changes on construct. Measurement error was placed at construct level (zeta) [13].
332
Copyright © 2016. Vandana Publications. All Rights Reserved.
Figure 3: Model of formative indicator
Examples of structural equation model and notation of PLS [4] are shown in Figure 4.
Figure 4: The relationship between variables and indicators in PLS model
Description:
� : Ksi, exogenous unobserved variables
� : Eta, indigenous unobserved variables
�� : Lambda (small), loading factor of exogenous unobserved variables
�� : Lambda (small), loading factor of indigenous unobserved variables
ᴧ� : Lambda (large), loading matrix of exogenous unobserved variables
ᴧ� : Lambda (large), loading matrix of indigenous unobserved variables
� : Beta (small), coefficient of the indigenous variables effect on the indigenous variables
� : Gamma (small), coefficient of the exogenous variables effect on the indigenous variables
� : Zeta (small), error of model
� : Delta (small), measurement error in manifest variables for exogenous unobserved variables
� : Epsilon (small), measurement error in manifest variables for indigenous unobserved variables
V.
CONCLUSION
Knowledge Creation models using binary scale is as good as Likert scale model. Based on the t-test statistics, indicators on binary scale was better than indicators on Likert scale as valid indicator in binary scale was more than that in Likert scale. This assessment was also based on the value of AVE, Composite reliability and Cronbach's Alpha which values were not much different between Likert scale and binary scale. In addition, it is also observed by testing the goodness of fit
of model including the value of �2, RMSEA, NFI, SRMR, R-square, f-square and Q2, which produced the same conclusion. Thus, binary scale can be recommended as an alternative in designing questionnaire for Knowledge Creation models. Binary scale will lead to more firm, honest and efficient answers.
REFERENCES
[1] A. A. Mattjik, IM. Sumertajaya, Sidik Peubah Ganda
dengan Menggunakan SAS, 2011
[2] H. Latan, Model persamaan struktural teori dan implementasi AMOS 21.0, 2013
[3] I. Ghozali, Structural equation modeling metode alternatif dengan partial least square (PLS), 2006
[4] IGN. M. Jaya, IM. Sumertajaya, Pemodelan Persamaan Struktural dengan Partial Least Square, 2008 [5] W. Purwanto, Analisis Faktor-faktor Pendukung Proses Penciptaan Pengetahuan Organisasi Di Koperasi Susu, 2010
[6] S. Rahayu, Implementasi pengaruh knowledge
management terhadap kinerja kepuasan karyawan dan
kepuasan pelanggan PT Anugrah Tata Senthika, 2013 [7] M. Tenenhaus, V. E. Vinzi, Y. M. Cathelin, C. Lauro, PLS path modeling. Computational Statistics &
Data Analysis, 2004
[8] A. S. Hussein, Penelitian Bisnis dan Manajemen Menggunakan Partial Least Square (PLS) dengan smartPLS 3.0, 2015
[9] J. Henseler, M. Sarstedt, Goodness-of-Fit Indices for
Partial Least Square Path Modeling, 2013
[10] I. N. Afifah, S. Sunaryo, Analisis structural equation modeling (SEM) dengan finit mixture partial least square, 2013
[11] A. Monecke, F. Leisch, semPLS: Structural Equation Modeling Using Partial Least Square, 2012 [12] A. Sukmawati, M. S. Ma’arif, Marimin, H. Hardjomodjojo, N. S. Indrasti, Model Kontribusi Aset Pengetahuan dalam Memfasilitasi Proses Penciptaan Pengetahuan pada Koperasi Susu, 2010