Scimago Journal & Country Rank
Home Journal Rankings Country Rankings Viz Tools Help About Us
Journal of Development Studies
Country United Kingdom
66
H Index Subject Area and
Category Social SciencesDevelopment
Publisher Frank Cass Publishers
Publication type Journals
ISSN 00220388
Coverage 1978-ongoing
Scope The Journal of Development Studies was the rst and is one of the best known international journals in the area of development studies. Since its foundation in 1964, it has published many seminal articles on development and opened up many new areas of debate. We invite articles from across academic disciplines, but priority is given to papers which are:
•interdisciplinary •provide critical tests, based on empirical work, of alternative theories, perspectives or schools of thought •relevant to important issues in development economics, politics and policy. (source)
Enter Journal Title, ISSN or Publisher Name
Quartiles
The set of journals have been ranked according to their SJR and divided into four equal groups, four quartiles. Q1 (green) comprises the quarter of the journals with the highest values, Q2 (yellow) the second highest values, Q3 (orange) the third highest values and Q4 (red) the lowest values.
Category Year Quartile
Development 1997 Q1 Development 1998 Q1 Development 1999 Q1 Development 2000 Q1
SJR
The SJR is a size-independent prestige indicator that ranks journals by their 'average prestige per article'. It is based on the idea that 'all citations are not created equal'. SJR is a measure of scienti c in uence of journals that accounts for both the number of citations received by a journal and the importance or prestige of the journals where such citations come from It
Citations per document
This indicator counts the number of citations received by documents from a journal and divides them by the total number of documents published in that journal. The chart shows the evolution of the average number of times documents published in a journal in the past two, three and four years have been cited in the current year. The two years line is equivalent to journal impact factor
measures the scienti c in uence of the average article ™ (Thomson Reuters) metric.
Cites per document Year Value
Cites / Doc. (4 years) 1999 0.982 Cites / Doc. (4 years) 2000 0.980 Cites / Doc. (4 years) 2001 1.335 Cites / Doc. (4 years) 2002 1.405 Cites / Doc. (4 years) 2003 1.758 Cites / Doc. (4 years) 2004 1.669 Cites / Doc. (4 years) 2005 1.471 Cites / Doc. (4 years) 2006 1.351 Cites / Doc. (4 years) 2007 1.286 Cites / Doc. (4 years) 2008 1.785 Total Cites Self-Cites
Evolution of the total number of citations and journal's self-citations received by a journal's published
documents during the three previous years.
Journal Self-citation is de ned as the number of citation from a journal citing article to articles published by the same journal.
Cites Year Value
Self Cites 1999 7
External Cites per Doc Cites per Doc
Evolution of the number of total citation per document and external citation per document (i.e. journal self-citations removed) received by a journal's published documents during the three previous years. External citations are calculated by subtracting the number of self-citations from the total number of citations received by the journal’s documents.
Cites Year Value
% International Collaboration
International Collaboration accounts for the articles that have been produced by researchers from several
countries. The chart shows the ratio of a journal's documents signed by researchers from more than one country; that is including more than one country address.
Year International Collaboration
1999 0.00 Citable documents Non-citable documents
Not every article in a journal is considered primary research and therefore "citable", this chart shows the ratio of a journal's articles including substantial research (research articles, conference papers and reviews) in three year windows vs. those documents other than research articles, reviews and conference papers.
Documents Year Value
Cited documents Uncited documents
Ratio of a journal's items, grouped in three years windows, that have been cited at least once vs. those not cited during the following year.
Documents Year Value
Uncited documents 1999 61 Uncited documents 2000 59 Uncited documents 2001 56 Uncited documents 2002 55
←
Show this widget in
your own website
Just copy the code below and paste within your html code:
<a href="http://www.scimagojr.com/journalsearch.php?q=14849&tip=sid&exact=no" title="SCImago Journal & Country Rank"><img border="0" src="http://www.scimagojr.com/journal_img.php?id=14849" alt="SCImago Journal & Country Rank" /></a>
1 1.25 1.5 1.75 2
1999 2002 2005 2008 2011 2014 0
250 500
1999 2002 2005 2008 2011 2014 0.5
1 1.5 2
1999 2002 2005 2008 2011 2014 0
25 50
1999 2002 2005 2008 2011 2014 0
200 400
1999 2002 2005 2008 2011 2014 0
Developed by:
Powered by:
Follow us on Twitter
On: 26 Novem ber 2012, At : 21: 31 Publisher: Rout ledge
I nform a Lt d Regist ered in England and Wales Regist ered Num ber: 1072954 Regist ered office: Mort im er House, 37- 41 Mort im er St reet , London W1T 3JH, UK
The Journal of Development Studies
Publicat ion det ails, including inst ruct ions f or aut hors and subscript ion inf ormat ion:ht t p: / / www. t andf online. com/ loi/ f j ds20
Foreign Direct Investment Spillovers
and Productivity Growth in Indonesian
Garment and Electronics Manufacturing
Suyant o a , Harry Bloch b & Ruhul A. Salim ba
Facult y of Business and Economics, Universit y of Surabaya, Surabaya, Indonesia
b
School of Economics and Finance, Curt in Universit y, WA, Aust ralia
Version of record f irst published: 05 Apr 2012.
To cite this article: Suyant o, Harry Bloch & Ruhul A. Salim (2012): Foreign Direct Invest ment Spillovers and Product ivit y Growt h in Indonesian Garment and Elect ronics Manuf act uring, The Journal of Development St udies, 48: 10, 1397-1411
To link to this article: ht t p: / / dx. doi. org/ 10. 1080/ 00220388. 2011. 646992
PLEASE SCROLL DOWN FOR ARTI CLE
Full t erm s and condit ions of use: ht t p: / / w w w.t andfonline.com / page/ t erm s- and-condit ions
This art icle m ay be used for research, t eaching, and privat e st udy purposes. Any subst ant ial or syst em at ic reproduct ion, redist ribut ion, reselling, loan, sub- licensing, syst em at ic supply, or dist ribut ion in any form t o anyone is expressly forbidden.
The publisher does not give any warrant y express or im plied or m ake any represent at ion t hat t he cont ent s w ill be com plet e or accurat e or up t o dat e. The accuracy of any
Foreign Direct Investment Spillovers and
Productivity Growth in Indonesian Garment
and Electronics Manufacturing
SUYANTO*, HARRY BLOCH** & RUHUL A. SALIM**
*Faculty of Business and Economics, University of Surabaya, Surabaya, Indonesia, **School of Economics and Finance, Curtin University, WA, Australia
Final version received August 2011
ABSTRACT Inflows of foreign direct investment generate externalities that spill over to domestic firms and raise their productivity. This article examines the extent of spillover effects of foreign direct investment for firms in the highly disaggregated garment (ISIC 3221) and electronics industries (ISIC 3832) in Indonesia. Both are export-intensive industries, but differ greatly in technological sophistication and labour intensity. Changes in both the productivity level and rate of growth in each industry are decomposed into the effects of technological change, technical efficiency change and scale efficiency change and then the impacts of spillovers on each component and on total productivity are estimated. The findings suggest that foreign direct investment generates a positive effect on total productivity change, technical efficiency change, technological change, and scale efficiency change in the garment industry. In contrast, foreign direct investment contributes significantly negatively to total productivity, technological change and scale efficiency change, but has no significant effect on technical efficiency change in the electronics industry.
I. Introduction
Over the past two decades, many developing countries have sought to attract foreign direct investment (FDI) by providing preferential fiscal and financial incentives. According to a report by UNCTAD (2009), the net FDI inflows to developing countries increased more than 30 times between 1986 and 2007, rising from US$16 billion to US$499 billion. South-Eastern Asian developing countries experienced an increase in the net FDI inflows from US$2.9 billion in 1986 to US$60.5 billion in 2007. Indonesia, which is one of the successful South-Eastern Asian countries in attracting FDI, recorded an increase of more than 34 times in net FDI inflows, jumping from a meagre US$0.2 billion in 1986 to US$6.9 billion in 2007.
Inflows of FDI are widely believed to be beneficial to host countries in terms of providing additional capital, generating new employment, financing budget deficits, and complementing a saving gap. However, preferential policies toward FDI rely to a large extent on the argument that FDI generates externalities in the form of new knowledge, including modern technology, advanced managerial expertise, and scale-efficiency knowledge (Blomstro¨m, 1986; Blomstro¨m
Correspondence Address: Ruhul A. Salim, A/Professor of Economics, School of Economics & Finance, Curtin Business School, Curtin University, WA 6845, Australia. Email: [email protected]
An Online Appendix is available for this article which can be accessed via the online version of the journal available at http://dx.doi.org/10.1080/00220388.2011.646992
Journal of Development Studies,
Vol. 48, No. 10, 1397–1411, October 2012
ISSN 0022-0388 Print/1743-9140 Online/12/101397-15ª2012 Taylor & Francis http://dx.doi.org/10.1080/00220388.2011.646992
and Kokko, 1998; Liu, 2008). These externalities are mainly due to foreign subsidiaries being unable to completely internalise the new transferred knowledge from their parent companies, and this transferred knowledge spills over to domestic firms, raising productivity. Achieving productivity improvements in domestic firms as a result of knowledge externalities from foreign firms is widely known as productivity spillovers of FDI.
Although the theoretical literature leaves no doubt as to the beneficial spillover effects of FDI, the empirical evidence is inconclusive. Due to the lack of detailed firm-level data, empirical research has mainly focused on the aggregate industrial level. For example, Haskel et al. (2007), Aitken and Harrison (1999) and Javorcik (2004) examine spillover effects of FDI on UK, Venezuelan and Lithuanian manufacturing at the aggregate level, respectively. In Indonesia, Blalock and Gertler (2008) investigate FDI spillovers effects in aggregate manufacturing and in two-digit industries. The recent study in Indonesia by Suyanto et al. (2009) examines the three-digit industries of chemical and pharmaceutical firms.
This article contributes to the literature by examining spillover effects of FDI on productivity level and productivity growth of firms in the highly disaggregated garment (ISIC 3221) and electronics industries (ISIC 3832). The main reason to choose the two four-digit industries is the economic importance of these two sectors during the sample period 1988–2000. These two industries together contribute on average approximately 8 per cent and over 25 per cent in manufacturing output and exports respectively. The labour intensive garment industry is suited to the natural abundance of labour in Indonesia, and was expected to be one of the engines of growth in the economy (Hill, 1991). In contrast, electronics is a capital intensive high-tech industry, which has been a priority sector for the government in developing technological capabilities (Aswicahyono et al., 2005). These two sectors are expected to generate different spillover effects from FDI. As suggested by Girma and Go¨rg (2007), there is a substantial heterogeneity in results across sectors in relation to productivity spillovers in manufacturing industries. Hence, examining the two four-digit industries separately reduces the heterogeneity problem while providing insight into differential impacts of FDI spillovers.
Another contribution of the present study is that it analyses spillover effects based on production frontiers for relatively homogenous firms. As argued by Bartelsman and Doms (2000), focusing on homogenous firms in a highly disaggregated industry may reduce aggregation bias, and therefore, provides more precise estimates of production frontiers for analysing spillover effects. Further, the uniqueness of each sub-sector in gaining spillover benefits can be clearly identified.
The third notable contribution of the current article is the use of two different approaches that permit distinctions between three important elements of productivity growth – technological change, technical efficiency change and scale efficiency change. Lastly, the present article does not pool the data sets of different sectors, which minimises the likelihood of reverse causality.
The rest of the article proceeds as follows. Firstly, an overview of Indonesian garment and electronic industries is presented, which is followed by an outline of estimation techniques. In the third section data sources and variable construction are described. Analysis of the empirical results is then presented, which is followed by conclusions and policy implications in the final section.
II. An Overview of the Garment and the Electronics Industries
Garment Industry
The Indonesian garment industry has been experiencing impressive growth over the last three decades, moving from catering only for domestic demand to a major contributor of manufacturing exports. In the late 1970s, this sub-sector produced outputs valued at less than IDR2 billion and there were no recorded exported. However, since the late 1980s, this sub-sector has emerged as a leading sub-sector for exports and became the country’s biggest net exporter
with a surplus of around US$7 billion in 2005. The output of this sub-sector increased by considerably more than 20 times, from IDR819 billion in 1988 to IDR20,012 billion in 2000, and its contribution to total manufacturing output almost doubled between 1988 and 2000 (see Online Appendix, Table A1).1Labour productivity, which is measured by value added per labour, multiplied by more than six times between 1988 and 2000, and the share of foreign firms in total value added of this sub-sector jumped from only 1.84 per cent in 1988 to 37.16 per cent in 2000. The value added contributions of this sub-sector, relative to the aggregated textile industry, increased from 7.6 per cent in 1975 to 33.8 per cent in 1993 (Pangestu, 1996). Not surprisingly, this sub-sector has been declared as a ‘strategic industrial sub-sector’ by the government since the early 1990s.
There are two main factors contributing to the development of the garment industry. The first factor is a significant increase in domestic demand, due to the expanding urban middle class (Hill, 1991). The second factor is the growing export opportunities and the huge amounts of foreign direct investment from the late 1980s. Supported by trade and investment policy reforms this second factor resulted an unprecedented increase in foreign ownership from 1.84 per cent of value added in 1988 to 29.97 per cent and 37.16 per cent in 1995 and 2000 respectively (Online Appendix, Table A1). This indicates the important role of foreign firms in this industry.
Electronics Industry
The real growth in the electronics industry began in the late 1980s, following the comprehensive reforms in trade and investment policies. A surge in foreign investment and a growing possibility for exports due to the reforms triggered this industry to expand remarkably, not only in output and exports but also in labour productivity, value added, and foreign ownership. Based on the annual survey of the manufacturing industry, the output of the electronics sub-sector has increased by more than 40 times, from a meagre IDR386 billion in 1988 to IDR15,590 in 2000 (Online Appendix, Table A2). Export growth has been outstandingly high, achieving 117.9 per cent in 1992 and 109.6 per cent in 2000. The contribution to total manufacturing output has tripled between 1988 and 2000, and the value added of the industry has risen considerably during the same period. Most impressive is the sizeable increase in the percentage of foreign firms in the industry, jumping from only 6.9 per cent in 1988 to 51.58 per cent in 2000. Moreover, foreign firms’ contribution to total industry’s value added increase from 35 per cent in 1988 to more than 75 per cent in 2000 revealing the important role of foreign investment in this country.
Although firms in the electronics industry largely contribute to exports of the country, these are mostly assembly lines, which make them active importers of materials as well. The majority of their material and parts are imported from developed countries, such as Japan and Taiwan, and these materials are assembled in Indonesia. As recorded by the Indonesian Board of Statistics (Badan Pusat Statistik or BPS), the imported material of the electronics firms accounted for 75 per cent of the total production materials in 1988 (Online Appendix, Table A2). The dependence on imported materials was even higher in 1995, with 87.15 per cent of the materials imported.
The electronics industry is a homogenous industry in terms of technology. This industry mostly produces electrical appliances for household use. The productivity of labour in this industry is among the highest for sub-sectors of the manufacturing sector, with value added per labour of IDR6 million in 1988 and IDR62 million in 2000.
III. Methods of Estimation
This study uses two productivity measurement methods, namely the stochastic production frontier (SPF) and the Malmquist productivity index (MPI) in investigating the spillover effects on firms’ productivity.
FDI Spillovers and Productivity Growth 1399
Stochastic Production Frontier
The recently developed and widely used SPF model of Battese and Coelli (1995) is used to estimate the FDI spillover effects on productivity through effects on technical efficiency. The general linear form of SPF can be written as follow:
yit¼xitbþvituit ð1Þ
uit ¼zitcþeit ð2Þ where yit denotes the scalar output of firmi(i¼1, 2, . . . ,N) at time t (t¼1, 2, . . . ,T),xitis a
(1xk)vector of inputs used by firmiat timet,bis a(kx1)vector of unknown parameters to be estimated; the vit is a random error; uit is the technical inefficiency effect; zit is a (1xm) vector of observable non-stochastic explanatory variables affecting technical inefficiency for firmiat timet,cis a(mx1)vector of parameters of technical inefficiency function, andeis an unobservable random variable. For the transcendental logarithm (translog) functional form with input variables labour (L), capital (K), material (M) and energy (E), then Equation (1) can be written as
lnyit¼b0þbLlnLitþbKlnKitþbMlnMitþbElnEitþbLL½lnLit2þbLK½lnLitlnKit þbLM½lnLitlnMit þbLE½lnLitlnEit þbKK½lnKit2þbKM½lnKitlnMit þbKE½lnKitlnEit þbMM½lnMit2þbME½lnMitlnEit þbEE½lnEit2þbtt
þbLt½lnLitt þbKt½lnKitt þbMt½lnMitt þbEt½lnEitt þbttt2þvituit ð3Þ FDI variables are incorporated in the technical inefficiency function in order to measure FDI productivity spillovers. Other variables that may influence firms’ efficiency are also included. Thus, the exogenous variables affecting technical inefficiency are separated into two groups: FDI variables and other exogenous variables. Hence, the inefficiency model in Equation (2) can be rewritten as
uit¼FDIitsþgitdþoit ð4Þ Equations (3) and (4) are estimated simultaneously using the computer program FRONTIER4.1.
Malmquist Productivity Index
The test of FDI spillovers on productivity growth in this study follows a two-step procedure. In the first step, the widely used Malmquist productivity index (MPI) productivity growth is decomposed into three sources: technical efficiency change (TEC), technological change (TC) and scale efficiency change (SEC). In the second step, the FDI variables are regressed against each source of productivity growth for testing the spillover effects using the following panel specification:
MPIt;tþ1
i ¼aiþFDIitbþLitdþxit ð5Þ
whereMPIt;tþ1
i is a measure of productivity growth for firmibetween two consecutive periods of
tandtþ1, that isMPI¼(GO,TEC,TC,SEC),FDIis one or more of three measures meant to
capture the importance of FDI (FDI as a share of domestic output (FDIHorizontal), FDI as a share of output in supplier industries (FDIBackward) and FDI as a share of output in buyer industries (FDIForward)),Lis other factors contributing to productivity growth,idenotes firm
i, t denotes time, a, b, and d are parameters or vectors of parameters to be estimated, and x
denotes an error term. Test procedures such as Chow and Hausman are used to choose the appropriate model among the three competing models, that is, common effect (or pooled), fixed effect (or least squares dummy variable, LSDV), and random effect (or generalised least squares, GLS) models.
IV. Data and Definitions of Variables
The primary data source of this study is the annual survey of medium and large manufacturing establishments (Survei Tahunan Statistik Industri – SI) conducted by the Indonesian Central Board of Statistics. Data from several other sources are also used when constructing the final panel dataset. Various indices such as the wholesale price index (WPI), machinery price index, electronics price index and the OPEC fuel basket price fromDX for Windows2are used to deflate output, materials, capital and energy respectively. The input–output tables are used for calculating FDI variables for downstream and upstream industries (that is, variables of backward and forward linkage).
This study uses data from 1988 to 2000 for three reasons. Firstly, 1988 is chosen as the starting year because the data on the replacement value of capital are not available before 1988. Secondly, the 2001 to 2008 period for which data are available is excluded because the BPS changed the specific identification code in 2001 to KIPN without providing a concordance table to the previously used identification code (PSID). Thirdly, during 1988 and 2000 the two industries (garment and electronics) contributed substantially to the value added of manufacturing industries but did not perform well after 2000, reflected in a declining share in the total value added of manufacturing industries.
Among the variables used in estimating Equations (4) and (5),FDIis a dummy variable (equal to one for firms with foreign ownership and equal to zero otherwise),FDIHorizontalis a measure of the share of output coming from foreign-owned firms,FDIBackwardis a measure of the share of the total output of an industry that is sold to foreign firms in other industries,FDIForwardis a measure of the share of total input that is bought from foreign firms in other industries,AGEis age of firm, CRISISis a dummy variable for crisis.3Barrios et al. (2011) criticise the way the
FDIBackward linkage is measured in the literature as this measurement relies on a number of stringent assumptions. The authors suggest an alternative measure of FDIBackward linkage which uses the input–output (I-O) table for the home country of multinationals rather than the host country. For two reasons, we cannot use this alternative measure ofFDIBackwardlinkage. First, this measure is proposed for aggregate manufacturing, but is not suitable for our disaggregated study. Second, the input–output coefficient remains static for a long period of time, because the I-O table in any country is published only over long periods/years of interval. We require a measure with frequent variation in order to carry out estimation with panel data. A consistent and integrated balanced panel of data is constructed by following the adjustment procedure described in Suyanto et al. (2009). The final dataset consists of 3614 observations for garment firms and 416 observations for electronics firms. Definition and construction of variables are presented in Table A3 (in the Online Appendix).
V. Results and Analysis
Estimating Horizontal Spillovers on Productive-Efficiency Level
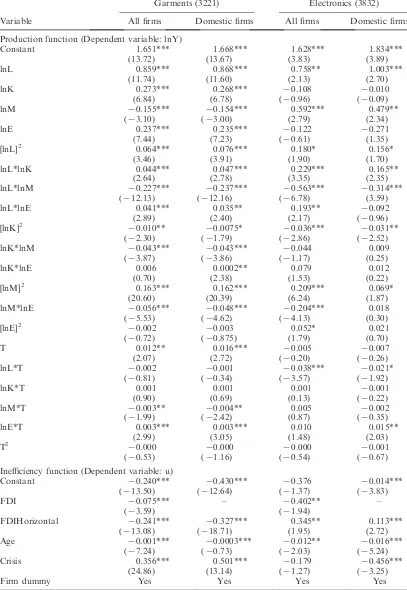
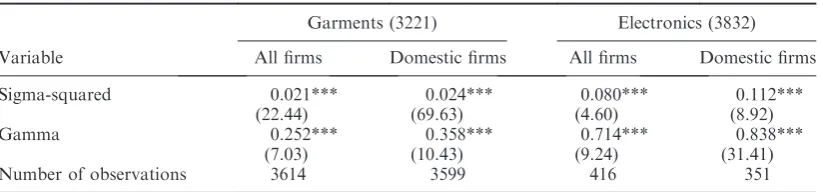
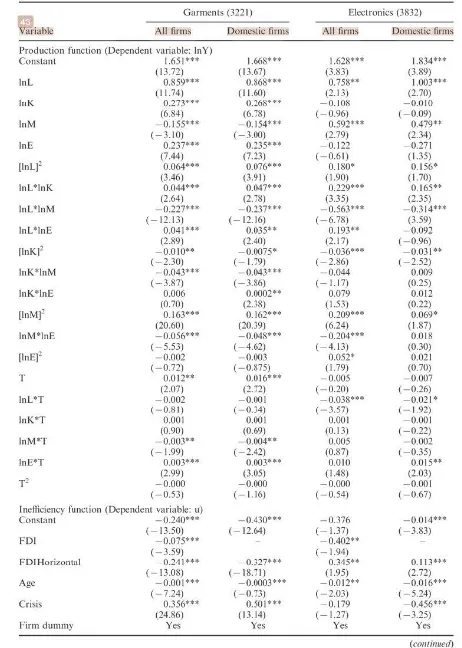
Using Equations (3) and (4) above, this section estimates the horizontal spillovers on firm-level productive efficiency. Estimations are performed on both full samples and the sub-samples of domestic firms for the two selected industries, and the results are presented in Table 1. The upper-part of the table shows the estimates of the stochastic production frontier (SPF) and the lower-part depicts the estimates of FDI horizontal spillovers on technical efficiency.
FDI Spillovers and Productivity Growth 1401
Table 1.SFA estimates on FDI horizontal spillovers in garments and electronics
Garments (3221) Electronics (3832)
Variable All firms Domestic firms All firms Domestic firms
Production function (Dependent variable: lnY)
Constant 1.651***
Inefficiency function (Dependent variable: u)
Constant 70.240***
Firm dummy Yes Yes Yes Yes
(continued)
In a one-stage approach, the SPF estimates are used for setting a technology frontier and for calculating firm-level time-variant inefficiency scores, but they have no direct economic implications for output. The impact of each input on output in a translog model depends on the interactions of the first degree and second degree variables. The effect of labour, for example, depends on the interaction of coefficients oflnL,[lnL]2,[lnL*lnK],[lnL*lnM],[lnL*lnE], and
[lnL*T]. Hence, output elasticity with respect to labour, capital, material, and energy are calculated, along with the returns to scale, however, results are not reported here to save space. The positive average values of output elasticity to labour, output elasticity to capital, output elasticity to material, and output elasticity to energy in the garment and electronics industries indicate that each input positively contributes to output. A slightly higher value than one for the return to scale (RTS) in both selected industries between 1988 and 2000 suggests slight economies of scale.
Moving to the estimates of inefficiency function (the lower part of Table 1), the coefficient of
FDIis negative and statistically significant at 1 per cent and 5 per cent levels for the electronics and garment industries, respectively, indicating that foreign-owned firms are less inefficient than domestic firms in these selected industries. This finding justifies an argument in Caves (1971) and Dunning (1988) that foreign firms possess specific knowledge advantages, which allow them to operate in more efficient ways than domestic competitors. The result is in line with findings of Sjoholm and Lipsey (2006) and Blalock and Gertler (2008), although these studies examine aggregate Indonesian manufacturing industry.
An additional point to be noted from the coefficients onFDIin Table 1 is that the difference in efficiency scores between foreign and domestic firms is bigger in the electronics industry than in the garment industry. The average technical efficiency index of foreign firms in the electronics industry is higher than that in the garment industry (0.94 for foreign electronics and 0.86 for foreign garments), and the average technical efficiency index of domestic firms in the electronics industry is lower than that in the garment industry (0.52 for the former and 0.64 for the latter). Also interesting is that the coefficient onFDIHorizontal in Table 1 is found to be negative and statistically significant in the garment industry, which implies positive horizontal spillover on firm-level technical efficiency. In contrast, the coefficient on FDIHorizontal is positive and significant in the electronics industry, which implies a negative horizontal spillover on firm-level technical efficiency. These findings support the view of Lipsey and Sjoholm (2005) that spillover benefits are not automatic consequences of foreign presence; rather they depend on the characteristics of each industry or sub-sector.
Differences in findings in these two industries can be explained by using the performance gap of Lapan and Bardhan (1973) and the competition effect of Aitken and Harrison (1999). In the case of the garment industry, a large efficiency gap between domestic and foreign firms provides substantial room for the former to catch up the latter, and therefore, foreign presence generates positive horizontal spillovers on the domestic firms. The calculated technical efficiency indexes
Table 1.(Continued)
Garments (3221) Electronics (3832)
Variable All firms Domestic firms All firms Domestic firms
Sigma-squared 0.021***
Number of observations 3614 3599 416 351
Source:Author’s calculation using Equations (3) and (16).
Notes:The t-statistics are in parentheses. *** denotes 1 per cent significance level, ** denotes 5 per cent significance level, and * denotes 10 per cent significance level.
FDI Spillovers and Productivity Growth 1403
with an average score of 0.86 for foreign firms and that of 0.64 for domestic firms during the observed years, justifies this argument.4
In the case of the electronics industry, the competition effect from foreign firms creates negative efficiency spillovers to domestic firms. A significant jump in the percentage of foreign firms in the electronics industry, from 6.9 per cent in 1988 to 51.58 per cent in 2000, clearly increases the competition effect in the market and appears to demonstrate the ‘market stealing phenomenon’. Nevertheless, either positive or negative horizontal spillovers are consistent with findings of the previous studies in Indonesia and elsewhere (Havranek and Irsova, 2011).
For variables not related to FDI, the estimate ofAgehas a negative sign and is statistically significant for both garment and electronics industries, either using the full sample or the sub-sample of domestic firms. Older firms have lower inefficiency in both industries indicating that firms accumulate knowledge through experience and learning by doing, which is in line with the endogenous growth theory.
Interestingly, the coefficient ofCrisisin the estimation for the garment industry is positive and significant, while the sign is negative and significant for the electronic industry, suggesting that the economic crisis increased the inefficiency of garment firms while decreasing inefficiency in electronics industry. A drop in domestic and international demand during the crisis decreased the production level of garment industry and, in turn, reduced the efficiency level of the industry. The electronics industry experienced a decline in domestic demand, but it gained a substantial increase in international demand due to the depreciation in the exchange rate, which meant this industry increased efficiency.
Estimating Backward and Forward Spillovers on Productive-Efficiency Level
In this sub-section, the analysis is extended to capture the backward and forward spillovers. The estimates of the inefficiency function are given in Table 2, whereas the estimates of stochastic production frontier are not presented here due to the space limitation but are available upon request. Columns (2) to (5) of Table 2 present the results for the garment industry, where the second and third columns are based on the full sample and the fourth and fifth columns are from the sub-sample of domestic firms. Column (6) onwards presents the estimates for the electronic industry, which are also based on either the full sample or the sub-sample of domestic firms.5
For the garment industry, the negative and significant estimate ofFDIBackward in both the full sample and the sub-sample demonstrate a positive spillover effect from FDI on firm-level technical efficiency in upstream industries. In other words, the presence of foreign firms in industries supplying the Indonesian garment industry generates positive externalities to domestic garment manufacturers. A positive spillover on domestic firms from foreign-owned buyers is also evident in the garment industry, as shown in the third and the fifth column of Table 2. This type of spillover is indicated by the negative sign and a high significance of theFDIForwardestimate for both the full sample and the sub-sample of domestic firms.
Unlike for garments, the estimate ofFDIBackwardfor the electronics industry is positive and statistically significant, both for the full sample and the sub-sample, suggesting a negative spillover of foreign-owned firms on domestic suppliers. This could be because the majority of foreign firms in the electronics industry are heavily reliant on materials from overseas suppliers, as indicated by a significantly high share of imported materials in production. Hence, the presence of foreign firms as suppliers to the electronics industry is more likely to reduce the efficiency of domestic producers of electronics.
As argued by Rodriguez-Clare (1996), negative backward spillovers may arise when foreign firms do not extensively use intermediate materials from domestic suppliers. In case of the electronics industry, less than 35 per cent of the materials are supplied by domestic suppliers (Table A2, Online Appendix) and the local suppliers tend to produce low-priced materials with relatively low quality compared to overseas suppliers. Another possible explanation regarding the negative backward spillovers is an argument of asymmetric bargaining power
Table 2.SFA estimates on FDI backward and forward spillovers in garments and electronics
Garments (3221) Electronics (3832)
Variable
Inefficiency function (dependent variable: u)
Constant 70.038
FDIForward – 70.845***
(74.55)
Firm dummy Yes Yes Yes Yes Yes Yes Yes Yes
Sigma-squared 0.017***
Observations 3,614 3,614 3,559 3,559 416 416 351 351
Source:Author’s calculation using Equation (4).
Notes:The t-statistics are in parentheses. *** denotes 1 per cent significance level, ** denotes 5 per cent significance level, and * denotes 10 per cent significance level. The estimations are based on a stochastic production frontier with 4 inputs.
FDI
(Graham et al., 1999). Foreign-owned firms may have much more bargaining power than domestic suppliers due to their size and international operation. Therefore, the finding of negative backward spillovers in this industry is not surprising.
Regarding forward spillovers in the electronics industry, the estimate of FDIForward is positive for both the full sample and the sub-sample of domestic firms. However, the results are statistically significant only for the sub-sample, showing that foreign firms may either generate no spillover or negative spillovers to domestic suppliers. As foreign firms in Indonesia’s electronics industry tend to sell more to international market than to domestic buyers, there may be no spillover generated to domestic suppliers. The forward spillover could be negative when the foreign-owned buyers have high bargaining power (Graham et al., 1999). The finding of negative forward spillovers in this study is similar with the findings in some previous studies for other countries (Havranek and Irsova, 2011).
FDI Spillovers on Productivity Growth
The empirical analysis in the previous section focuses on the level effect of FDI spillovers. This section extends the analysis into the growth effect. The level effect pictures a long-run effect of FDI spillover, whereas the growth effect depicts the short-run effect. The growth effects are examined on both productivity growth and its components.
Decomposing total factor productivity growth. The annual average indexes of total factor productivity (TFP) growth, TEC, TC, and SEC for the garment and the electronic industries are presented in Tables A4 and A5 in the Online Appendix, respectively. The second to fifth columns of Table A4 present the calculated indexes of TFP growth and its components for the sample of all firms in the garment industry. TFP growth is positive, with an average of 2.33 per cent between 1988 and 2000. When the TFP growth is decomposed into three components, TC is the main driver of the productivity growth. SEC is also found to be positive during the observed period. In contrast, TEC is negative between 1996 and 1999, showing that firms in the garment industry lost efficiency during the economic crisis.
Four columns in the middle of Table A4 show the calculated indexes for sub-sample of domestic firms and the last four columns portray the indexes for a sub-sample of foreign firms. It is apparent that the average productivity growth of domestic firms is higher than those of foreign firms, demonstrating a catching-up process. SEC seems to be the major reason for the difference in the productivity growth of domestic and foreign firms. In addition, technological progress is the main source of growth for both domestic and foreign firms in the garment industry.
The decomposed indexes of TFP growth for the electronics industry are given in Table A5. From the average indexes of TFP growth, it is seen that the productivity growth of the industry is negative for the period of study. This negative growth is more evident for foreign-owned firms, with the average growth rate of -1.41 per cent between 1988 and 2000. When the productivity growth is separated into the three components, technological regress appears to be the main source of negative growth. The regress in technology is hard to explain as the electronics industry is a high technology industry, which is supposed to experience technological progress. However, as pointed out by Thee (2006), the lack of upgrading in technology and the relatively small amount of technological effort prevented the electronics industry from achieving technological progress. In addition, Aswicahyono et al.(2005) find that the Indonesian electronics industry has been left behind by their neighbourhood countries, such as Malaysia and South Korea, due to the slow movement toward technology upgrading. Another possible explanation for technological regress in the electronics industry could be a decline in price-cost margins with the intensification of competition.
Estimating FDI spillovers on productivity growth and its components. The growth effects of FDI on productivity are estimated by making use of the calculated productivity indexes in the
previous section. The four productivity indexes (TFP growth, TEC, TC, and SEC) are taken interchangeably as a dependent variable in estimations of spillover effects. Three estimation models are performed; they are common effect (CE), fixed effect (FE) and random effect (RE). These three models are applied on both the full sample (all firms) and the sub-sample of domestic firms.6Based on the results of theChowand theHausmantests to our data set the FE model is found to be the appropriate model for TFP growth and its sources in the garment industry. In contrast, the RE model is found to be suitable for all productivity measures, except TC, in the electronics industry. To save space only the results from FE model for garment and RE model for electronic industries are presented in Table 3.
From Table 3, the estimate of FDIHorizontal on TFP growth is positive and statistically significant suggesting a positive effect of FDI spillovers on all firms’ productivity growth in the garment industry. Furthermore, when the spillover effects are investigated on the sources of growth, it is evident that the positive spillovers on productivity growth are channelled through not only technological progress but also technical efficiency improvement and scale efficiency advancement.
The channel through technical efficiency improvement is reflected from the positive and significant estimate of FDIHorizontal on TEC (column (3)). This positive effect indicates an indirect transfer of managerial knowledge from foreign-owned firms to garment firms, as argued in Wang and Blomstro¨m (1992). Similarly, the channel through technological progress is portrayed from the positive and significant estimate ofFDIHorizontalon TC (column (8)). This finding justifies the argument of technology transfer in Caves (1974). As for the spillover through scale efficiency change, the positive and high significance of FDIHorizontal estimate on SEC confirms the positive effect (column (5)).
Unlike firms in the garment industry, firms in the electronics industry have a negative productivity effect from FDI spillovers. As portrayed in Table 3, one can see that the estimate of
FDIHorizontalon TFP growth is negative and significant at the 1 per cent level, either for the full sample or for the sub-sample of domestic firms. This result indicates a negative effect of FDI spillovers on productivity growth.
When the spillover variable is estimated on sources of productivity growth, evidence that the coefficient ofFDIHorizontalis negative and statistically different from zero suggests a possibility that FDI adversely affects the TC of domestic-owned firms. There is also a negative effect of FDI spillovers on scale efficiency change. The estimate of FDIHorizontal on TEC is negative but insignificant. Based on these outcomes, it is arguable that firms in the electronics industry have experienced a negative productivity effect of FDI spillovers that is channelled through technological change and scale efficiency change, but not through technical efficiency change.
The results from the growth effect regressions above are consistent with the results from the level effect. Both results show that the garment industry receives productivity gains from FDI spillovers. In addition, both results also demonstrate that the electronics industry has experienced a negative effect of FDI spillovers. These consistent results reveal that the long-run effect and the short-long-run effect of FDI spillovers go to the same direction.7 Furthermore, findings of the opposite spillover effects between the garment industry and the electronics industry are not surprising, as the recent literature has argued that a positive or negative effect of FDI spillovers depends greatly on the capability of firms in each industry to grasp the spillover benefits (Lipsey and Sjoholm, 2005; Girma and Go¨rg, 2007).
The study that comes closer to this present study is the one by Girma and Go¨rg (2007) for Morocco. However, the use of a conventional decomposition in their study allows them to estimate the spillover effects on only technology and scale efficiency. The effects on technical efficiency are not identified as the firms are assumed to be producing on full-efficiency capacities. Estimations of FDI spillovers on productivity growth in the above analysis are conducted under the assumption of the exogeneity of the FDI variable. The direction of causality may also go from productivity growth to foreign investment in the firm. If this is the case, the estimations in the previous section may suffer from simultaneity bias. To ensure that this is not a problem,
FDI Spillovers and Productivity Growth 1407
Table 3.Estimates of FDI spillovers on productivity growth of garment and electronic industries
All garments firms (3221) All electronics firms (3832)
TFP (G0) TEC TC SEC TFP (G0) TEC TC SEC
FDIHorizontal 0.095** 0.028*** 0.016* 0.082*** 70.172** 70.000 70.030*** 70.152*
Age 70.0001*** 70.0002*** 70.0003*** 70.0003*** 7001 0.000 70.000** 70.001
Crisis 70.010*** 70.001*** 70.002*** 70.007*** 70.070*** 70.001 70.006*** 70.062***
Firm-dummy Yes Yes Yes Yes Yes Yes Yes Yes
R-squared 0.242 0.452 0.162 0.134 0.155 0.136 0.242 0.141
No. of Obs 3,336 3,336 3,336 3,336 384 384 384 384
Notes:All estimations include constant. ***, **, * denote significance at the 1 per cent level, the 5 per cent and the 10 per cent level, respectively. CE stands for
common effect model, FE is fixed effect model, and RE is random effect model. The critical value ofChowF-test ata¼0.05 is 1.030.
1408
Suya
nto
et
regression models are re-estimated using two alternative strategies: replacing FDI spillover with a lagged spillover and adding a time varying industry specific variable. The results are not presented here to conserve space, however, can be obtained from the authors upon request. Empirical estimates from these two strategies confirm that the estimates in Table 3 do not suffer substantially from simultaneity bias.
VI. Conclusions and Policy Implications
This study empirically examines the level and growth effects of FDI spillovers on firm-level productivity in two highly disaggregated manufacturing industries (garment and electronics) of Indonesia. The results show that firms in the two selected industries receive different effects of FDI spillovers. A positive effect is evident for firms in the garment industry. In contrast, firms in the electronics industry obtain negative spillover effects. These findings validate the results in previous studies in Indonesia and elsewhere (Havranek and Irsova, 2011) regarding the importance of industry-specific characteristics in gaining FDI spillovers.
The decompositions of productivity growth reveal a difference in the growth pattern between the garment industry and the electronics industry. Productivity in the garment industry grew by 2.33 per cent per year between 1988 and 2000. In contrast, the electronics industry experienced negative productivity growth, with an annual average of -0.70 per cent. Technological change is found to be the major contributor for the productivity growth and productivity decline in garments and electronics industries, respectively. Scale efficiency change contributes not much but, on average, is positive for both industries. As for the technical efficiency change, the average is negative in the garment industry but it is close to zero in the electronics industry.
The findings from the growth effects of FDI suggest that the sources of productivity spillovers are not similar for firms in the two selected industries. In the garment industry, FDI generates a positive effect on TEC, TC and SEC. In the electronics industry, FDI contributes significantly negatively on TC and SEC, but it has no significant contribution on TEC. All of these findings are consistent and comparable with those of previous studies in Indonesia and elsewhere (Havranek and Irsova, 2011). These findings reassure that spillover effects from FDI spillovers on productivity growth are derived from technical and scale efficiencies as well as from technology. Our findings of different spillover effects FDI in different industries have important implications for the policy regarding FDI. Based on these findings, the policymakers should consider varying the incentive schemes for FDI across industries. A sector in which domestic firms receive positive FDI spillovers, such as the garment industry, needs to be a focus for a large number of incentives. In sectors that receive no spillover effects or, in particular, those that receive negative spillover effects, the policymakers should, at the minimum, ensure that the costs of providing incentives and the negative FDI spillovers do not overweigh the overall benefits of the FDI. Alternatively, there is a need to improve the absorptive capacity of domestic firms in these industries, such as the Indonesian electronics industry, as a fundamental condition to benefit from the knowledge externalities from foreign firms.
Acknowledgements
The authors are grateful to all anonymous referees as well as the editor of this journal for helpful comments and suggestions which tremendously improve the quality and presentation of this article. However, the usual disclaimer applies.
Notes
1. The garment sub-sector in this study is defined as an industry that produces clothes from textiles (ISIC 3221). 2. The OPEC fuel prices are converted from US$ values to Indonesia rupiah (IDR) using average yearly exchange rates
published by the central Bank of Indonesia in Statistics of Economic and Finance Indonesia (Statistik Ekonomi dan Keuangan Indonesiaor SEKI).
FDI Spillovers and Productivity Growth 1409
3. One might suspect that there is multicollinearity betweenFDIHorizontalvariable and Agevariable, as these two variables are plant-invariant variables. Pearson’s partial correlation test is applied to test the multicollinearity. It is found that the partial correlation between the two variables is 0.149 for garment industry and 0.349 for electronics industry. These results imply a possibility of a slight multicollinearity between the two variables in electronics industries. However, slight multicollinearity is not a problem as long as the correlation between independent variables in a model is lower than the correlation between each of the independent variables and the dependent variable (Klein, 1962; Gujarati, 2005).
4. The technical efficiency (TE) indexes are calculated from the estimates for all samples of garments in Table 1. Each firm at each time period has a unique TE index, and the averaged TE index for foreign and domestic firms are calculated using an arithmetic mean.
5. To check the robustness of the estimates in Table 1, the authors estimate an alternative model of the stochastic frontier method based on a two-stage approach of Cornwell et al.(1990). The estimates are consistent with the results in the main analysis, both for the full sample and for the sub-sample of domestic firms. However, the level of significance is lower in this two-stage approach, demonstrating that the power of estimations falls when the two-stage approach is applied. The two-stage approach has a well-known problem related to the assumption of one-sided TE, which may lead to inefficiency in estimation (Wang and Schmidt, 2002). The detailed results of this robustness check are available upon request.
6. Only estimates for all firms are shown. Separate estimates for domestic firms only, which are not statistically different, are available from the authors.
7. As argued in Liu (2008), the level effect of FDI spillovers reflects the long-run impact of FDI on firms’ productivities, while the growth effect pictures the short-run impact.
References
Aitken, B.J. and Harrison, A.E. (1999) Do domestic firms benefit from direct foreign investment? Evidence from Venezuela.American Economic Review, 89(3), pp. 605–618.
Aswicahyono, H., Atje, R. and Thee, K.W. (2005)Indonesia’s Industrial Competitiveness: A Study of the Garments, Auto Parts and Electronic Component Industries(Washington, DC: The World Bank).
Barrios, S., Go¨rg, H. and Strobl, E. (2011) Spillovers through backward linkages from multinationals: measurement matters!European Economic Review, 55(6), pp. 862–875.
Bartelsman, E.J. and Doms, M. (2000) Understanding productivity: lessons from longitudinal microdata.Journal of Economic Literature, 38(3), pp. 569–594.
Battese, G.E. and Coelli, T.J. (1995) A model for technical inefficiency effects in a stochastic frontier production function for panel data.Empirical Economics, 20(2), pp. 325–332.
Blalock, G. and Gertler, P.J. (2008) Welfare gain from foreign direct investment through technology transfer to local suppliers.Journal of International Economics, 74(2), pp. 402–421.
Blomstro¨m, M. (1986) Foreign investment and productive efficiency: the case of Mexico.Journal of Industrial Economics, 35(1), pp. 97–112.
Blomstro¨m, M. and Kokko, A. (1998) Multinational corporation and spillovers.Journal of Economic Surveys, 12(2), pp. 247–277.
Caves, R.E. (1971) International corporations: the industrial economics of foreign investment.Economica, 38(149), pp. 1– 27.
Caves, R.E. (1974) Multinational firms, competition and productivity in host country markets. Economica, 41(162), pp. 176–193.
Cornwell, C., Schmidt, P. and Sickles, R.C. (1990) Production frontiers with cross-sectional and time-series variation in efficiency levels.Journal of Econometrics, 46(1–2), pp. 185–200.
Dunning, J. (1988)Multinational, Technology and Competitiveness(London: Allen & Unwin).
Girma, S. and Go¨rg, H. (2007) The role of the efficiency gap for spillovers from FDI: evidence from the UK electronics and engineering sectors.Open Economies Review, 18(2), pp. 215–232.
Graham, P., Thorpe, S. and Hogan, L. (1999) Non-competitive market behaviour in the international cokery coal market. Energy Economics, 21(3), pp. 195–212.
Gujarati, D.N. (2005)Basic Econometrics, 5th ed. (Singapore: McGraw-Hill).
Haskel, J.E., Pereira, S.C. and Slaughter, M.J. (2007) Does inward foreign direct investment boost the productivity of domestic firms?Review of Economics and Statistics, 89(3), pp. 482–496.
Havranek, T. and Irsova, Z. (2011) Estimating vertical spillovers from FDI: why results vary and what the true effect is. Journal of International Economics, 85(2), pp. 234–244.
Hill, H. (1991) The emperor’s clothes can now be made in Indonesia.Bulletin of Indonesian Economic Studies, 27(3), pp. 89–127.
Javorcik, B.S. (2004) Does foreign direct investment increase the productivity of domestic firms? In search of spillovers through backward linkages.American Economic Review, 94(3), pp. 605–627.
Klein, L.R. (1962)An Introduction to Econometrics(Englewood Cliffs, NJ: Prentice-Hall).
Lapan, H. and Bardhan, P. (1973) Localized technical progress and transfer of technology and economic development. Journal of Economic Theory, 6(6), pp. 585–595.
Lipsey, R.E. and Sjoholm, F. (2005) The impact of inward FDI on host countries: why such different answers? in: T.H. Moran, E. Graham and M. Blomstro¨m (eds)Does Foreign Direct Investment Promote Development?(Washington, DC: Institute for International Economics and Center for Global Development), pp. 23–43.
Liu, Z. (2008) Foreign direct investment and technology spillovers: theory and evidence. Journal of Development Economics, 85 (1–2), pp. 176–193.
Pangestu, M. (1996)Economic Reform, Deregulation, and Privatization: The Indonesian Experience(Jakarta: Centre for Strategic and International Studies).
Rodriguez-Clare, A. (1996) Multinationals, linkages, and economic development.American Economic Review, 86(4), pp. 852–872.
Sjoholm, F. and Lipsey, R.E. (2006) Foreign firms and Indonesian manufacturing wages: an analysis with panel data. Economic Development and Cultural Change, 55(1), pp. 201–221.
Suyanto, Salim, R.A. and Bloch, H. (2009) Does foreign direct investment lead to productivity spillovers? Firm level evidence from Indonesia.World Development, 37(12), pp. 1861–1871.
Thee, K.W. (2006) Policies for private sector development in Indonesia. ADB Institute Discussion Paper No. 46. UNCTAD (2009)World Investment Report 2009(New York and Geneva: United Nations).
Wang, H.J. and Schmidt, P. (2002) One-step and two-step estimation of the effects of exogenous variables on technical efficiency level.Journal of Productivity Analysis, 18(2), pp. 129–144.
Wang, J.Y. and Blomstro¨m, M. (1992) Foreign direct investment and technology transfer.European Economic Review, 36(1), pp. 137–155.
FDI Spillovers and Productivity Growth 1411
foreign direct investment
spillovers and productivity
growth in indonesian garment
and electronics manufacturing
by
2 Suyanto
Submission dat e :
27- Mar- 2018 04:34PM (UT C+0700)
Submission ID:
936918953
File name :
III.1.C.1.3_asli.pdf (160.33K)
Word count :
8724
FINAL GRADE
/100
foreign direct investment spillovers and productivity growth
in indonesian garment and electronics manufacturing
GRADEMARK REPORT
GENERAL COMMENTS
Instructor
PAGE 1
PAGE 2
PAGE 3
PAGE 4
PAGE 5
PAGE 6
PAGE 7
PAGE 8
PAGE 9
PAGE 10
PAGE 11
PAGE 12
PAGE 13
PAGE 14
PAGE 15
34
%
SIMILARIT Y INDEX
30
%
INT ERNET SOURCES
25
%
PUBLICAT IONS
19
%
ST UDENT PAPERS
1
6
%
2
2
%
3
2
%
4
2
%
5
1
%
6
1
%
7
1
%
8
1
%
9
1
%
foreign direct investment spillovers and productivity growth
in indonesian garment and electronics manufacturing
ORIGINALITY REPORT
PRIMARY SOURCES