Corresponding author:
*E-Mail: [email protected]
HYPOCENTER DISTRIBUTION OF LOW-FREQUENCY
EVENT AT PAPANDAYAN VOLCANO
Muhammad Mifta Hasan1*, Hetty Triastuty2, Bagus Jaya Santosa1, Amien Widodo3 1
Physics Department, Faculty of Mathematics and Science, Sepuluh Nopember Institute of Technology, Jl. Arief Rahman Hakim, Surabaya 60111
2
Center for Volcanology and Geological Hazard Mitigation, Jl. Diponegoro No. 57 Bandung 40122
3
Geophysical Engineering Department, Faculty of Civil Engineering and Planning, Sepuluh Nopember Institute of Technology, Jl. Arief Rahman Hakim, Surabaya 60111
Recieved: 19th August 2016; Revised: 6th September 2016; Accepted: 31th October 2016
ABSTRACT
Papandayan volcano is a stratovolcano with irregular cone-shaped has eight craters around the peak. The most active crater in Papandayan is a Mas crater. Distribution of hypocenters calculated using Geiger Adaptive Damping Algorithm (GAD) shows that the epicenter of the event centered below Mas crater with maximum RMS 0.114. While the depth of the hypocenter range between 0-2 km and 5-6 km due to the activity of steam and gas.
Keywords: Papandayan; Geiger adaptive damping; low-frequency
Introduction
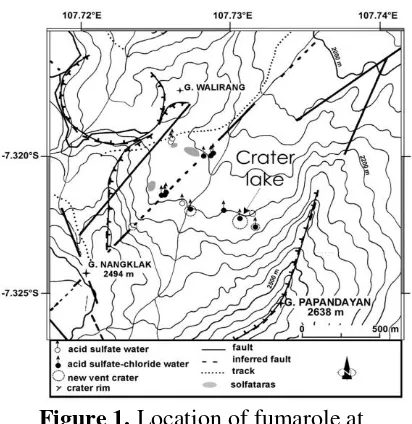
Papandayan volcano located at 7°19’00" S and 107°44’00" E with 2.665 m height. Papandayan was stratovolcano with classified A type.1 The volcano shapeis irregular cone-like that cut on the top. This shape affected by composition of lava flow and debris avalanche.2 There are eight craters on the Papandayan volcano, Bungbrung, Tegal Alun-alun, Parugpug, Papandayan, Mas crater, Baru crater, Nangklak crater and Manuk crater. After eruption on november 2002, it was formed 4 new craters (Figure 1). Only one crater was not filled with water, and the others were filled with water mixed by mud, bluish-green water and green water.3
Papandayan also an andesitic volcano which located on west java. Sunda magmatic was formed by the movement of Indo-Australia plate and Eurasia plate to the north. Hydrothermal is the most common activity at Papandayan volcano. It has crater whose horseshoe-like shape with diameter 1.6 km.4 Volcanic structure composes with andesitic
lava accumulated by pyroclastic deposit with the change between basalt and andesitic lava.5
Hydrothermal activity was shown by fumarole manifestation indicated gas emission, sulfate mud pool, and several
Figure 1. Location of fumarole at Papandayan volcano. Fault and crater arised
Copyrigh © 2016, Jurnal Neutrino:Jurnal Fisika dan Aplikasinya, ISSN:1979-6374/ EISSN:2460-5999
opening at Mas crater, Manuk crater, Nangklak crater, and Baru crater. An Indication of water at Papandayan volcano
(except magma) denotes dynamical activity at Papandayan. Therefore, Papandayanis well-known wet volcano.4
Methods
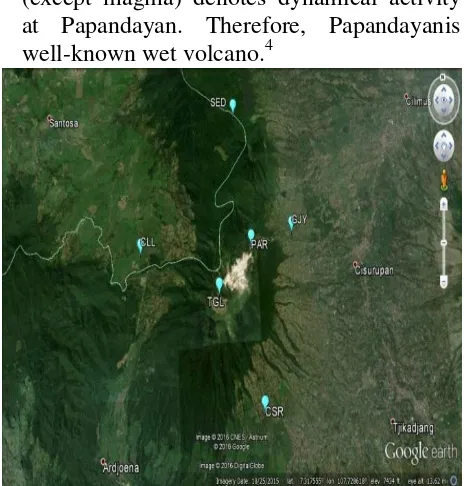
In this research, data recorded of Low-frequency events (LF) between 1 – 15 September 2015. Used 6 seismometers, Guralph CMG-40T and Guralph CMG-3T with sampling frequency100 sample/s (Figure 2). Installation of Seismometers located beneath surface with 80-100 cm depth.
Location of seismometers was (Table 1) Cileuleuy (CLL), Cisaruni (CSR), Gunung Jaya (GJY), Parkir (PAR), Sedep (SED) and Tegal Alun (TGL) (Figure 3).
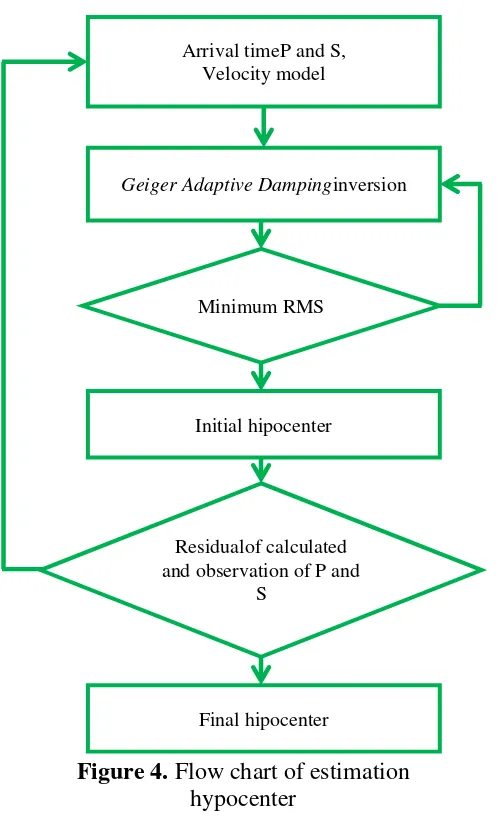
The Hypocenter of LF events was calculated using Geiger Adaptive Damping (GAD) algorithm.6 This method was a
modification of Geiger with an automatic damping factor on its inversion in order to get solution convergence. The following equation of inversion,
𝑚= 𝐺𝑇𝐺+𝜆𝐼 −1𝐺𝑇𝑑 (1)
Where 𝐺 kernel matrice is the first order of partial differential of travel time equation with hypocenter parameter. 𝜆 is the damping factor, 𝐼 is identity matrix and 𝑑 is observation data. Flow chart of GAD algorithm was shown in Figure 4.
Determination of hypocenter was influenced by the accurate of arrival time picking on P and S wave also good velocity model beneath Papandayan volcano. Velocity model used in this work based on Kristianto3 velocity model (Table 2).
Table 1. Seismometers around Papandayan
No Seismometers Lat Lon
Figure 2. Instalation of seismometers CMG-40T at Sedep (SED).
Figure 4. Flow chart of estimation hypocenter
Result and Discussion
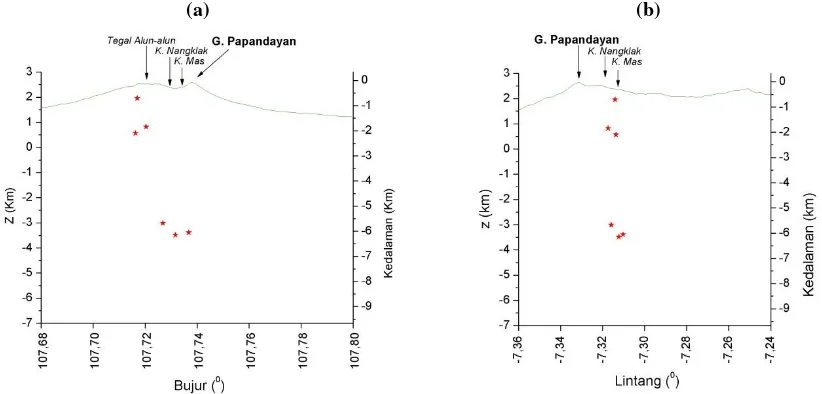
The results of inversion using GAD algorithm showed the variation of RMS between 0.020 and 0.114 (Table 3). Distribution of hypocenter based on depth divided into two groups. First, the depth between 0-2 km and second, 5-6 km.The following distribution of hypocenter is figure out in Figure 5 and Figure 6.
Figure 5. The epicenter of LF events at Papandayan.
In Geiger method, a solution of inversion difficult to be convergent, although initial guess of hypocenter parameter has good accuration.7 A solution of convergence problem using a damping parameter in inversion for minimizing instability of parameter solution and decreasing error in predicting data and inverting solution.8
Menke9 suggested in providing a damping parameter must give full attention in order to obtain good inversion solution. Solving this problem, Nishi9 proposed automatic damping parameter for decreasing RMS. It shows the maximum RMS of hypocenter attained only 0.114 (Table 3).
Minimum RMS
Geiger Adaptive Dampinginversion
Arrival timeP and S, Velocity model
Initial hipocenter
Residualof calculated and observation of P and
S
Final hipocenter
Table 3. Hipocenters of LF events.
No Date Magnitude Lattitude Longitude Depth (km) Origin Time (s) RMS
1 01-09-2015 07:23
0.245 7.314 107.717 0.707 9.041 0.114
2 07-09-2015 08:56
0.245 7.310 107.737 6.054 24.417 0.123
3 10-09-2015 07:54
0.789 7.316 107.727 5.673 9.565 0.022
Copyrigh © 2016, Jurnal Neutrino:Jurnal Fisika dan Aplikasinya, ISSN:1979-6374/ EISSN:2460-5999
(a) (b)
Figure 6. a. Cross-section profile of hypocenter east-west. b. Cross-section profile of hypocenter north-south.
Triastuty11 mentioned that Mas crater is the most active crater with Nangklak inside it with LF events generated by steam and gas in the fracture zone (Figure 5). Depth of hypocenter divided into two groups, 0.5-2 km4 and 2.5-4 km.11 Figure 6 shows the depth of hypocenter between 0-2 km and 5-6 km. These are consistent with previous research although having different depth span. The differences were caused by interpretation in picking arrival time of P and S wave.10
Conclusion
LF events at Papandayan distributed beneath Mas crater and Nangklak crater with the depth between 0-2 km and 5-6 km. These occurence can be interpreted as the activity of water, steam, and gas.
Acknowledgment
The Data of Low-Frequency events supported by Center for Volcanology and Geological Hazard Mitigation (CVGHM).
References
1. PVMBG. Data Dasar Gunungapi : Gunung Papandayan [Internet]. BADAN GEOLOGI. 2013 [cited 2016 Feb 22]. Monitoring of Indonesian Volcanoes Using Repeated GPS Survey Method : Status and Plan. Proceeding of Symposium on Japan-Indonesia IDNDR Project Volcanology, Tectonics, Flood and Sediment Hazards, September 21-23, Bandung, Indonesia.
3. Kristianto, 2005. Studi Seismik Tomografi Pada Kasus Gunungapi Papandayan. Tesis. Institut Teknologi Bandung.
4. Syahbana DK, Caudron C, Jousset P, Lecocq T, Camelbeeck T, Bernard A, et al. Fluid dynamics inside a “wet” volcano inferred from the complex frequencies of long-period (LP) events: An example from Papandayan volcano, West Java, Indonesia, during the 2011 seismic unrest. J Volcanol Geotherm Res. 2014 Jun 1;280:76–89.
eruption. J Volcanol Geotherm Res. 2008 Dec 10;178(2):276–86.
6. Nishi K. Hypocenter Calculation Software GAD (Geiger’s method with Adaptive Damping). 1st ed. Silver Expert JICA Indonesia; 2005.
7. Lay T, Wallace TC. Modern Global Seismology. San Diego: Academic Press; 1995.
8. Grandis H. Pengantar Pemodelan Inversi Geofisika. Jakarta: HAGI; 2009.
9. Menke W. Geophysical Data Analysis: Discrete Inverse Theory, Volume 45, Third Edition: MATLAB Edition. 3 edition. Waltham, MA: Academic Press; 2012. 330 p.
10. Romero JE, Titos M, Bueno Á, Álvarez I, García L, Torre Á de la, et al. APASVO: A free software tool for automatic P-phase picking and event detection in seismic traces. Comput Geosci. 2016 May;90, Part A:213–20. 11. Triastuty H, Iguchi M, Tameguri T.
Source Mechanism of Monochromatic and Low-Frequency Events at Papandayan volcano, West Java, Indonesia. Indones J Phys [Internet]. 2006 [cited 2016 Feb 22];17(3).
Available from: