1. Lecturer in Department of Civil Engineering, Sam Ratulangi University, Manado 95115, Indonesia
2. Professor of Geotechnical Engineering, Department of Architecture and Civil Engineering, Fukui University, 3-9-1, Bunkyo, Fukui, 910-8507 JAPAN
3. Soil and Rock Engineering Co. Ltd., 2-21-1, Shonai-Sakae, Toyonaka, Osaka, 561-0834 JAPAN Abstrak
Sekalipun uji konsolidasi kecepatan regangan tetap (CSRC) memperlihatkan sebagai salah satu tipe yang menjanjikan dari uji konsolidasi cepat, ketergantungan waktu pada respons tegangan-regangan seperti pemampatan sekunder belum cukup menjelaskan terhadap uji CSRC. Berdasarkan pembentukan kembali tanah lempung muda, paper ini menunjukan perilaku ketergantungan waktu yang besar dari uji konsolidasi standar (SC) dan CSRC, dijelaskan secara sistimatis dengan asumsi sederhana yakni ketergantungan waktu dilatansi. Pada uji SC tahapan awal dari tiap penambahan beban ada sedikit dilatansi dan dilatansi mulai terjadi beberapa menit setelah step pembebanan. Pada akhir dari masing-masing langkah pembebanan, dilatansi terjadi secara proporsional dengan pertambahan logaritma waktu, dimana dapat diamati sebagai pemampatan sekunder. Pada uji CSRC, beberapa periode waktu setelah keadaan tegangan memasuki daerah konsolidasi normal, dilatansi cenderung terjadi secara cepat dengan pertambahan ratio tegangan. Sejak sebagian besar dilatansi terjadi pada tahap awal konsolidasi, sedikit dilatansi terjadi diakhir tahapan proses CSRC. Kecendrungan ini membuat spesimen lebih kaku dengan perjalanan waktu, dan membuat tegangan vertikal dan tegangan pori bertambah cukup besar pada bagian akhir proses CSRC. Penentuan perilaku tersebut dapat efektif dijelaskan dengan benar pada hasil uji CSRC.
Kata-kata kunci : Lempung, uji konsolidasi, dilatansi, pemampatan sekunder, efek waktu.
Abstract
Although the constant strain rate consolidation (CSRC) test appears to be one of the most promising types of rapid consolidation test, the time dependency in stress-strain response such as the secondary compression has not been sufficiently clarified yet in CSRC test. Subjected to remolded young clay, this paper shows that a lot of time dependent behavior in the standard consolidation (SC) and CSRC tests is represented systematically by a simple assumption concerning the time dependency of dilatancy. In the SC test, at the first stage of each loading step little dilatancy takes place and dilatancy begins to occur several minutes after step loading. At the latter of each loading step, dilatancy occurs proportionally with the logarithm of elapsed time, which is observed as the secondary compression. In CSRC test, some time period after the stress state has entered the normally consolidated region, dilatancy tends to occur rapidly with the increase in stress ratio. Since most of dilatancy has taken place at the earlier stage of consolidation, little dilatancy occurs at the latter stage of CSRC process. This tendency makes the specimen stiffer with the passage of time, and makes the vertical pressure and pore pressure increase substantially at the last stage of CSRC process. Consideration to such behavior may be effective to correctly interpret the result of CSRC test.
Keywords: Clay, consolidation test, dilatancy, secondary compression, time effect.
Dilatancy Behavior in Constant Strain Rate Consolidation Test
Berty Sompie1) Katsuhiko Arai2) Akira Kita3)
TEKNIK
SIPIL
1. Introduction
The constant strain rate consolidation (CSRC) test appears to be one of the most promising types of rapid consolidation test, because of its simple manipulation and reliability. A lot of research studies have enabled to get the void ratio-vertical effective stress relationship, coefficient of volume compressibility and
dependency in stress-strain response such as the secondary compression has not been sufficiently clarified yet in CSRC test. Although Leroueil et al (1985) and Yin and Graham (1988) practiced various types of oedometer tests including CSRC test and proposed a unique stress-strain rate relationship, the rheological for CSRC process itself are not explained in detail. Previously the second author (1994) has shown that both many time effects observed in triaxial test and the secondary compression in standard consolidation test are realistically simulated by a numerical procedure based on a simple postulate concerning the time dependency of dilatancy. This paper applies the numerical procedure to CSRC test, and aims to clarify the time dependent behavior of soft clay in CSRC test. As the initial step of research study, our concern was restricted to only the stress-strain-time behavior observed in remolded young clay, and the infinitesimal strain theory is used.
2. Preliminary Definitions
Fundamental Parameters: For the K0-consolidation
process, a stress state is described by mean effective stress p′n and stress difference qn:
and the corresponding strains are
σv′n, σh′n: vertical and horizontal effective stresses, εvn:
vertical strain, and n : a discretized time step number. Hereafter regard normal stresses as effective stresses unless otherwise defined. The term qn / p′ n is referred to ‘stress ratio’.
Time Dependency of Dilatancy: When neglecting time
dependency, volumetric strain due to dilatancy vnd is
reprented as (see Shibata, 1963, and Otha, 1971)
in which D: dilatancy coefficient, λ = 0.434Cc (Cc:
compression index), κ= 0.434Cs (Cs: swelling index),
e0: initial void ratio, and M: slope of critical state line.
When the stress state within clay specimen changes with the passage of time, it is assumed that volumetric strain due to dilatancy vnd takes place as
where ∆tn: length of discretized time step, t1n: elapsed time after stopping
the increase in the stress ratio, T: time length required to make dilatancy take place completely, and ∆: increment of succeeding physical quantity. The physical meaning of Equations (4) and (5) is given in Arai (1994). Equation (4) is not sufficient to duplicate the dilatancy behavior for a sudden increase in shear stress. When a shearing process originates in almost static state where the stresses and strain are approximately constant with the passage of time, for instance, the final stage of consolidation, it is assumed that little dilatancy is generated at the early stage of shear until the value of vnd calculated by Equation (4)
exceeds a certain prescribed value v*d. The value of v*d
is easily determined by using the effective stress path in conventional triaxial test (Arai, 1985). The early stage of shear where little dilatancy takes place, is called ‘quasi-elastic state’. Summarizing the above assumption, the time dependency of dilatancy is illustrated schematically as in Figure 1.
Elastic and Plastic Strain: The volumetric strain given
by Equation (4) is assumed perfectly plastic. Incremental volumetric strain due to consolidation ∆
vnc is supposed to be the sum of elastic component ∆
3. Test Procedure
The soil used for consolidation tests is the remolded Ota clay in Fukui Prefecture, Japan, which has the following index properties: specific gravity, 2.67; liquid limit, 53.2%; plastic limit, 25.4%; clay fraction, 60%; silt fraction, 36.7%; and fine sand fraction, 3.3%. The clay was mixed with water into slurry (moisture content = 72 %) and consolidated under the preconsolidation pressure of 98 kPa in a consolidometer. After being stored for more than 2 weeks, a test specimen with 20 mm in height and 60 mm in diameter was carefully trimmed from the preconsolidated cake which was fully saturated. Subsequently two types of consolidation test were performed separately, i.e. the standard consolidation and CSRC tests. The consolidation test was carried out according to the Japanese Industrial Standard A1217.
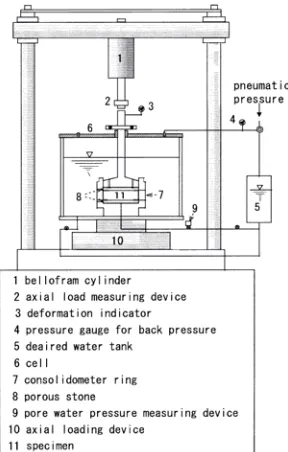
The loading pressures were applied step-by-step as 9.8-19.6-39.2-78.4-156.8-313.6-627.2-1254.4 kPa, each of which was maintained constant for 24 hours. CSRC test was carried out under the specified strain rates of 0.1, 0.05 and 0.01 %/min. CSRC test was performed by the equipment shown in Figure 2. During CSRC process we did not control the strain rate itself but deformation rate. The upper and lower surfaces of specimen are the permeable and impermeable boundaries respectively. Pore water pressure is monitored at the bottom of specimen. After setting a test specimen into oedometer and after introducing the back pressure of 98 kPa, the specimen was consolidated by the vertical constant pressure of 9.8 kPa for 24 hours under the anisotropic -condition. This preconsolidation process seems essential for bringing the test specimen into complete contact with
the loading plate (Sompie B, Arai, K and Machihara, H, 2001).
4. Numerical Analysis
Discretization Technique: despite treating K0
-consolidation here, we employ a finite element technique for two-dimensional consolidation analysis developed by Akai and Tamura (1978), because the technique seems to have attained to a sufficiently reliable and popular stage. A consolidation test specimen subjected to analysis is subdivided into rectangular finite elements as shown in Figure 3. The rectangular element is considered to be composed of four triangular elements, and the stresses, strains and pore water pressure are assumed to be constant throughout each rectangular element.
Nonlinear Stress-Strain Analysis: our concern is to solve the following two equations as a simultaneous equation, without using the plastic flow rule. One is an equation for specifying a volumetric strain due to consolidation and dilatancy (Equation 9). The other is an equation which specifies a shear strain (Equation 10). Assuming that ∆p′n and ∆qnare given at a time step, the volumetric strain is calculated as the sum of the components due to consolidation and dilatancy, according to Otha (1971).
For the K0-consolidation process, the shear strain is
given as
Using ∆vn and ∆εn,
Figure 2. Equipment of CSRC test Figure 3. FE meshing of test specimen
hypothetical bulk modulus Knand shear rigidity Gn are calculated as
Based on Kn and Gn, hypothetical Young’s modulus,
En and Poisson’s ratio, υnare
The detailed reduction is given by Arai (1994). These hypothetical elastic constants enable to relate all the stress components to strain component respectively without using the plastic flow rule.
Numerical Procedure:
1. Assume the trial values of hypothetical Young’s modulus En and Poisson’s ratio υn.
2. Using the assume En and υn and known permeability kn, perform the elastic consolidation analysis at a discretized time step. In the consolidation analysis, the displacements are specified for CSRC test and the loads are given for the standard consolidation test at the prescribed boundaries.
3. Employing the incremental stresses obtained by the consolidation analysis, the incremental volumetric and shear strains are calculated respectively from Equations (9) and (10).
4. Based on these strains, find the hypothetical elastic constants by using Equations (11) and (12).
5. Replacing the trial values of En and υn with those found at step repeat the consolidation analysis until convergence of elastic constant is obtained.
This iterational procedure is practiced for each discretized time step.
1 10 100 1000 10000
ver t i cal consol i dat i on pr essur e ( kPa)
Figure 4. e - logσ′vrelationship observed
1. 0E- 05
1 10 100 1000 10000
v er t i c al c ons ol i dat i on pr es s ur e ( kPa)
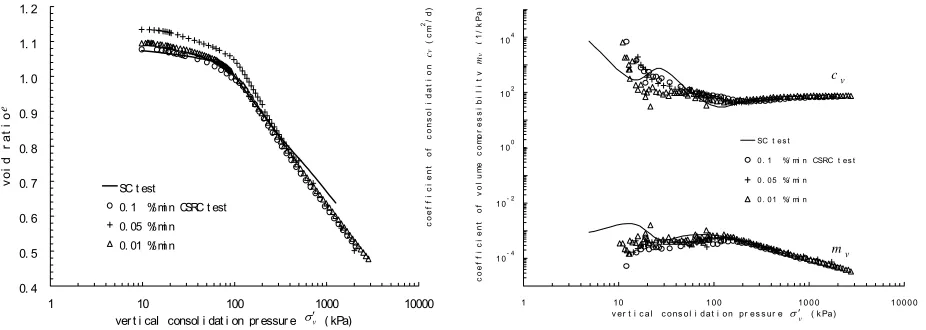
5. Experimental and Numerical Results
Material Parameters: In The standard consolidation and CSRC tests, void ratio e, effective and vertical consolidation pressure σ′v, coefficient of volume
compressibility mv, and coefficient of consolidation cv
are calculated according to JIS (Japanese Industrial Standard) A1217 and JSF (Japanese Soil and Foundation) T412-1993 respectively. Figure 4 shows
e-logσ′v relationship obtained by these two types of
consolidation test, in which the consolidation yield stress is affected in some degree by the strain rate. Figure 5 shows mv and cvobtained by the two types of
consolidation test which appear to provide similar tendency. Figure 6 illustrates the relationship between e and permeability k (cm/s) which is calculated from cv
and mv. As shown in Figure 6, the two types of
consolidation test seem to give a similar e - log k
relationship. Except for exceedingly loose state, the relationship is approximately represented as:
Though it is not easy to find the correct permeability of cohesive soil due to many factors affecting the permeability (e.g. Murakami, 1987 and Nagaraj et al, 1994), we employ the above relationship which provides the reasonable numerical results given later. The consolidation yield stress is regarded as pc =
(98+2K098)/3 = 63 kPa, where K0 -value is taken as
0.464, which is monitored by some K0-consolidation
tests using a triaxial equipment at the normally consolidated region (Arai, 1994). Based on these results, the material parameters required for our numerical analysis are determined as λ = 0.16, κ = 0.033, M=1.13, D=0.056, T= 14 days, v*d= 0.004, e0=
1.04, and Equation(13). The value of κ, M, and v*d are
Initial State: Our numerical analysis treats the stress-strain response after placing a test specimen into oedometer. It is difficult to estimate the residual effective stresses or negative pore water pressure which remains within the specimen, since is not easy to specify completely the stress history of the specimen until the specimen is placed into oedometer. Some preliminary calculations have proven that the residual stresses may not largely effect our numerical results, when the residual stresses are represented only by the mean effective stress, and when the mean effective stress is 20 and 60 % of mean preconsolidation pressure. We assume that 40 % of mean effective stress in consolidometer remains isotropically within the specimen before starting the consolidation test, together with the same value of negative pore water pressure. It is also difficult to estimate the history of dilatancy before placing a test specimen into oedometer, because is not easy to evaluate the dilatancy amount of slurry sample in consolidaometer, and because the consolidated sample expands both vertically and laterally when taken out from the consolidometer. As the first approximation, on the analogy of the residual effective stresses described above we assume that the dilatancy estimate by Equation (3) has taken place almost entirely in consolidometer, and that 40 % of dilatancy amount remains within the test specimen in oedometer. This rough approximation provides fairly good numerical results, and that the numerical results are not so sensitive to the dilatancy amount before placing the specimen into oedometer (Kita, A, Arai, K, Machihara, H, and Sompie, B, 1998).
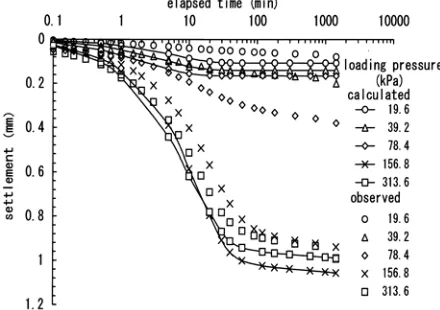
Standard Consolidation Test: Figure 7 compares the
experimental and numerical results of time-settlement relationship in the standard consolidation test. The numerical result appears to agree fairly well with the experimental one, except for the loading pressure of 78.4 kPa, since we assume that no plastic component of volumetric strain takes place at the over-consolidated state. In this paper, only the stress ratio, volumetric strain and hypothetical elastic constant, En
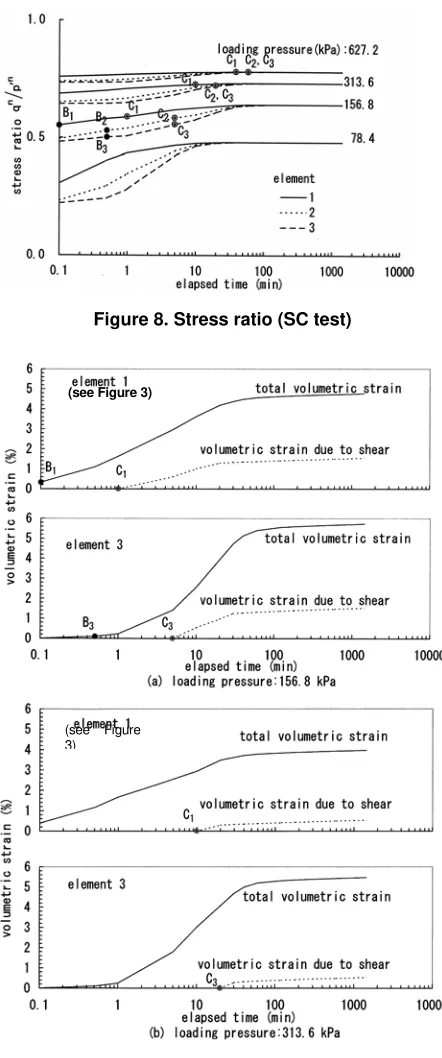
and Poisson’s ratio, υn during consolidation are illustrated in Figures 8 through 10 for comparing with the result of CSRC test. In Figures 8 through 10 and in Figure 12 through 17 shown later, Bidenotes the
point at which the stress state moves to the normally consolidated region, and di designates the point at
which dilatancy begins to occur both in finite element i. As seen in Figure 9, at the first stage of each loading step, the state of the specimen enters the quasi-elastic state illustrated in Figure 1, where no dilatancy takes place. A little time after each step loading, the volumetric strain due to dilatancy begins to occur. Although the stress ratio becomes almost constant at the latter stage of each loading step as shown in Figure 8, the ratio continues to increase very slightly with the passage of time. Referring to Figures 7 through 9, the secondary compression observed at the latter stage of standard consolidation test, is represented by the dilatancy occurrence according to nearly constant stress ratio, which take place proportionally with the logarithm of elapsed time. Figures 9 and 10 indicate the following tendency of hypothetical Young’s modulus En. After the stress state moves to normally consolidated region, En decreases suddenly due to the occurrence of vncp. Subsequently En increases
gradually with the progress of consolidation. The occurrence of dilatancy reduces En substantially, because the volumetric due to dilatancy increases whereas the effective vertical stress little increases at latter stage of each stage of each loading step. Whether dilatancy occurs or not, En approaches 0 at the final stage of each loading step, because the effective stresses reach the constant values in spite of the slight increase in volumetric strain. Hypothetical Poisson’s ratio, υnis hold constant throughout the consolidation process shown in Figure 10.
Constant Strain Rate Consolidation (CSRC) test: After setting a test specimen into oedometer, the specimen is consolidated by the total vertical pressure of 9.8 kPa for 24 hours under K0 -condition. Following this
preconsolidation process, CSRC test is carried out
1. 0E- 09
under a certain strain rate prescribed. Thus our numerical analysis is performed by two separate stages, i.e. the preconsolidation process for which the preconsolidation pressure of 9.8 kPa is specified, and CSRC process for which a displacement is prescribed at the upper surface of specimen at each discretized time step. The initial state for preconsolidation process is the same as the initial state for the standard consolidation test described previously. The final state for preconsolidation process corresponds to the initial state for CSRC process. Note that at the final state of the preconsolidation process, vertical stress σ′v (= 9.8
kPa) is less than lateral stress σ′h (= 18.03 kPa), due to
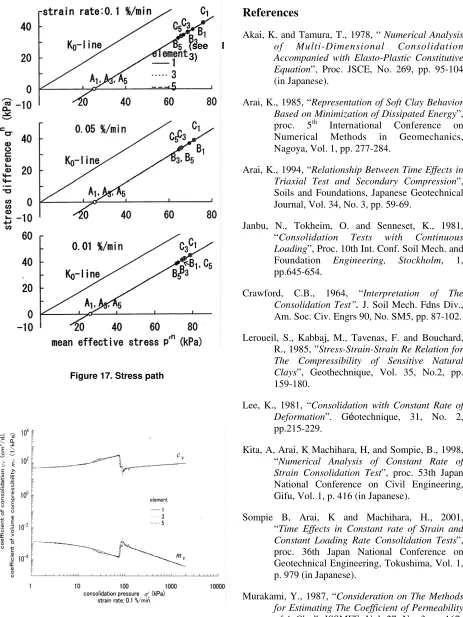
the isotropic initial stresses of 24 kPa for the preconsolidation process. Figure 11 makes comparison between the calculated and monitored quantities for CSRC process, according to the strain rate. As seen in Figure 11, the prescribed and monitored displacements at the upper surface of specimen are slightly different from each other due to the limitation of displacement control system. In our numerical analysis, the actually monitored displacement is given at each discretized time step. Thus the fluctuation from prescribed displacement causes the fluctuation of physical quantities calculated by the proposed procedure (for instantce, see Figures 11, 12, 14, 15 and 16 given later). As shown in Figure 11, both the calculated loading pressure, displacement and pore water pressure appear to agree fairly well with the monitored results. Figures 12 through 17 illustrated some of the detailed numerical results upon which the calculated results shown in Figure 11 are based. Though it is not possible to compare directly these detailed numerical results with monitored ones, these numerical results enable to interpret conscientiously the soft clay behavior during CSRC process, which is described as follows. In Figures 14 through 17, vertical stress σ′v is less than lateral stress
σ′h until point Ai, where suffix i denotes finite element
number. From the initial state to point Ai, qn increases
as shown in Figure 17 because σ′v approaches
gradually σ′h, resulting in increase qn / p′n as shown in
Figure 14. At this state, Poisson’s ratio is kept constant and En increases slightly with the progress of consolidation. ∆qn / ∆p′n is hold constant throughout CSRC process as illustrated in Figure 17. This makes
qn or σ′v increase, and makes En increase as shown in
Figure 16 because of the small total volumetric strain which consists of only vnce. Note that the constant
value of ∆qn / ∆p′n pnprovides constant Poisson’s ratio of 0.317 after passing point A as shown in Figure 16. Although ∆qn / ∆p′ n is constant for CSRC process, stress ratio qn / p′n varies as illustrated in Figure 17, and approaches to the following value as shown in Figure 14.
In Figures 12 through 17, at point Bi, the stress of
element I moves to the normally consolidation region. Immediately after passing point Bi, the state enters the
quasi-elastic state at which vnce and vncp take place.
This transition causes the reduction of En as in Figure 16 because of the considerable increase in volumetric strain, which restrain the increase qn or stress ratio qn / p′n as shown in Figure 14.
The duration of quasi-elastic state is short in this case, because the stress ratio tends to increase rapidly for CSRC process. Thus the quasi-elastic state may not give a substantial effect to the global behavior of CSRC specimen. Immediately after the state of specimen has removed from the quasi-elastic state (point Ci in Figures 12 through 17, volumetric strain
due to dilatancy vnd reduces En as shown in Figure 16.
Subsequently En tends to increase gradually, because the occurrence of dilatancy becomes smaller with the passage of time as shown Figure 15. Note that we assume that the total amount of dilatancy is limited by Equation (3) as illustrated in Figure 15. Since most of dilatancy has taken place at the earlier stage of consolidation, little dilatancy occurs at the latter stage of CSRC process. This means that larger effective stresses are required to produce the constant volumetric strain at the latter stage where the volumetric strain consist of almost only vnce and vncp.
This tendency makes the specimen stiffer with time (see Figure 16) and makes loading pressure and pore water pressure increase substantially as illustrated in Figure 11. Being similar with the standard consolidation test, when the increasing rate of stress ratio is less than 10-3/min, Equation (5b) is employed instead of Equation (5a). This treatment is applied only to the initial and last stages where dilatancy takes place for strain rate = 0.01 %/min, since the loading pressure for stress ratio continues to steadily increase in most stages of CSRC process. In Figures 12 through 17, the difference of physical quantities in each finite element is remarkable for strain rate = 0.1 %/min due to less uniform distribution of pore water pressure within a specimen, while the difference seems almost negligible for 0.01 %/min (see Figure 13). When the strain rate is too fast, and when the difference of physical quantities within a specimen is larger as seen in Figures 14, 15, and 16, the overall material parameters obtained from CSRC test which are supposed constant within a test specimen, may tend to fluctuate largely. For instance, Figure 18 shows mv and cv in each finite element calculated by
using hypothetical elastic constants En and υn. The general agreement between Figures 18 and Figure 5, indicates the appropriateness of the proposed procedure. The difference of in each finite element as shown in Figure 16, appears to provide the unstable variation of overall mv and cv as shown in Figure 5
which are assumed constant within a specimen,
(
)
(
0) (
2 0)
3n n
v v v v
Figure 8. Stress ratio (SC test)
especially for the over-consolidated ratio. The secondary compression coefficient is defined for
nearly constant stress ratio such as the latter stage of each loading step in standard consolidation test as illustrated in Figure 8. it may be difficult to find directly the secondary compression coefficient by using CSRC process, and because most of dilatancy has taken place when the stress ratio becomes approximately constant at the last stage of CSRC test as shown in Figures 14 and 15.
6. Concluding Remarks
Subjected to remolded young clay, this paper has shown that a lot of time dependent behavior in the standard consolidation and CSRC tests is represented by a simple assumption concerning the time dependence of dilatancy. This paper assumes the time dependency of dilatancy as shown in Figure 1 and Equations (4) and (5). The behavior in the standard consolidation test is as follows. At first stage of each loading step the state of specimen is at the quasi-elastic state where no dilatancy take place. A little time after step loading, dilatancy begins to occur. Because the stress ratio becomes approximately constant at the latter stage of each loading step, dilatancy occurs proportionally with the logarithm of elapsed time, which is observed as the secondary compression.
The dilatancy behavior in CSRC test is as follows. When the stress state enters the normally consolidation region, the state moves to the quasi-elastic state. Since the duration of quasi-elastic state is short in CSRC test, the state does not give a dominant effect to the global behavior of test specimen. Some time period after the stress state has entered the normally consolidated region, dilatancy tends to occur rapidly with the increase in stress ratio. Since most of dilatancy has taken place at the earlier stage of consolidation, little dilatancy occurs at the latter stage of CSRC process. This tendency makes the specimen stiffer with the passage of time, and makes the vertical pressure and pore pressure increase substantially at the last stage of CSRC process. Considerations to such behavior may be effective to correctly interpret the result of CSRC test. The secondary compression coefficient is defined for nearly constant stress ratio such as the latter stage of each loading step in standard consolidation test. It may be difficult to find directly the secondary compression coefficient by using CSRC test, because the stress ratio continues to considerably change throughout CSRC process, and because most of dilatancy has taken place when the stress ratio becomes approximately constant at the last stage of CSRC test. The assumption of time dependency of dilatancy enables to simulate many time effects in standard consolidation and CSRC tests. However, by
using only this assumption, it is not possible to simulate the time dependent behavior such as the change of consolidation yield stress according to the loading duration in the standard consolidation test or the strain rate in CSRC test. Although such behavior may be deeply related to time dependency of dilatancy, it may require another assumption concerning the time dependency of volumetric strain due to isotropic consolidation, which is an important subject to be investigated in the future study.
(see Figure 3)
(see Figure 3)
(see Figure 3)
Figure 10. Hypothetical elastic constants (SC test)
Figure 11. Comparison between calculated and monitored results (CSRC Test)
(s e e
Figure 13. Distribution of pore water pressure in CSRC test
(see Figure
Equation
Equation
Equation
Figure 14. Stress ratio
(see Figure 3)
Figure 15. Components of volumetric strain
(see Figure 3)
(see F 3)
Figure 17. Stress path
Figure 18. me and cv calculated
References
Akai, K. and Tamura, T., 1978, “ Numerical Analysis of Multi-Dimensional Consolidation Accompanied with Elasto-Plastic Constitutive
Equation”, Proc. JSCE, No. 269, pp. 95-104
(in Japanese).
Arai, K., 1985, “Representation of Soft Clay Behavior
Based on Minimization of Dissipated Energy”,
proc. 5th International Conference on Numerical Methods in Geomechanics, Nagoya, Vol. 1, pp. 277-284.
Arai, K., 1994, “Relationship Between Time Effects in
Triaxial Test and Secondary Compression”,
Soils and Foundations, Japanese Geotechnical Journal, Vol. 34, No. 3, pp. 59-69.
Janbu, N., Tokheim, O. and Senneset, K., 1981,
“Consolidation Tests with Continuous
Loading”, Proc. 10th Int. Conf. Soil Mech. and
Foundation Engineering, Stockholm, 1, pp.645-654.
Crawford, C.B., 1964, “Interpretation of The
Consolidation Test”. J. Soil Mech. Fdns Div.,
Am. Soc. Civ. Engrs 90, No. SM5, pp. 87-102.
Leroueil, S., Kabbaj, M., Tavenas, F. and Bouchard, R., 1985, ”Stress-Strain-Strain Re Relation for The Compressibility of Sensitive Natural
Clays”, Geothechnique, Vol. 35, No.2, pp.
159-180.
Lee, K., 1981, “Consolidation with Constant Rate of
Deformation”. Géotechnique, 31, No. 2,
pp.215-229.
Kita, A, Arai, K Machihara, H, and Sompie, B., 1998,
“Numerical Analysis of Constant Rate of
Strain Consolidation Test”, proc. 53th Japan
National Conference on Civil Engineering, Gifu, Vol. 1, p. 416 (in Japanese).
Sompie B, Arai, K and Machihara, H., 2001,
“Time Effects in Constant rate of Strain and
Constant Loading Rate Consolidation Tests”,
proc. 36th Japan National Conference on Geotechnical Engineering, Tokushima, Vol. 1, p. 979 (in Japanese).
Murakami, Y., 1987, “Consideration on The Methods for Estimating The Coefficient of Permeability
of A Clay”, JSSMFE, Vol. 27, No. 3, pp
Nagaraj, T. S., Pandian, N. S., and Narashima Raju, P. S.R., 1994, “Stress-State Permeability
Relations for Overconsolidated Clays”,
Geotechnique 44, No. 2, pp 349-352.
Otha, H., 1971, “Analysis of Deformations of Soils Based on The Theory of Plasticity and Its
Application To Settlement of Embankments”,
Dr. Eng. Thesis, Kyoto University.
Smith, R. E. and Wahls, H. E., 1969, “Consolidation
Under Constant Rates of Strain”. J. Soil Mech.
Fdns Div., Am. Soc. Civ. Engrs 95, No. SM2, pp. 519-539.
Shibata, T., 1963, “On The Volume Change of
Normally Consolidation Clays”, Annuals,
Disaster Prevention Research Institute, Kyoto University, No. 6, pp. 128-134 (in Japanese).
Yin, J. H. and Graham, J., 1988, ” Viscous-Elastic-Plastic Modeling of One Dimensional
Time-Dependent Behavior of Clays”, Canadian
Geotechnical Journal, Vol. 26, pp. 199-209.
Znidarcic, D., Shiffman, R. L., Pane, V., Croce, P., Ko, H.Y. and Olsen, H.W., 1986, “The Theory of One-Dimensional Consolidation of
Saturated Clays: Part V”, constant rate of
d e for ma tio n tes ting a nd an a lysis. Géotechnique, 36, No. 2, pp.227-237.
Wissa, A.E.Z., Christian, J.T., Davis, E.H. and Heiberg, S., 1971, “Consolidation at Constant
Rate of Strain”, J. Soil Mech. Fdns Div., Am.
Soc. Civ. Engrs 97, No. SM10, pp.1393-1413.
Notation
Superfix n denotes the discretized time step number, and designates the increment of succeeding physical quantity.
Cc compression index
Cs swelling index
Cv coefficient of consolidation
e0 initial void ratio
e void ratio
En hypothetical Young’s modulus
Gn hypothetical shear rigidity
kn coefficient of permeability
K0 coefficient of earth pressure at rest
Kn hypothetical bulk modulus
M slope of critical state line
mv coefficient of volume compressibility
p′n mean effective stress
qn stress difference
∆tn length of discretized time step
tn1 elapsed time after stopping the increase in the stress ratio
T time length required to make dilatancy take place completely
q n / p′n stress ratio
εn
shear strain
vertical strain
volumetric strain due to consolidation
elastic component of volumetric strain due to consolidation
plastic component of volumetric strain due to consolidation
volumetric strain due to dilatancy
parameter which presents the beginning of volumetric strain due to dilatancy
υn
Poisson’s ratio
horizontal effective stress