Public Opinion Quarterly, V o l. 7 9 , N o . 2 , S u m m e r 2 0 1 5 , p p . 4 4 3 - 4 7 0
A COMPARISON OF BRANCHED VERSUS
UNBRANCHED RATING SCALES FOR THE
MEASUREMENT OF ATTITUDES IN SURVEYS
E M I L Y E . G I L B E R T *
Abstract
T h e f o r m a t o f a s u r v e y q u e s t i o n c a n a f f e c t r e s p o n s e s .B r a n c h e d s u r v e y s c a l e s a r e a q u e s t i o n f o r m a t t h a t i s i n c r e a s i n g l y u s e d b u t l i t t l e r e s e a r c h e d . I t i s u n c l e a r w h e t h e r b r a n c h e d s c a l e s w o r k in a d i f f e r e n t w a y t h a n u n b r a n c h e d s c a l e s . B a s e d o n t h e d e c o m p o s i t i o n p r i n c i p l e ( A r m s t r o n g , D e n n i s t o n , a n d G o r d o n 1 9 7 5 ) , i f b r e a k i n g a d e c i s i o n t a s k u p i n t o c o m p o n e n t d e c i s i o n p a r t s i n c r e a s e s t h e a c c u r a c y o f t h e f i n a l d e c i s i o n , o n e c o u l d i m a g i n e t h a t b r e a k i n g a n a t t i t u d i n a l i t e m i n t o i ts c o m p o n e n t p a r t s w o u l d i n c r e a s e t h e a c c u r a c y o f t h e f i n a l r e p o r t . I n p r a c t i c e , t h i s is a p p l i e d b y f i r s t a s k i n g t h e r e s p o n d e n t t h e d i r e c t i o n o f t h e i r a t t i t u d e , t h e n u s i n g a f o l l o w - u p q u e s t i o n t o m e a s u r e t h e i n t e n s i t y o f t h e a t t i t u d e ( K r o s n i c k a n d B e r e n t 1 9 9 3 ) . A s p l i t - b a l l o t e x p e r i m e n t w a s e m b e d d e d w i t h i n t h e
Understanding Society
I n n o v a t i o n P a n e l , a l l o w i n g f o r a c o m p a r i s o n o f r e s p o n s e s b e t w e e n b r a n c h e d a n d u n b r a n c h e d v e r s i o n s o f t h e s a m e q u e s t i o n s . R e l i a b i l i t y a n d v a l i d i t y o f b o t h v e r s i o n s w e r e a s s e s s e d , a l o n g w i t h t h e t im e t a k e n t o a n s w e r t h e q u e s t i o n s i n e a c h f o r m a t . I n a t o t a l s u r v e y c o s t s f r a m e w o r k , t h i s a l l o w s e s t a b l i s h i n g w h e t h e r a n y g a i n s i n r e l i a b i l i t y a n d v a l i d i t y a r e o u t w e i g h e d b y a d d i t i o n a l c o s t s i n c u r r e d b e c a u s e o f e x t e n d e d a d m i n i s t r a t i o n t i m e s . F i n d i n g s s h o w e v i d e n c e o f r e s p o n s e d i f f e r e n c e s b e t w e e n b r a n c h e d a n d u n b r a n c h e d s c a l e s , p a r t i c u l a r l y a h i g h e r r a t e o f e x t r e m e r e s p o n d i n g i n t h e b r a n c h e d f o r m a t . H o w e v e r , t h e d i f f e r e n c e s i n r e l i a b i l i t y a n d v a l i d i t y b e t w e e n t h e t w o f o r m a t s a r e l e s s c l e a r c u t . T h e b r a n c h e d q u e s t i o n s t o o k l o n g e r t o a d m i n i s t e r , p o t e n t i a l l y i n c r e a s i n g s u r v e y c o s t s .Em i l y Gi l b e r t i s a s u r v e y m a n a g e r a t t h e C e n t r e f o r L o n g i t u d i n a l S t u d i e s , U C L I n s t i t u te o f E d u c a t i o n , L o n d o n , U K . T h e a u t h o r w o u l d l i k e t o t h a n k N i c k A l l u m f o r h e l p f u l f e e d b a c k a n d s u p p o r t . T h i s p a p e r m a k e s u s e o f d a t a f r o m t h e
Understanding Society
I n n o v a t i o n P a n e l a d m i n i s t e r e d b y t h e I n s t i t u t e f o r S o c i a l a n d E c o n o m i c R e s e a r c h , U n i v e r s it y o f E s s e x , a n d f u n d e d b y t h e E c o n o m i c a n d S o c ia l R e s e a r c h C o u n c i l . * A d d r e s s c o r r e s p o n d e n c e t o E m i l y G il b e r t , C e n t r e f o r L o n g i t u d i n a l S t u d i e s , U C L I n s t i t u t e o f E d u c a t i o n , 2 0 B e d f o r d W a y , L o n d o n W C I H O A L , U K ; e - m a i l : e . g i l b e r t @ i o e . a c . u k .d o i : 1 0 . 1 0 9 3 / p o q / n f u 0 9 0
444
Gilbert
Background
The choice of question response format is an important one, as it has wide
implications for reliability and validity. One relatively recent innovation has
been the use of “branched” formats for survey scales. In this format, one first
asks the respondent about the direction of their attitude and then, using a fol
low-up question, measures the intensity of the attitude (Krosnick and Berent
1993). The potential advantage of this method is to reduce cognitive burden
on the respondent, thereby permitting data of higher quality to be extracted.
The disadvantage is increased administration time through having to ask two
questions as opposed to one.
Some of the major surveys, such as the American National Election
Studies (ANES) and New Zealand Election Studies (NZES), are increasingly
using branched questions to measure political attitudes. The ANES has used
branched questions in telephone interviews in order to provide data compara
ble to that collected in various modes in previous years. The NZES has used
branched questions in self-completion surveys in a similar way (Vowles et al.
1995; Miller, Kinder, and Rosenstone 1999).
The idea of branching is based in the notion of decomposition. To solve
a problem using the scientific method, one should decompose the problem
into “sub-problems,” solve each of those, then unite the solutions to solve the
initial problem (Raiffa 1968). An extension of this idea— the decomposition
principle— suggests that breaking a decision task up into its component deci
sion parts increases the accuracy of the final decision (Armstrong, Denniston,
and Gordon 1975). It could therefore be hypothesized that breaking an attitude
question into its component parts would increase the accuracy of the response.
The branching approach was first used in telephone surveys as a way of
asking respondents to place themselves on a scale without having to remem
ber all of the response options (Schaeffer and Presser 2003). It therefore
allowed seemingly comparable questions to be asked across different modes;
branched in the telephone mode and unbranched using showcards in face-to-
face, with the assumption that the data provided in each mode were equiva
lent. Additionally, it is possible that some of the problems associated with
traditional scales, such as nondifferentiation, could be eliminated with the use
of branched questions. There are, however, open questions that need to be
explored.
DO BRANCHED QUESTIONS PRODUCE SIMILAR RESPONSES TO UNBRANCHED
QUESTIONS?
Branched versus Unbranched Rating Scales
445
r e s p o n d e n t s w i t h a p a r t i a l l y l a b e l e d u n b r a n c h e d s c a l e o n a s h o w c a r d , t h e i r
r e s p o n s e s w e r e m o r e l i k e l y t o c l u s t e r a r o u n d t h e l a b e l e d c a t e g o r i e s c o m p a r e d
w i t h r e s p o n d e n t s w h o w e r e p r e s e n t e d t h e s a m e s c a l e u s i n g a b r a n c h e d f o r m a t
o n t h e t e l e p h o n e . F a c e - t o - f a c e r e s p o n d e n t s w h o r e c e i v e d a b r a n c h e d l i f e - s a t
i s f a c t i o n q u e s t i o n w i t h a f u l l y l a b e l e d s h o w c a r d w e r e l e s s l i k e l y t o s e l e c t t h e
m i d d l e c a t e g o r y t h a n t e l e p h o n e r e s p o n d e n t s w h o r e c e i v e d t h e s a m e b r a n c h e d
q u e s t i o n . T h e r e s p o n s e s t o t h e s a m e q u e s t i o n a l s o s h o w f a c e - t o - f a c e r e s p o n d
e n t s s e l e c t i n g t h e e x t r e m e n e g a t i v e m o r e o f t e n t h a n t e l e p h o n e r e s p o n d e n t s ,
a n d t h e e x t r e m e p o s i t i v e l e s s o f t e n .
N i c o l a a s , T h o m p s o n , a n d L y n n ( 2 0 0 0 ) f o u n d t h a t f a c e - t o - f a c e r e s p o n d e n t s
a n s w e r i n g u n b r a n c h e d q u e s t i o n s w e r e l e s s l i k e l y t h a n t e l e p h o n e r e s p o n d e n t s
a n s w e r i n g b r a n c h e d q u e s t i o n s t o c h o o s e a n e x t r e m e r e s p o n s e . D e s p i t e t h e f a c t
t h a t q u e s t i o n f o r m a t w a s c o n f o u n d e d w i t h d a t a - c o l l e c t i o n m o d e , t h e a u t h o r s
c o n c l u d e d t h a t i t w a s v e r y l i k e l y t h a t t h e b r a n c h i n g o f r e s p o n s e s i n t h e t e l
e p h o n e i n t e r v i e w w a s t h e m a i n c a u s e f o r t h e e x t r e m e r e s p o n d i n g . N i c o l a a s
e t a l . ( 2 0 1 1 ) a l s o f o u n d m o r e e x t r e m e r e s p o n s e s t o b r a n c h e d q u e s t i o n s i n t e l
e p h o n e i n t e r v i e w s c o m p a r e d w i t h u n b r a n c h e d q u e s t i o n s i n f a c e - t o - f a c e a n d
w e b i n t e r v i e w s f o r a t t i t u d i n a l i t e m s . F o r f a c t u a l i t e m s , t h e r e s u l t s w e r e e i t h e r
n o t s i g n i f i c a n t o r i n t h e o p p o s i t e d i r e c t i o n . E x t r e m e r e p o r t i n g w i t h i n a m o d e
w a s g r e a t e r w i t h t h e b r a n c h e d t h a n u n b r a n c h e d q u e s t i o n s f o r t h e a t t i t u d e
i t e m s . A g a i n a d i f f e r e n t p a t t e r n e m e r g e d f o r t h e f a c t u a l q u e s t i o n s ; a h i g h e r
l e v e l o f e x t r e m e r e s p o n d i n g w a s s e e n i n t h e u n b r a n c h e d c o n d i t i o n . H o w e v e r ,
o n e n e e d s t o b e a w a r e o f a p o t e n t i a l c o n f o u n d in t h e u s e o f s h o w c a r d s , w h e r e
t h e y w e r e u s e d f o r s o m e q u e s t i o n s i n s o m e m o d e s a n d n o t f o r o t h e r s .
D i f f e r e n c e s i n r e s p o n s e d i s t r i b u t i o n s b e t w e e n b r a n c h e d a n d u n b r a n c h e d
q u e s t i o n s h a v e b e e n f o u n d b y o t h e r s t u d i e s , a n d t h e s e d i f f e r e n c e s o f t e n r e l a t e
t o t h e l e v e l o f e x t r e m e r e s p o n d i n g . A l b a u m ( 1 9 9 7 ) . Y u , A l b a u m , a n d S w e n s o n
( 2 0 0 3 ) a n d d e L e e u w , H o x , a n d S c h e r p e n z e e l ( 2 0 1 0 ) a l l f o u n d t h a t b r a n c h e d
s c a l e s t e n d e d t o p r o d u c e m o r e e x t r e m e r e s p o n s e s t o a t t i t u d i n a l i t e m s t h a n
u n b r a n c h e d s c a l e s .
G I V E N T H E D I F F E R E N C E S I N R E S P O N S E S B E T W E E N B R A N C H E D A N D
U N B R A N C H E D Q U E S T I O N S . T H E Q U E S T I O N A R I S E S , W H I C H F O R M A T P R O D U C E S B E T T E R D A T A ?
A l b a u m ( 1 9 9 7 ) a r g u e d t h a t u n b r a n c h e d q u e s t i o n s c o n f o u n d a t t i t u d e d i r e c t i o n
a n d i n t e n s i t y , c r e a t i n g c e n t r a l t e n d e n c y e r r o r . T h e r e f o r e , h e a r g u e s , b r a n c h e d
s c a l e s a r e p r e f e r a b l e f o r e l i c i t i n g a c c u r a t e a t t i t u d i n a l r e s p o n s e s . Y u , A l b a u m ,
a n d S w e n s o n ( 2 0 0 3 ) s u g g e s t t h e u n b r a n c h e d s c a l e l e a d s t o u n d e r r e p o r t i n g o f
t r u e , e x t r e m e a t t i t u d e s . B o t h s t u d i e s , a s w e l l a s A l d r i c h e t a l . ( 1 9 8 2 ) , f o u n d
t h a t r e s p o n s e s t o b r a n c h e d q u e s t i o n s w e r e b e t t e r a t p r e d i c t i n g a t t i t u d e s a n d
b e h a v i o r s c o m p a r e d w i t h u n b r a n c h e d q u e s t i o n s .
F u r t h e r s t u d i e s h a v e a l s o s u g g e s t e d t h a t b r a n c h e d q u e s t i o n s p r o v i d e m o r e
r e l i a b l e r e s u l t s t h a n t h e i r u n b r a n c h e d c o u n t e r p a r t s . A l d r i c h e t a l . ( 1 9 8 2 ) c o m
44
6
Gilbert
labeled, branched versions of the same questions. The branched questions
produced stronger test-retest results, and were strongly related to other politi
cal attitudes. Similarly, using a branched measure of party loyalty from the
ANES, Alwin (1992) found that the reliability of this measure was higher than
most other attitudinal items. Krosnick and Berent (1993) showed stronger
test-retest results for fully labeled branched questions compared with partially
labeled unbranched questions, suggesting higher reliability for the branched
questions. The results also showed that branching the questions was less use
ful to those who had an education that extended beyond high school compared
with respondents who had not completed high school. However, all of the
studies above that examined reliability have factors that confound the find
ings. Aldrich et al. (1982) and Krosnick and Berent (1993) both compare fully
labeled branched questions with partially labeled unbranched ones. We know
that labeling has an impact on responses (Andrews 1984; Alwin and Krosnick
1991), so we cannot be sure it is the branching alone that increases reliability.
Alwin (1992) does not compare a branched question with an unbranched one,
so when he finds the reliability of responses to the branched question to be
high, we cannot compare this with the reliability of an unbranched version.
Considering validity, Malhotra, Krosnick, and Thomas (2009) found that
branching the endpoints of a three-point scale (positive or negative) with two
response options (somewhat or strongly positive/negative) increased the cri
terion validity significantly compared with using just the initial three-point
scale, and this improvement was increased further when respondents had three
endpoint options. However, branching the midpoint was not useful for valid
ity improvement. They concluded that respondents who chose the midpoint
appeared to belong there, as opposed to belonging on the weaker end of an
opinion one way or another.
Although there is evidence suggesting that branched questions perform bet
ter in terms of reliability and validity than unbranched ones, there are some
studies that contradict this. Miller (1984) found only small differences in
frequency distributions of responses to branched and unbranched questions.
He proposed that a seven-point scale could be administered just as well in
the unbranched form as the branched form on the telephone. He suggested
the positive response bias that blights the satisfaction scale would be exacer
bated with a branched question, so it is desirable to use an unbranched scale.
Moreover, his study showed less missing data when using the unbranched
scale, as well as higher intercorrelations among items. Additionally, Miller
reported that interviewers stated they preferred the unbranched questions, as
they were quicker to administer.
B
ranched versus Unbranched Rating Scales
44
7
some questions, the branched scale contained five points to the unbranched
scale’s seven.
Table 1 details the key points of the studies discussed above. It highlights
that the empirical information we have so far concerning the performance of
branched versus unbranched scales is at best mixed. There are also a num
ber o f problems with many of the studies. Differences between branched and
unbranched items are often confounded with differences in modes or labeling,
limiting the conclusions that can be drawn about the relative performance of
the two formats. It should be noted at this point that the studies discussed so
far vary in terms of the question topics as well as response options.
The table is organized into five sections. Studies labeled [1] compared
unbranched face-to-face questions with branched telephone ones. The general
problem with these is the confounding of branching condition and mode. Studies
labeled [2] compare branching in the face-to-face and telephone mode. Here, there
is no comparison to unbranched questions. Studies of type [3] compare branched
and unbranched questions within a single mode, so we cannot be sure that the
results observed would apply to a different mode. The final main type of study, [4],
compares branched and unbranched questions across different modes. The studies
labeled [5] either do not fall into categories [ 1 ]—[4], or do not report enough infor
mation to be able to classify them. Generally, table 1 shows that the evidence we
have is not convincing, since various confounding factors apply to most studies.
This paper compares branched and unbranched questions for the measure
ment of attitudes in face-to-face surveys, focusing on data quality and respond
ent burden. Data come from a fully controlled experiment embedded within a
face-to-face survey. Attitude scales, as opposed to individual items, are used.
This means that latent, unobserved attitude scores can be created, an advantage
over preceding studies. Scale length and labeling are identical for the branched
and unbranched format, overcoming some of the problems with previous stud
ies. However, it is worth noting that this study provides evidence on the per
formance of branched and unbranched questions in face-to-face surveys only.
The following research questions are addressed: (1) Are there differences
in responses between branched and unbranched questions? (2) Which format
provides the most reliable and valid responses? and (3) What are the implica
tions for respondent burden and data-collection costs? Are there differences in
administration time between branched and unbranched questions?
Methods
SURVEY AND EXPERIMENTAL DESIGN
B
ranched versus Unbranched Rating Scales
451
c o n c e rn in g th e m eth o d o lo g y o f lo n g itu d in a l su rv ey s. T h e o rig in a l In n o v a tio n
P an el s am p le is a p ro b a b ility s am p le re p re s e n ta tiv e o f B rita in (e x clu d in g
N o rth e rn Ire la n d an d n o rth o f th e C ale d o n ia n C an al). A stan d ard c lu s te re d
s a m p le d e s ig n w as u tiliz e d , u sin g th e P o s tc o d e A d d re ss F ile (P A F ) as th e s a m
p lin g fram e. P o sta l sec to rs w e re th e p rim a ry s a m p lin g u n its (P S U s), w h ic h
w e re th en stra tifie d b y g e o g ra p h ic reg io n , s o c io e c o n o m ic statu s, an d p o p u
latio n d en sity , an d s e le c te d w ith p ro b a b ility p ro p o rtio n a l to th e n u m b e r o f
d eliv erab le ad d re s s e s w ith in ea ch . A d d re s s e s w e re th en ra n d o m ly selec te d
fro m e a c h P S U . W ave 3 w as c a rrie d o u t u s in g C o m p u te r-A s s is te d P e rso n a l
In te rv ie w in g (C A P I) b e tw e e n A p ril a n d J u n e 2 0 1 0 (1 ,7 5 6 re s p o n d e n ts , e q u a t
in g to an 82 p e rc e n t in d iv id u a l-le v el c o o p e ra tio n ra te [c u m u la tiv e], A A P O R
s ta n d a rd d e fin itio n 1). T h e first w av e o f th e IP w as c a rrie d o u t in sp rin g 2 0 0 8 ,
an d a n n u a lly sin ce th en.
F o r th is re s e a rc h , a sp lit b a llo t e x p e rim e n t w as e m b e d d e d w ith in th e w av e
3 survey . H a lf o f th e s am p le re ce iv ed tw o sets o f fo u r q u e s tio n s in a b ra n c h e d
fo rm a t, a n d th e o th e r h a lf re c e iv e d th e sa m e q u e s tio n s in an u n b ra n c h e d fo rm at.
A ll a n a ly s e s are c a rrie d o u t u sin g d a ta fro m th e to ta l IP 3 sam p le, w h e re
su b sta n tiv e an s w e rs to th e b ra n c h e d o r u n b ra n c h e d q u e s tio n s w ere g iv en . A ll
a n a ly s e s re p o rte d b elo w are u n w e ig h te d , b e c a u s e th e p rim a ry in te re st is in d if
fe re n c e s b e tw e e n e x p e rim e n ta l g ro u p s w ith in th e sam p le.
E X P E R IM E N T A L Q U E S T IO N S
T h e b ra n ch in g ex p e rim en t w as im p lem en ted u sin g scale q u estio n s ab o u t p olitical
self-efficacy an d n eig h b o rh o o d coh esio n . T h e q u estio n s u sed to m easu re p olitical
self-efficacy are tak en fro m th e A N E S T im e S eries S tu d y 1992 (M iller, K inder,
an d R o sen sto n e 1999); they h av e b een w id ely u sed elsew h ere to o (Vow les et al.
1995). T h e q u estio n s to m easu re n eig h b o rh o o d co h e sio n are tak en fro m the
P ro ject o n H u m an D ev elo p m en t in C h ic ag o N e ig h b o rh o o d s C o m m u n ity S urvey
(E arls et al. 2 0 07 ). T h e ra tio n a le fo r u sin g p reex istin g q u estio n s w as th at th e p er
fo rm a n c e o f the item s u n d er the stan d ard five-po in t scale fo rm a t h as alread y b een
d o cu m en te d (S am p so n , R au d en b u sh , and E arls 1997; M o rrell 2003).
It sh o u ld b e p o in te d o u t th at th e q u e s tio n s all u s ed an ag re e -d is a g re e
re s p o n se o p tio n fo rm a t. D e sp ite so m e e v id e n c e to s u g g e s t th e re c o u ld b e
p ro b le m s w ith th is fo rm a t, p a r tic u la rly s u rro u n d in g in te rp re ta tio n o f in te n sity
sig n ifie rs su c h as “ stro n g ly ,” an d a c q u ie s c e n c e b ias, th e a g re e -d is a g re e fo rm a t
is still w id ely u s ed ac ro ss m u ltip le d is c ip lin e s (F o w le r 1995; S aris et al. 2 0 1 0 ).
G iv en th e ex te n siv e u se o f th e a g re e -d is a g re e sca le, it is im p o rta n t to u n d e r
s ta n d th e im p lic a tio n s o f b ra n c h in g fo r th is scale.
U N B R A N C H E D Q U E S T IO N S
452
Gilbert
One set deals with political efficacy, and the other with neighborhood cohe
sion. See the appendix for full question wording.
BRANCHED QUESTIONS
Respondents in the branched treatment group were asked about the same state
ments, but formatted in the following way: “Do you agree, disagree, or neither
agree nor disagree with the following statement? [e.g., “I consider myself to
be well qualified to participate in politics.”]
Agree/Neither agree nor disagree/
Disagree
.” Respondents who answered “agree” to this initial question were
then asked, “Do you
strongly agree,
or
somewhat agree!"
Respondents who
answered “disagree” were asked, “Do you
strongly disagree,
or
somewhat
disagree
?” Those who chose the response “neither agree nor disagree” pro
ceeded to the next question.
Results
ARE THERE DIFFERENCES IN RESPONSES BETWEEN BRANCHED AND
UNBRANCHED QUESTIONS?
To analyze response differences between branched and unbranched questions,
response distributions were compared for each item between the two condi
tions. Second, mean scores were calculated for the two attitudes measured for
both the branched and unbranched groups, and differences were tested.
Response distributions for the political-efficacy questions (table 2) and
the neighborhood-cohesion questions (table 3) are shown, split by branching
condition.
The distributions show that respondents in the branched treatment condition
appear more likely to use both extreme response options compared with those
in the unbranched group. This is true for all eight questions, and for both of
the extreme response options. For example, 22 percent of respondents in the
branched treatment group strongly disagree with the first statement (“I con
sider myself to be well qualified to participate in politics”) compared with 11
percent of respondents in the unbranched group. At the same time, 9 percent
of branched respondents chose “strongly agree” compared with 7 percent of
unbranched respondents. Respondents in the branched condition also seem
more likely to use the middle response option in all cases.
B
ranched versus Unbranched Rating Scales
455
F o r t h e p o l i t i c a l - e f f i c a c y q u e s t i o n s , t h e b r a n c h e d g r o u p h a s t h e l o w e r
m e a n ( M = 2 . 5 9 c o m p a r e d t o 2 . 6 8 f o r u n b r a n c h e d ,
F =
4 . 6 2 ,p
< . 0 1 ) . F o r t h e n e i g h b o r h o o d q u e s t i o n s , t h e r e v e r s e i s t r u e ( M = 3 . 6 2 u n b r a n c h e d a n d 3 . 7 5b r a n c h e d ,
F =
5 . 0 4, p
< . 0 1 ) . T h i s m e a n s t h a t t h o s e i n t h e b r a n c h i n g c o n d i t i o n r e p o r t a l o w e r s e n s e o f p o l i t i c a l e f f i c a c y a n d a h i g h e r s e n s e o f n e i g h b o r h o o dc o h e s i o n t h a n t h o s e i n t h e u n b r a n c h e d t r e a t m e n t g r o u p .
F l o w e v e r , i t i s w o r t h n o t i n g t h a t t h e s u b s t a n t i v e d i f f e r e n c e s a r e v e r y s m a l l :
0 . 0 9 f o r p o l i t i c a l e f f i c a c y a n d 0 . 1 3 f o r n e i g h b o r h o o d c o h e s i o n . R e l a t i v e t o t h e
i n d e x e s ’ s c a l e , t h e d i f f e r e n c e i s 2 . 2 5 p e r c e n t f o r t h e f o r m e r a n d 3 . 2 5 p e r c e n t
f o r t h e l a t t e r . I t i s a l s o n o t s u r p r i s i n g t h a t t h e m e a n s a r e s u b s t a n t i v e l y s i m i l a r
a c r o s s b r a n c h i n g c o n d i t i o n . G i v e n t h a t t h o s e i n t h e b r a n c h i n g c o n d i t i o n a r e
m o r e l i k e l y t o u s e b o t h e x t r e m e s a n d t h e m i d d l e o p t i o n o n t h e s c a l e , t h e s e
c o u l d l i k e l y c a n c e l e a c h o t h e r o u t t o p r o v i d e a m e a n s i m i l a r t o t h a t f o u n d u s i n g
a n u n b r a n c h e d s c a l e . T h i s i s s o m e w h a t i n l i n e w i t h A l b a u m ’s ( 1 9 9 7 ) f i n d i n g ;
o n t h e i n d i v i d u a l l e v e l , b r a n c h i n g p r o d u c e s m o r e e x t r e m e r e s p o n s e s , b u t t h e
o v e r a l l d a t a s t r u c t u r e d o e s n o t d i f f e r a c r o s s g r o u p s .
W H I C H F O R M A T P R O V I D E S T H E M O S T R E L I A B L E A N D V A L I D R E S P O N S E S ?
F i r s t , C r o n b a c h 's a l p h a w a s c o m p u t e d t o a s s e s s r e l i a b i l i t y f o r e a c h t r e a t m e n t
g r o u p . S e c o n d , t o t e s t m e t r i c a n d s c a l a r e q u i v a l e n c e ( C h e u n g 2 0 0 8 ) a c r o s s t h e
b r a n c h e d a n d u n b r a n c h e d t r e a t m e n t g r o u p s , m u l t i p l e - g r o u p c o n f i r m a t o r y f a c
t o r a n a l y s i s ( C F A ) w a s u s e d . T h i r d , t o a s s e s s t h e p r o b a b i l i t i e s o f e a c h r e s p o n s e
a c r o s s e a c h q u e s t i o n ( t o t e s t w h e t h e r t h e r e s p o n s e o p t i o n s i n t h e t w o t r e a t
m e n t g r o u p s a r e d i s c r i m i n a t i n g i n t h e s a m e w a y ) , g r a d e d - r e s p o n s e m o d e l s
w e r e e s t i m a t e d . F i n a l l y , c o r r e l a t i o n s w i t h c r i t e r i o n v a r i a b l e s w e r e e x a m i n e d
t o a s s e s s v a l i d i t y .
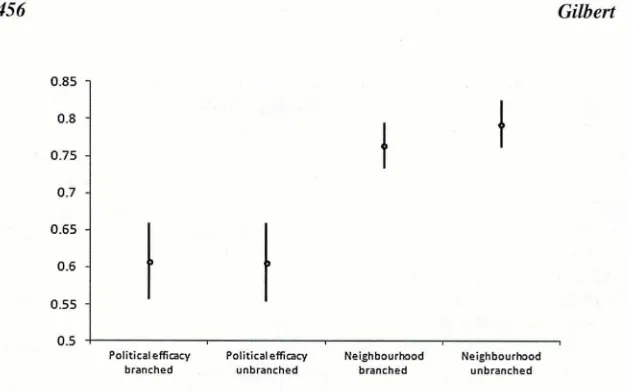
F i g u r e 1 s h o w s t h e C r o n b a c h ’s a l p h a s f o r b o t h s c a l e s a c r o s s c o n d i t i o n s . T h e
v e r t i c a l b a r s s h o w 9 5 p e r c e n t b o o t s t r a p p e d c o n f i d e n c e i n t e r v a l s .
T h e r e a p p e a r s t o b e v e r y l i t t l e d i f f e r e n c e i n t e r m s o f r e l i a b i l i t y b e t w e e n t h e
b r a n c h e d a n d u n b r a n c h e d f o r m a t s ; t h e s c a l e r e l i a b i l i t y c o e f f i c i e n t s a r e v e r y
s i m i l a r f o r e a c h p a i r o f s c a l e s , a n d t h e c o n f i d e n c e i n t e r v a l s o v e r l a p . T h e r e is
t h u s n o e v i d e n c e t h a t b r a n c h i n g h a s g e n e r a t e d m o r e r e l i a b l e e s t i m a t e s o n t h i s
s t a n d a r d m e a s u r e .
N e x t , I e s t i m a t e d m u l t i p l e - g r o u p C F A m o d e l s . T h e f o u r q u e s t i o n s c o n c e r n
i n g p o l i t i c a l e f f i c a c y a r e d e s i g n e d t o m e a s u r e a s i n g l e l a t e n t c o n s t r u c t , a s a r e
t h e f o u r n e i g h b o r h o o d q u e s t i o n s . A m u l t i p l e - g r o u p C F A i s a p p r o p r i a t e i n t h i s
c a s e , a s i t a l l o w s a c o m p a r i s o n o f h o w e a c h o b s e r v e d v a r i a b l e i s r e l a t e d t o t h e
l a t e n t c o n s t r u c t a c r o s s g r o u p s ( R e i s e , W i d a m a n , a n d P u g h 1 9 8 3 ) . A c o m p a r i
s o n o f t h e s a m e m o d e l a c r o s s t h e b r a n c h e d a n d u n b r a n c h e d c o n d i t i o n s w i l l
h i g h l i g h t a n y d i f f e r e n c e s i n t h e w a y t h e t w o d i f f e r e n t q u e s t i o n f o r m a t s a r e
m e a s u r i n g p o l i t i c a l e f f i c a c y a n d n e i g h b o r h o o d c o h e s i o n .
M o d e l 1 i n t a b l e 3 i s t h e b a s e l i n e m o d e l ( w h e r e f a c t o r l o a d i n g s a n d i n t e r
c e p t s a r e f r e e l y e s t i m a t e d a c r o s s c o n d i t i o n s ) , w h i c h t e s t s f o r c o n f i g u r a l e q u i v
4
5
6
Gilbert
0 .8 5 -|
0 .8 -
0 .7 5 -
0 .7 -
0 .6 5 -
0.6 -
0 .5 5 -
0 .5 - ■
P o l it ic a l e ffic a c y P o l it ic a l e ffic a c y N e i g h b o u r h o o d N e ig h b o u r h o o d b r a n c h e d u n b r a n c h e d b r a n c h e d u n b r a n c h e d
Figure 1. Cronbach’s Alpha Coefficients, with Bootstrapped Confidence
Intervals, for Political Efficacy and Neighborhood Scales.
measurement of the latent constructs in the same way across both conditions.
If the factor structure is the same across groups, configural equivalence is seen
(Meredith 1993).
If model 1 demonstrates configural equivalence, model 2 can be run,
which constrains factor loadings to be equal across branching conditions.
This allows us to check for metric equivalence, the equality of the measure
ment intervals across the same group (Van de Vijver and Leung 1997). In
other words, does a one-unit increase in the measurement scale of one of the
latent constructs produce the same result in the branched and unbranched
models? If metric equivalence is seen, scores on each item can be meaning
fully compared across branching conditions (Steenkamp and Baumgartner
1998).
Model 3 constrains factor loadings and intercepts to be equal. This permits
us to test for scalar equivalence. Scalar equivalence is where the intercepts of
the indicators are equal across groups. This means that respondents who have
the same level of a latent trait should have the same values on the observed
variables, across branching conditions. That would mean that differences seen
between groups come from true differences in the latent construct, rather than
differences caused by question format (Hong, Malik, and Lee 2003). If scalar
equivalence is seen, it is possible to compare means of the latent traits meas
ured across groups (Bollen 1989).
Br
anched versus Unbranched Rating Scales
45
7
In order to test for metric equivalence (model 2), the difference in
y2
fit
between models 1 and 2 needs to be tested. For the political-efficacy ques
tions, the
y2
difference is 2.771 (3 df,
p =
.428). For the neighborhood ques
tions, the
x2
difference is 0.484 (3 df,/? = 0.922). Therefore, metric equivalence
is seen for both latent constructs and associated questions: the change in fit
between models 1 and 2 is not significant in either case. Accordingly, we can
reasonably say that the performance of the items in how well they discriminate
between people who differ on latent political efficacy and perceptions of the
neighborhood is the same regardless of whether the branched or unbranched
format is used.
When intercepts, however, are constrained to be equal across branched and
unbranched questions in model 3, the model fits become worse for neigh
borhood cohesion compared with model 2. Testing the loss of fit seen in the
X2
between models 2 and 3 for neighborhood cohesion gives a
x2
change of
32.272 (3 df,
p =
0.000). Thus, significant differences exist in the intercepts
between the branched and unbranched conditions for the neighborhood-cohe
sion construct: people who share the same level of neighborhood cohesion
are expected to select different response categories depending on the ques
tion format and depending on which items are under consideration. In other
words, observed mean differences between groups receiving branched and
unbranched formats can be attributed not to differences in latent underlying
beliefs but to differences in item intercepts. For example, when looking at the
intercepts of the fourth neighborhood question (“people in this neighborhood
generally don’t get along with each other”), in model 2 the intercept of the
branched group was 2.007 and for the unbranched group 2.269. The inter
cepts for the other neighborhood questions, and for the political-efficacy ques
tions, also differ by approximately this magnitude between the branched and
unbranched conditions. The Comparative Fit Index (CFI), Root Mean Square
Error of Approximation (RMSEA), and Standardized Root Mean Square
Residual (SRMR) all support the result seen when testing the chi-squared dif
ferences between models (Byrne 1988; Bentler 1990; Steiger 1990; Hu and
Bentler 1999).
This finding implies that for the neighborhood-cohesion questions, there
is no evidence of differences in reliability between the two question formats,
but a respondent with a given opinion about the issue will choose a set of
responses that are more or less positive (or negative), depending on which for
mat is used. The effect can also be seen for the political-efficacy questions, but
this does not reach statistical significance. This supports the extreme respond
ing seen (table 2) and the differences in means across branching condition,
thereby suggesting that branching leads respondents to select a different set of
responses to respondents receiving unbranched questions.
4
5
8
Gilbert
and unbranched treatment groups comes not from differences in the latent trait
levels of the respondents in each group but as a result of the question format.
Graded-response models can be used to assess whether the response options
across the two treatment groups are discriminating in the same way. These
models are a type of two-parameter logistic-item response-theory model
developed by Samejima (1969). Rather than treat the items as continuous and
normally distributed, graded-response models are categorical models that pro
vide a probability of a respondent with an unobserved continuous latent atti
tude selecting a particular item on the response scale used. To calculate these
models, one must first determine the location of the response option thresholds
on the continuum of the latent trait, then the probability of a respondent with a
given level of the latent trait responding within or above a particular threshold
(Embretson and Reise 2000).
In graded-response models, each item in a scale can be described by one
slope parameter (a, ) and any number of between-category threshold parame
ters
[Pjj
), calculated by subtracting one from the number of response categories.
The items used here all have five response options, and four between-category
thresholds. Estimation of the models is done in two stages. First, operating
characteristic curves are calculated for each of the four thresholds. Each curve
shows the probability of a respondent’s response choice (■*) falling in or above
one of the four category thresholds, conditional on their level of the latent trait
of interest (0).
p,M
e x p [
«,(
1
-
---1
l + exp
'[ “ zM « l ]
( i )
For each of the items, four (8^ parameters are calculated, along with one item
slope
a i
common to all threshold parameters. Graded-response models treat
each item as a series of dicotomies (response option 1 versus 2, 3, 4, and 5;
response options 1 and 2 versus 3. 4, and 5; and so on), estimating the above
model for each of those dichotomies. Once all of the possible combinations
have been estimated, calculating the probability of responding in each of the
five response categories is done as follows:
^(e)=^(0)-V.,(0)
(2)
This subtraction creates category response curves, representing the probability
of a respondent selecting a particular response option dependent on their trait
level: in this case, political efficacy or level of neighborhood cohesion. The
statistical modelling program MPlus version 5.2 was used to estimate these
models.
Br
anched versus Unbranched Rating Scales
45
9
that represents the probability of a respondent using that particular response
option, dependent on the level of the latent trait. The steeper the curve for each
response category, the more narrow the curve is, and a low amount of overlap
between curves suggests that the response categories differentiate between dif
ferent levels of the latent trait well.
POLITICAL-EFFICACY ITEMS
Figure 2 shows that the branched versions of the first and second political-
efficacy questions are better at discriminating between the five response cat
egories when measuring political efficacy. All questions were scored such that
a higher score on the scale implies a higher sense of political efficacy. The
unbranched response slopes on the ICCs are far shallower and overlap more,
indicating the response options are not discriminating between different levels
of political efficacy very well.
However, the opposite effect is seen for the third and fourth political-effi
cacy questions. Here, the scale of the unbranched version of the question is
better at picking up differences in political efficacy.
NEIGHBORHOOD ITEMS
Figure 3 shows that for the neighborhood questions, the unbranched ques
tions appear to be slightly better than the branched versions at discriminat
ing between the response categories (higher scores reflect a greater sense of
neighborhood cohesion). This is seen through the slightly steeper slopes on the
item characteristic curves across all questions.
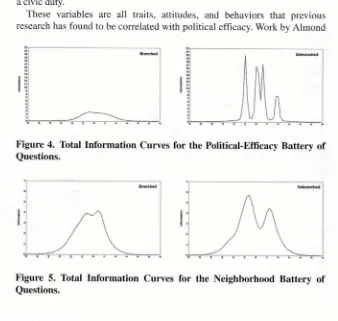
Total information curves (TICs) can be used to assess the reliability of each
format in a more direct way. They are a means of examining the level of infor
mation available across all levels of a latent trait. Information is defined as
the reciprocal of the precision with which a particular parameter is estimated
(Baker 2001). Precision itself is a function of the variability of the estimates
for that particular parameter. Therefore, information at the item level equals
one divided by the variance.
TICs are estimated based on the slope parameters of all items in the graded-
response models, along with the location of the slopes, showing how much
information a scale provides across all levels of the latent trait (Neal, Corbin,
and Fromme 2006). To calculate the TICs, the category response curves that
are computed as part of the graded-response models can be transformed into
item information curves in the following way:
x=0
p
, (
o
)
(3)
4
6
0
Gilbert
Branched Unbranched
KEY
_____ S tro n g ly disagree D isa g re e _______ N e it h e r ______ A g re e ... S tro n g ly a g re e
Figure
2. Item Character
i
s
t
i
c C
u
rves for Pol
i
tical-Efficacy Questions.
th
e s
moother and higher the curve, the more information we have about vari
ous levels of the latent trait and so the more reliable the set of questions.
On the x-axis of the graphs, the 0 point represents the mean level of the
latent trait (political efficacy or neighborhood cohesion), with the other points
representing standard deviations away from the mean.
Br
anched versus Unbranched Rating Scales
461
KEY
____ Strongly disagree ... Disagree ______ N either _____ Agree ... Strongly agree
Figure
3. Item Character
is
t
ic
C
ur
ves for Ne
ig
hborhood-Cohes
ion Q
ue
st
ion
s.
showing that there is a similar amount of information about most levels of
political efficacy. However, the curve is not high, so there is not much informa
tion at any level of the latent trait.
462
Gilbert
“political efficacy” than the branched scale, as the line is a lot higher at most
points on the x-axis, despite being so varied.
In figure 5, the branched graph shows a smoother curve, covering a wide
range of levels of neighborhood cohesion. The unbranched graph is also wide,
but shows there is little information at the 0 point on the graph (the mean
neighborhood cohesion latent trait score) compared with other levels of neigh
borhood cohesion. The height of the curves is more similar between graphs
for these questions. This suggests we have a reasonable amount of informa
tion about many levels of neighborhood cohesion for both the branched and
unbranched conditions. The branched graph appears to show there is more
information about more levels of the latent trait compared with the unbranched
curve, suggesting the branched questions are slightly more reliable for
this topic.
As a final step, I assess validity at the respondent level, examining correla
tions between the means of each of the two batteries with criterion variables.
Criterion variables used for political efficacy are highest educational quali
fication, voting frequency, likelihood of voting in the next general election,
whether or not the respondent is a supporter of a political party, the respond
ent’s level of interest in politics, and whether the respondent views voting as
a civic duty.
These variables are all traits, attitudes, and behaviors that previous
research has found to be correlated with political efficacy. Work by Almond
Figure
4. Total Info
r
m
at
io
n C
u
rves for the Pol
i
ti
c
al-Eff
i
c
acy Batt
ery
o
f
Q
ue
sti
o
ns
.
T
Br
anched versus Unbranched Rating Scales
4
6
3
4
6
4
Gilbert
and
Verba (1965) and Campbell et al. (1960) found education to be a strong
predictor of political efficacy. Miller (1980), Shaffer (1981), and Abramson
and Aldrich (1982) all found voting behavior to be correlated with political
efficacy. This includes two variables in this analysis: how often a respondent
has voted in the past and their intention to vote in the future. Being a sup
porter of a political party is also correlated with political efficacy, as detailed
by Clarke and Acock (1989). Kwak, Wang, and Guggenheim (2004) found
interest in politics to be related to political efficacy, and Zimmerman and
Rappaport (1988) suggest that a sense of civic duty can be correlated with
political efficacy.
Criterion variables used for neighborhood cohesion are whether the
respondent likes living in the neighborhood, how often the respondent visits
neighbors, how often the respondent does favors for neighbors, how often peo
ple in the neighborhood have parties, how often people in the neighborhood
watch other neighbors’ property, and whether or not the respondent has any
close friends living in the neighborhood.
Buckner (1988) reported that variables such as those that measure whether
people like living in their neighborhood, whether people often visit their neigh
bors, and whether people do favors for their neighbors are correlated with a
feeling of neighborhood cohesion. Kasarda and Janowitz (1974) suggest that
having friends within a community can strengthen one’s sense of liking and
belonging to that community.
Table 4 shows the Pearson product moment correlation coefficients (r), in
bold text, for the correlation between the score of interest (the political efficacy
or neighborhood latent trait scores) and the criterion variables described. The
columns either side of the coefficients show the lower and upper confidence
intervals at the 95 percent level for the
r
-
value, calculated using the Fisher
z-r
transformation. If the confidence intervals of the branched and unbranched
estimates overlap, any difference seen in the r-value between the two condi
tions is statistically insignificant. The only significant difference between the
branched and unbranched correlation coefficients is that for the variable “like
living in the neighborhood.”
Br
anched versus Unbranched Rating Scales
4
6
5
WHAT ARE THE IMPLICATIONS FOR RESPONDENT BURDEN AND DATA-
COLLECTION COSTS? ARE THERE DIFFERENCES IN ADMINISTRATION TIME
BETWEEN BRANCHED AND UNBRANCHED QUESTIONS?
The final question addressed is respondent burden; specifically, assessing the
implications of the branched question for respondent burden and data-collec-
tion cost. Paradata were used to assess the differences in time taken to admin
ister branched and unbranched versions of the same questions. OLS was used
to carry out this analysis.
In both batteries of questions, respondents in the branched condition took
significantly longer to complete the set of questions than respondents in the
unbranched condition. For the political-efficacy questions, this was about
15 seconds more for the whole battery, and for the neighborhood questions
around 16 seconds.1
Dis
cussion
The results suggest that there are no gains in data quality from using branched
questions over unbranched ones. The data here showed differences in the level of
extreme responding between respondents in the branched and unbranched condi
tions, with branched respondents both answering more extremely and using the
middle response option more often. In terms of reliability and validity, there is
no evidence for systematic differences between branched and unbranched ques
tions. The administration of branched questions took significantly longer than
unbranched versions of the same questions, therefore driving up survey costs.
It appears that branched questions may not be a good format choice after
all. This contradicts most other empirical findings. The strength of this study is
that data come from a fully controlled experiment. Confounding factors found
in previous experiment-based studies, such as scale labeling and questionnaire
mode, are eliminated. Nevertheless, it must be acknowledged that the same
results might not be found if one were to repeat the experiment using different
question topics, or a different mode. In addition, the experiment that this paper
reports uses agree-disagree questions, and so feasibly the findings may only
apply to this type of question.
4
66
Gilbert
The
implication for question design is that branched questions should be
used with caution. In the conditions described in this paper, they appear not
to produce higher-quality data over unbranched questions and have consid
erable cost implications. Branched questions do, however, produce more
extreme and middle responses than unbranched questions. The wider impli
cation is that comparing data obtained using a branched question with data
from an unbranched question could prove problematic. Considering group
estimates, it may be that in the branched condition, the extreme responding
using both ends of the scale averages out to approximately the same group
estimates as in the unbranched condition. However, the individual-level
estimates could be more problematic. For example, imagine if one were
carrying out a cross-national comparison where an attitudinal item, such as
attitudes toward the use of the death penalty, had been asked of individu
als in two different countries, but using a branched format in one country
and an unbranched format in the other. The responses may suggest that
those in the country using the branched question hold more extreme views
about whether the death penalty should be used (i.e., many were strongly
for its use but equally many were strongly opposing it), whereas those in
the country using the unbranched question had views closer to the middle of
the spectrum. However, this difference could very well be a product of the
question format rather than a real difference in extremity of attitude.
The results discussed here also raise an interesting question about
whether the more extreme responding seen in the branched format is a truer
manifestation of the latent variable or not. While Yu, Albaum, and Swenson
(2003) suggest that unbranched questions lead to the underreporting of true,
extreme attitudes, the evidence from these data cannot stretch to the same
conclusion. If this were the case, one would arguably expect to see differ
ences in the validity between the two formats, but correlations of the latent
attitude scores with criterion variables do not show that to be the case.
Nevertheless, the use of more extreme values on the response scale in the
branched format warrants further investigation to determine the causes.
Additional future research should investigate whether the reliability and
validity of responses to branched and unbranched questions are the same
across different question topics, survey modes, and response scales, as well
as the reasons for extreme responding. These investigations would provide
insight into ways of improving survey questions, be it using a branched or
unbranched format, or potentially a combination of the two.
A
pp
endix
POLITICAL EFFICACY SCALE-QUESTION WORDING AND RESPONSE OPTIONS
Br
anched versus Unbranched Rating Scales
4
6
7
Strongly agree/Agree/Neither agree nor disagree/Disagree/Strongly disagree
I
consider myself to be well qualified to participate in politics.
I think I am better informed about politics than most people.
Public officials don’t care much about what people like me think,
[reverse coded]
People like me don’t have any say in what the government does, [reverse
coded]
NEIGHBORHOOD-COHESION QUESTIONS—QUESTION WORDING AND
RESPONSE OPTIONS
How far do you agree or disagree with the following statements?
Strongly agree/Agree/Neither agree nor disagree/Disagree/Strongly disagree
This is a close-knit neighborhood.
People around here are willing to help their neighbors.
People in this neighborhood can be trusted.
People in this neighborhood generally don’t get along with each other,
[reversecoded]
CRITERION VARIABLES FOR POLITICAL EFFICACY—QUESTION WORDING AND
RESPONSE OPTIONS
E
ducation.
Can you tell me the highest educational or school qualification
you have obtained?
Recoded degree/Other higher/A-level/GCSE/School
com-pletion/Vocational or none)
How often voted.
Since you have been eligible to vote in general elections,
how often have you voted?
Always/Very often/Quite often/Sometimes/Rarely/
Never
Likelihood of voting in next general election.
Again, thinking of a scale that
runs from 0 to 10, where 0 means very unlikely and 10 means very likely, how
likely is it that you will vote in the [next] general election?
0-10
Supporter of a political party.
Generally speaking, do you think of yourself
as a supporter of any one political party?
Yes/No
Level of interest in politics.
How interested would you say you are in
politics? Would you say you are...
Very/Fairly/Not very/Or not at all
interested?
Voting as civic duty. 1
would be seriously neglecting my duty as a citizen
if I didn’t vote.
Strongly agree/Agree/Neither agree nor disagree/Disagree/
Strongly disagree
46
8
Gilbert
L
i
ke living in the neighborhood.
Overall, do you like living in this neighbor
hood?
Yes/No
How often respondent visits neighbors.
How often do you and other people
in this neighborhood visit each other’s homes or chat with each other on the
street?
Often/Sometimes/Rarely/Never
How often respondent does favors for neighbor.
About how often do you
and people in your neighborhood do favors for each other? By favors we mean
such things as watching each other’s children, helping with shopping, lending
garden or house tools, and other small acts of kindness.
Often/Sometimes/
Rarely/Never
How often people in the neighborhood have parties.
How often do you and
people in this neighborhood have parties or get-togethers where other people
in the neighborhood are present?
Often/Sometimes/Rarely/Never
How often people in the neighborhood watch neighbors’ property.
When
a neighbor is not at home, how often do you and other neighbors watch over
their property?
Often/Sometimes/Rarely/Never
Close friends living in the neighborhood.
Thinking now of people who live
near you— in your local neighborhood— how many o f these people are close
friends of yours?
Interviewer to enter a number— Recoded to none/some
References
Abramson, Paul R., and John H. Aldrich. 1982. “The Decline o f Electoral Participation in America.”
American Political Science Review
76:502-21.Albaum, Gerald. 1997. “The Likert Scale Revisited.”
Journal o f the Market Research Society
39:331^18.
Aldrich, John H.. Richard G. Niemi, George Rabinowitz, and David W. Rohde. 1982. “The M easurem ent o f Public Opinion about Public Policy: A Report on Some New Issue Question Formats.”
American Journal o f Political Science
26:391^114.Almond, Gabriel A., and Sidney Verba. 1965.
Civic Culture.
Boston: Little, Brown and Company. Alwin. Duane F. 1992. “Information Transmission in the Survey Interview: Num ber o f Response Categories and the Reliability o f Attitude M easurem ent.”Sociological Methodology
22:83-118. Alwin, Duane F., and Jon A. Krosnick. 1991. “The Reliability o f Survey Attitude Measurement: The Influence o f Question and Respondent Attributes.”Sociological Methods and Research
20:139-81.
Andrews, Frank M. 1984. “Construct Validity and Error Com ponents o f Survey Measures: A Structural M odeling Approach.”
Public Opinion Quarterly
48:409^12.Armstrong, J. Scott, William B. Denniston, and Matt M. Gordon. 1975. “The Use o f the Decom position Principle in Making Judgements.”
Organizational Behavior and Human
Performance
14:257—63.Baker, Frank B. 2001.
The Basics o f Item Response Theory
, 2nd ed. College Park, MD: ERIC Clearinghouse on Assessm ent and Evaluation.Bentler, Peter M. 1990. “Comparative Fit Indexes in Structural Models.”
Psychological Bulletin
107:238^16.
Bollen, Kenneth A. 1989.
Structural Equations with Latent Variables.
New York: John Wiley and Sons.Buckner, John C. 1988. “The Development o f an Instrument to M easure Neighborhood Cohesion.”
Br
anched versus Unbranched Rating Scales
4
69
B y rn e , B a r b a r a M . 1 9 8 8 .
Str
uc
t
u
r
al Equa
t
ion Modeling wi
th Lisrel, Prelis and Simplis: Basic
Concepts, Applications and Programming.
M a h w a h , N J: L a w re n c e E rlb a u m A s so c ia te s .C a m p b e ll, A n g u s , P h ilip E . C o n v e rse , W a rre n E . M ille r, a n d D o n a ld E . S to k e s. 1960.
The
American Voter.
N e w Y ork : J o h n W ile y a n d S o n s .C h e u n g , G o rd o n W . 2 0 0 8 . “ T e s tin g E q u iv a le n c e in th e S tru c tu re , M e a n s , a n d V a ria n c e s o f H ig h e r-
O r d e r C o n s tr u c ts w ith S tru c tu ra l E q u a ltio n M o d e lin g .”
Organizational Research Methods
1 1 :5 9 3 - 6 1 3 .
C la rk e , H a r o ld D „ a n d A la n C . A c o c k . 1 98 9. “ N a tio n a l E le c tio n s a n d P o litic a l A ttitu d e s: T h e
C a s e o f P o litic a l E ffic a c y .”
British Journal o f Political Science
1 9 :5 5 1 - 6 2 .d e L e e u w , E d ith , Jo o p J. H o x , a n d A n n e tte C . S c h e rp e n z e e l. 2 0 1 0 . “ M o d e E f f e c t o r Q u e s tio n
W o rd in g ? M e a s u r e m e n t E r r o r in M ix e d M o d e S u r v e y s ." P r e s e n te d a t th e A n n u a l M e e tin g o f th e
A m e r ic a n A s s o c ia tio n f o r P u b lic O p in io n R e s e a rc h , C h ic a g o , IL , U S A .
D illm a n , D o n A . 2 0 0 8 . “ T h e L o g ic a n d P s y c h o lo g y o f C o n s tr u c tin g Q u e s tio n n a ire s .” In
International Handbook o f Survey Methodology
, e d it e d b y E d ith d e L e e u w , J o o p J. H o x , a n d D o n A . D illm a n , 1 6 1 - 7 5 . N e w Y ork: L a w re n c e E rlb a u m A s so c ia te s .E a r ls , F e lto n J ., J e a n n e B r o o k s - G u n n , S te p h e n W . R a u d e n b u s h , a n d R o b e r t J. S a m p so n . 2 0 0 7 .
“ P r o je c t o n H u m a n D e v e lo p m e n t in C h ic a g o N e ig h b o r h o o d s : C o m m u n ity S u rv e y , 1 9 9 4 - 1 9 9 5 .”
1 C P S R - 2 7 6 6 . A n n A rb o r, M I: In te r - U n iv e r s ity C o n s o r tiu m f o r P o litic a l a n d S o c ia l R e s e a r c h
[d is trib u to r ],
E m b r e ts o n , S u s a n E „ a n d S te v e n P. R e is e . 2 0 0 0 .
Item Response Theory fo r Psychologists.
M a h w a h , N J : L a w re n c e E r lb a u m A s s o c ia te s .
F o w le r, F lo y d J. 1 9 9 5 .
Improving Survey Questions: Design and Evaluation.
T h o u s a n d O a k s,C A : S A G E P u b lic a tio n s .
G ro v e s, R o b e r t M ., a n d R o b e r t L . K a h n . 1 97 9.
Surveys by Telephone: A National Comparison
with Personal Interviews.
N e w Y ork: A c a d e m ic P re ss .H o n g , S e h e e , M a ry L . M a lik , a n d M in -K y u L e e . 2 0 0 3 . “ T e s tin g C o n fig u ra l, M e tric , S c a la r, a n d
L a te n t M e a n In v a ria n c e a c r o s s G e n d e r s in S o c io tr o p y a n d A u to n o m y U s in g a N o n -W e s te rn
S a m p le .”
Educational and Psychological M easurement
6 3 :6 3 6 - 5 4 .H u , L i- T z e , a n d P e te r M . B e n tle r. 19 9 9. “ C u to f f C r ite r ia f o r F ix In d e x e s in C o v a ria n c e S tru c tu re
A n a ly sis: C o n v e n tio n a l C r ite r ia v e rsu s N e w A lte rn a tiv e s.”
Structural Equation Modeling
6 : 1 - 5 5 .
K a s a rd a , Jo h n , a n d M o rris Ja n o w itz . 197 4. “ C o m m u n ity A tta c h m e n t in M a s s S o c ie ty .”
American
Sociological Review
3 9 :3 2 8 - 3 9 .K ro s n ic k , Jo n A ., a n d M a tth e w K . B e re n t. 19 9 3. “ C o m p a r is o n s o f P a rty I d e n tif ic a tio n a n d P o lic y
P r e fe re n c e s : T h e I m p a c t o f S u r v e y Q u e s tio n F o r m a t.”
Journal o f Political Science
3 7 :9 4 1 - 6 4 .K w a k . N o jin , X ia o r u W a n g , a n d L a u re n G u g g e n h e im . 2 0 0 4 . “ L a u g h in g A ll th e W ay: T h e
R e la tio n s h ip b e tw e e n T e le v is io n E n te r ta in m e n t T a lk S h o w V ie w in g a n d P o litic a l E n g a g e m e n t
a m o n g Y o u n g A d u lts.” P r e s e n te d a t th e A n n u a l M e e tin g o f th e A s s o c ia tio n f o r E d u c a tio n in
J o u r n a lis m a n d M a s s C o m m u n ic a tio n , T o r o n to , C a n a d a .
M a lh o tr a , N e il, J o n A . K ro s n ic k , a n d R a n d a ll K . T h o m a s . 2 0 0 9 . “ O p tim a l D e s ig n o f B r a n c h in g
Q u e s tio n s to M e a s u r e B ip o la r C o n s tr u c ts .”
Public Opinion Quarterly
7 3 : 3 0 4 - 2 4 .M e r e d ith , W illia m . 1 9 93. “ M e a s u r e m e n t I n v a ria n c e , F a c to r A n a ly sis, a n d F a c to ria l I n v a ria n c e .”
Psychometrika
5 8 : 5 2 5 - 4 3 .M ille r, P e te r V. 1 984. “A lte r n a te Q u e s tio n F o r m s f o r A ttitu d e S c a le Q u e s tio n s in T e le p h o n e
In te rv ie w s .”
Public Opinion Quarterly
4 8 : 7 6 6 - 7 8 .M ille r, W a r re n E . 198 0. “ D is in te r e s t, D is a ffe c tio n a n d P a r tic ip a tio n in P re s id e n tia l P o litic s.”
Political Behavior 2:1-32.
M ille r, W a r re n E „ D o n a ld R . K in d e r, a n d S te v e n J. R o s e n s to n e . 1 999 .
“American National
Election Studies, 1992 Time Series Study [Dataset].”
A n n A rb o r: U n iv e rs ity o f M ic h ig a n ,C e n te r f o r P o litic a l S tu d ie s .
M o rre ll, M ic h a e l E. 2 0 0 3 . “ S u rv e y a n d E x p e r im e n ta l E v id e n c e f o r a R e lia b le a n d V a lid M e a su re