Distribution of Water...(Pramono)
Distribution of Water Infiltration Rate
in Ciliwung Watershed
Irfan B. Pramono
Watershed Management Technology Center Corresponding author (email: [email protected])
Abstract
Floods in Jakarta showed that the Ciliwung watershed and surrounding areas in critical condition. More than 50 % of land cover Ciliwung watershed is residential. Planting trees in residential areas have been
insufficient to infiltrate as much water into the ground. Infiltration well is one possibility for absorbing
water in residential areas. The purpose of this study was to determine the variation in the level of water absorption Ciliwung watershed and surrounding areas. The method used is overlaying analysis of the factors
that determine the rate of water infiltration with geographic information system. Each of these factors gave weights and scores to obtained variations Ciliwung water infiltration rate. The results showed that the
regions with the highest levels found in the upper catchment area and the city of Bogor, middle absorbtion water area was in Bogor Regency, low water absorption areas in Depok , South Jakarta , and East Jakarta . While in North Jakarta, Central Jakarta and West Jakarta the water absortion is very low level due to the shallow ground water level and very low soil permeability. Map variations in water absorption can be used as a material consideration for determining the locations of recharge wells effectively.
Keywords: Flood, recharge area, infiltration wells
Abstrak
Banjir yang rutin terjadidi Jakarta menunjukkan bahwa DAS Ciliwung dan sekitarnya dalam kondisi kritis. Lebih dari 50% penutupan lahan DAS Ciliwung adalah permukiman dengan tipe rumah dan luas tanah yang rata-rata sempit. Penanaman pohon di areal permukiman sudah tidak memadai untuk meresapkan air ke dalam tanah karena hampir seluruh lahan digunakan untuk bangunan. Salah satu yang masih memungkinkan adalah pembuatan sumur resapan, namun perlu mempertimbangkantingkat resapan airnya. Tujuan penelitian ini untuk mengetahui sebaran tingkat peresapan air di DAS Ciliwung dan sekitarnya. Metode yang digunakan adalah analisis tumpang susun faktor-faktor yang menentukan tingkat peresapan air dengan sistem informasi geografi. Masing-masing faktor penentu peresapan air diberi bobot dan skor sehingga diperoleh variasi tingkat peresapan air DAS Ciliwung. Hasilnya menunjukkan bahwa daerah yang mempunyai tingkat peresapan tertinggi terdapat di daerah Puncak dan Kota Bogor, daerah peresapan sedang di Kabupaten Bogor, daerah peresapan air rendah di Kota Depok, Jakarta Selatan, dan Jakarta Timur. Adapun wilayah Jakarta Utara, Jakarta Pusat, dan Jakarta Barat tingkat peresapannya sangat rendah karena ketinggian muka air tanahnya dangkal. Peta variasi peresapan air ini dapat digunakan sebagai salah satu bahan pertimbangan untuk menentukan lokasi-lokasi pembuatan sumur resapan yang efektif.
Kata kunci: Banjir, peresapan air, sumur resapan
Introduction
Floods in Jakarta grew bigger with the increasing impact of losses. Floods in Jakarta in 2002 caused losses of Rp. 9.8 trillion,
while floods in 2007 and 2013 respectively
cause harm Rp.5,16 trillion and Rp 20 trillion (Ratnaningsih, 2013). Flooding is mainly caused by two things: the supply of high water from upstream areas and the lack of channels and inadequate drainage in the downstream
areas. Handling of downstream flooding is needed to cope with the flood quickly.
However, the increase in the downstream
drainage capacity will never be sufficient if the
upstream area is not addressed, particularly in
improving water infiltration.
Harisuseno et al. (2014) suggested that the parameters that affect the value of runoff is the rainfall intensity, land use and soil type. Surface runoff will be reduced by drainage channels with good and adequate capacity. Flooding occurs because the drainage channels are not able to accommodate the discharge
of runoff. Rahmat and Pamungkas (2014) in their study in Makassar concluded that the
vulnerability factor influencing flooding is
inadequate drainage conditions, the location of settlements in the accumulation of puddles,
and decrease in soil infiltration.
Land cover of Ciliwung watershed is dominated by settlements (Pramono et al. 2013). Existing settlements are not like a yard where there are still parts of vegetation to absorb water, but dense settlements in which nearly all the surface is covered by a layer of impermeable so that there is no place for
rainwater to infiltrate into the ground. Boggs
and the Sun (2011) compared the hydrological characteristics of the watershed urban (44% of the land covered housing) and wooded watershed in North Carolina (99% forest), rainfall during the study in both locations is
almost the same, namely 376 mm and 389 mm
respectively for urban and forested watershed,
the results show that the runoff coefficient for
urban watershed of 0.42 and 0.24 forested
watershed. Urban watershed flood peak at 76,6 mm / day and in a forested watershed 5.8 mm / day. Green Open Space (RTH) in urban areas is also capable reduces runoff coefficient
(Fatima et al., 2011). Conversely, an increase in residential area in the catchment areas resulted in decreased water level of wells
and increase runoff by 37.5% in Gunungpati,
Semarang (Dewi & Rudiarto, 2014)
Low water absorption causes the groundwater reserves to be greatly reduced as observed in hydrological station Katulampa, Bogor, and hydrological station Sugutamu, Depok. Whereas the groundwater availability is important to supply domestic needs (Jumadi
& Priyana, Y., 2015). Groundwater flow (base flow) in both stations decreased significantly
over the last 30 years (Subagyono & Pawitan 2008). Pancawati (2013) mentions that the water catchment land required to meet the needs of clean water for residents of Tangerang City is 589 444 ha, while the condition of
green open land area of only 7,705 ha.
Resettlement areas in Ciliwung occupies the largest share, ie 51.53% of the watershed area. Going forward, the greater comprehensive settlement in line with population growth in the Greater Jakarta area. Dewi (2011) says there are four factors that need to watch the issue of settlements in Sub Ciliwung Hulu namely, 1) the settlement developed very fast, 2) land degradation, 3) high population growth, and 4) implementation of spatial inconsistent with Areal Space in Regional Planning (RTRW). These conditions have potential to enlarge
flood in Jakarta. Singgih (2000) in Pawitan
(2002) said that the settlement in the Upper Ciliwung from 1981 to 1999 rose 98.82%, while in the same period in the Middle
Ciliwung, the settlement rose 70.94%. The
impact of land use change cause increasing the Ciliwung upstream discharge by 68% and 24% Middle Ciliwung (Pawitan, 2002). Furthermore Pawitan (2002) concluded that the appropriate land management in Ciliwung upstream can control discharge and volume of
downstream flooding.
In order to overcome the floods in Jakarta,
Jakarta Provincial Government through regional cooperation forum main civil partners provide grants to regions upstream, including the Bogor Regency Rp. 5 billion for watershed handling (Anonymous, 2013). The grants are used among others for building
infiltration wells in Bogor, expecting to reduce the flooding that occurred in Jakarta.
As catchment wells in dense residential area is one of the solutions to reduce the supply of
water flooding (Subagyono & Pawitan 2008; Joga, 2009; Fakhrudin 2010; Pramono, 2013).
In addition, recharge wells can function increase groundwater recharge (Purnama et al., 2006 and Samsuhadi, 2009).
Each location has a different ability to absorb water, therefore the effectiveness of recharge wells depending on site conditions and its ability to absorb water. Water catchment area is a place where rain water can get into the soil
ability to absorb water in the soil is influenced
by several factors, including the type of rock, soil texture, slope, rainfall factor, and the depth of the ground water level (Wibowo 2006). In order for grant administration to meet the construction of recharge wells and measurable
targets in reducing flooding in Jakarta, it is
necessary for mapping the distribution of
water infiltration rate in Ciliwung and its
surroundings. This study aims to identify the
distribution map of water infiltration rate in
Cilwung watershed and surrounding areas that
contribute for flooding in Jakarta. From the
map it can be seen: 1). areas that are most able
to absorb water, 2). locations are prioritized for making of recharge wells. This information is expected through the allocation of aid from Jakarta can be more proportionally to the rate of water absorption.
Research Method
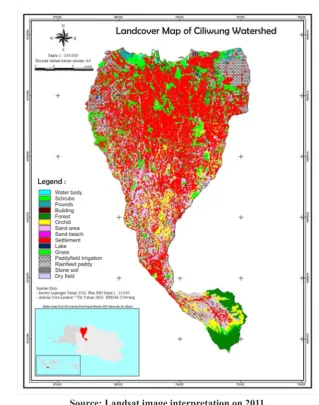
The study was conducted in 2013. The research locations covering the entire watershed Ciliwung and its surrounding such as watershed of Angke, Cakung, Krukut, Pesanggrahan, Buaran, and Sunter. Land cover map of Ciliwung watershed can be seen
in Figure 1.
Source: Landsat image interpretation on 2011 Figure 1. Land cover map of Ciliwung Watershed
The method used is overlaying analysis of the factors that determine the rate of water
infiltration with geographic information
system. Each of these factors gave weights and scores to obtained variations Ciliwung water
infiltration rate are rock types, rainfall, soil
texture, slope, and depth of the groundwater. Each factor is given a score and weighting then overlaid using Geographical Information
Systems. The level of water infiltration derived
from combining these factors. Table 1 shows the weight values of each parameter (Wibowo, 2006). The Highest weighting given to the
parameters that the most influence on water infiltration.
Table 1. Weight of water infiltration parameters
No Parameter Weight Category
1 Rock type 5 very high
2 Rainfall 4 High
3 Soil texture 3 Moderate 4 Slope steepness 2 Low
5 Depth of water
table 1 very low
Source : Wibowo (2006)
Rock Types
Rock type data are obtained from the Geologic Map Jakarta Scale 1: 250,000. Distribution of scores on each type of rock can be seen in Table 2. The type of rocks that have high permeability has a high score.
Table2. Score of rock types
No Rock type Score Category
1 alluvial deposits 5 very high
2 young sediments
4 tertiary sediments 2 Low 5 instrusive rocks 1 very low Source: Wibowo (2006)
Rainfall
The intensity of the rain effect on the
rate of water infiltration. High intensity
rainfall will absorb less water than the rain at low intensity. To assess the value of the requested amount of rainfall and rainy days with the following formula:
FH = 0.01 * P * HH
Where :
FH : Rainfall factor
P : Rainfall (mm)
HH : Rainy Day (day)
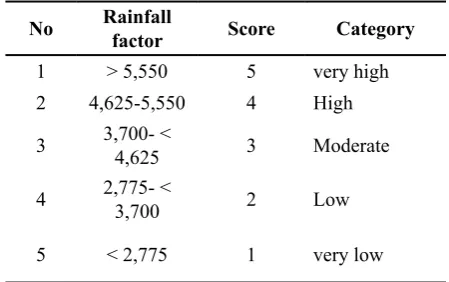
The division of the rain factor scores are presented in Table 3.
Table 3. Score of rainfall
No Rainfall
Soil texture affect the rate of water infiltration.
The rough texture like sand will absorb more water than that loam soil texture. Distribution of scores soil texture can be seen in Table 4.
Table 4. Score of soil texture
No Soil texture Score Category
1 very rough 5 very high
2 rough 4 High
The smaller the slope of an area, the greater the
chance of water infiltrate into the ground so that the flat area of highest water permeability
rate, and vice versa in areas with high slopes
will have a low level of water infiltration. The
Table 5. Score of slope steepness
No Slope
steepness Score Category
1 < 8 5 very high
2 15-8 4 High
3 >15-25 3 Moderate
4 >25-45 2 Low
5 > 45 1 very low
Source: Wibowo (2006)
Groundwater Depth
The greater the depth of the ground water level, the greater its ability to absorb water. Scores depth of ground water level can be seen in Table 6.
Table 6. Score of ground water level
No Water table
depth Score Category
1 > 30 5 very high
2 >20-30 4 high
3 >10-20 3 moderate
4 > 5-10 2 low
5 < 5 1 very low
Source: Wibowo (2006)
The depth of the groundwater table was obtained from secondary data and
direct measurements in the field. Direct
measurement is done by measuring the depth of the well from upstream to downstream.
The level of water infiltration is determined
by summing the multiplication of weight (Table 1) and score (Table 2 to Table 6). Geographical Information Systems (GIS)
is used to analyze water infiltration level spatially. The overlaying of water infiltration
level map and administration map can be
produced map of distribution water infiltration
level in Ciliwung watershed.
Results
Rock Types
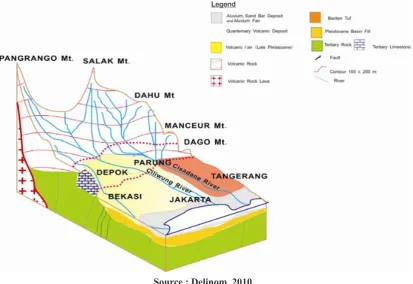
Based on the Geological Map Scale 1: 250,000 Sheet Jakarta (Effendi et al. 1998), the rock types in Ciliwung consist of alluvial deposits spread downstream and river banks, while the type of rock in the middle of the Ciliwung is precipitated quarter. Upstream of Ciliwung dominated by Tertiary sediment and intrusive rocks fraction. Geological cross sections in Jakarta and surrounding areas can be seen in Figure 2.
Source : Delinom, 2010.
Rain Factor
Rain factor is mapped Thiessen Polygon method. Based on the registration of rain in the downstream (rain station Cawang), in the middle (rain station Depok), and upstream (Bogor and Puncak rain station) then rain in Ciliwung included in the score 3 to 5 by a
factor of rainfall ranges various from 3700 to
5550.
Soil Texture
The soil texture in Ciliwung watershed is
dominated by fine texture that spread in the
middle. The soil texture in the upstream Ciliwung was coarse and downstream has
a fine texture that is clay sediment along the
coast bordering the rough textured.
Slopes
Slope in Ciliwung watershed is dominated by
flat slope (<8%) spread downstream, while in
the midlle area has a slope ranging from 8 to 15%. The steep slopes only occurred in the upstream.
Groundwater Depth
The depth of the ground water level in Ciliwung very varied. In general, the more upstream depth of the ground water level to deepen. However, at certain points there is a distorted caused by the aquifer-local aquifer or perched aquifer in these places. Perched aquifer is an aquifer that is above the groundwater level the main or regional ground water table. Perched aquifer occurs because there impermeable layer above the main ground water level. In the downstream area of the well depth of less
than five meters, while in the central area has a large range ranging from five to 30 m and in
the upstream face of the groundwater depths up to more than 30 m.
The Rate of Water Infiltration Ciliwung Watershed And its Surrounding Area
Based on the analysis of overlaying spatial data on the types of rock, soil texture, rainfall, slope, and depth of the ground water level has been given a weight and then obtained a score Watershed map as shown in Appendix
1. From Appendix 1 can be seen that the area has a very high permeability spread in the city of Bogor and upper area. As for having a high permeability rate spread in Bogor District. The level of permeability of water being dispersed in Depok, South Jakarta and East Jakarta. In North Jakarta and West Jakarta has a low permeability rate for the depth of ground water table is shallow. Although the permeability in
the upstream is highest, the infiltration rate is
not highest due to steep slope. The water has
little time to infiltrate in the soil. By contrast,
in the city of Bogor with permeability lower than at the upper watershed (Puncak), but the
infiltration is higher because the area is flat.
Discussion
There are some parameters for identification
of groundwater recharge. Preeja et al.,(2011)
proposed 7 parameters such as land cover,
drainage density (Dd) , lineament density, soil, slope , geomorphology, and lithology. Kaliraj et al.(2014) proposed 11 parameters such as lineament, slope, soil permeability, soil texture, soil depth, geomorphology, geology, drainage, land cover, aquifer, and annual rainfall. While Chacahadi (2015) gave 6 parameters namely
slope, aquifer specific yield, land cover, depth
of groundwater table, surface geology, and topography. Furthermore, Yeh et al,(2016)
gave 5 parameters for identification of
groundwater recharge namely lithology, land cover, lineament, Dd, and slope. Based on the previous research there are many parameters for determining groundwater recharge, but some parameters can be grouped. Lineament, Dd, geology, and aquifer, for example, can be grouped as rock type. Soil permeability, soil texture, and soil depth can be grouped as soil type.
Important parameter such as water table did not mentioned by the researchers. Water table parameter is simple and an insensitivity to the mechanism by which water moves through the unsaturated zone (Healy and Cook .2002). Chacahadi (2015) also mentioned that water
table is one of 6 parameters for identification
table is important parameter for identification
of groundwater recharge.
Parameters such as slope and rainfall are also important parameters and these parameters are used by the researchers. Kaliraj et al. (2014) used annual rainfall while Thomas et al.(2016) mentioned that groundwater recharge is
influenced by rainfall intensity. In order to
simplify parameter, the research uses the most important parameter such as slope, rainfall, rock type, soil texture, and water table depth.
The results of the analysis of water infiltration
rate in the catchment areas are almost same to as the results of Fakhrudin (2010), except for the catchment areas in the Middle Ciliwung. His research concluded that the rate of declining
infiltration wells in the Upper, Middle, and Lower respectively by 0.94 to 1.14 cm / min, 0.63 to 0.64 cm / min, and 0.24 to 0, 43 cm /
min.
Based on the results overlay as seen in Figure 9, the most effective absorption wells (the highest absorption rate) is located in the city of Bogor. In the city of Bogor very likely
developed infiltration wells because the area
is a residential area and the topography is
relatively flat. The capacity of absorption
wells per 100 m2 plots in the city of Bogor can be made with a volume of 3 m3. Water conservation for the summit area need a
combination of infiltration wells and water trap
for forests, ponds for agricultural areas. For the city of Depok, South Jakarta and East Jakarta,
which has a water infiltration rate lower,
water conservation, can be done by making the recharge wells but with volume sizes
larger than in the city of Bogor. Revitalization lakes need to be done in the area of Depok, South Jakarta and East Jakarta. While the area
of Central Jakarta, North Jakarta and West
Jakarta are less suitable for absorption well
due to lower infiltration rate and the depth of
ground water table is relatively shallow.
Conclusions
- The regions that have a large degree
of permeability distribute from upper watershed (Puncak) to the city of Bogor. Depok City, East Jakarta, and South Jakarta has a lower permeability rate, whereas in Central Jakarta, North Jakarta and West Jakarta has the lowest rate of permeability.
- Water conservation by infiltration wells
are very suitable to be applied in the city of Bogor and Puncak. Application of recharge wells to Kota Depok, South Jakarta and East Jakarta needs to be made with a larger capacity than the absorption wells made in the city of Bogor and Puncak.
- Advantages of recharge wells in addition
to reducing flooding can also increase soil
water reserves. The economic value of soil water reserve additions need to be taken into account so that the cost of making
infiltration wells more economical.
- Cooperation between districts and
between provinces should be improved
to cope with flooding in Jakarta. Map of water infiltration can be used to determine
the allocation of aid from downstream to upstream areas.
References
Anonim. (2013). Ahok : Hibah Rp. 5 milyar ke Bogor mungkin kurang. KoranTempo 30 Oktober
2013.
Boggs, J.L. & Sun, G.(2011).Urbanization alters watershed hydrology in the Piedmont of North Carolina. Ecohydrology 4: 256-264
Chachadi, A.G. 2015. New indicators based method SALDIT for delineation of natural groundwater recharge area. Aquatic Procedia 4: 649-659 on International Conference on
Delinom, R.M. (2010). Geology and hydrogeology of Ciliwung watershed in integrated watershed management for sustainable water use in a humid tropic tropical region.
Bulletin of the Terrestrial Environment Research University of Tsukuba 10 (Supplement
No.1): 27-34.
Dewi, I.K. (2011). Faktor-faktor yang berpengaruh terhadap keberlanjutan kawasan pemukiman di DAS Ciliwung Hulu, Kabupaten Bogor. J.Ekologia 11(1): 12-20.
Dewi, N.K. & Rudiarto, I. (2014). Pengaruh konversi lahan terhadap kondisi lingkungan
di wilayah Peri-urban Kota Semarang (Studi kasus: Area berkembang Kecamatan
Gunungpati). J. Pengembangan Wilayah dan Kota 10 (2): 115-126.
Effendi, A.C., Kusnawa & Hermanto, B. (1998). Peta geologi daerah Bogor, Jawa, Indonesia. Puslitbang Geologi Bandung, Indonesia
Fakhrudin, M. (2010). Kajian sumur resapan sebagai pengendali banjir dan kekeringan di Jabodetabek. J.Limnotek 17 (1) : 8-16. Limnologi LIPI.
Fatimah, I.S., Munandar, A. Sinukaban, N. & Kolil. (2011).Aplikasi program analisis Citygreen 5.4 untuk kajian ruang terbuka hijau (RTH) dan manfaat layanan tertentu ekosistem Kota Bogor. Ekologia 11 (1): 1-11.
Harisuseno, D., Bisri, M., Yudono, A. & Purnamasari, F.D. (2014).Analisa spasial limpasan
permukaan menggunakan model hidrologi di wilayah perkotaan. J. Environmental
Engineering & Sustainable Technology 1 (1): 51-57
Healy, R.W. & P.G.Cook.2002. Using groundwater levels to estimate recharge. Hydrogeology Journal 10 (1): 91-109
Joga, N. (2009). Ekspedisi Ciliwung. Laporan Jurnalistis Kompas. Mata Air. Air Mata.Gramedia.
Jumadi, J., Priyana, Y., 2015. Development and Evaluation of Web GIS Application for
Groundwater Management of Karanganyar Regency. Forum Geografi 29, 165–174. Kaliraj, S., N.Chandrasekar, N.S. Magesh.2014. Identification of potential groundwater
recharge zones in Vaigai upper basin, Tamil Nadu, using GIS-based analytical hierarchical
processes (AHP) technique. Arab J. Geosciences 7 (4): 1385-1401
Pancawati, J. (2013). Ketersediaan lahan resapan air di Kota Tangerang. J. Ilmu Pertanian dan
Perikanan 2 (1) : 11-18. Univ. Sultan Ageng Tirtayasa, Serang, Banten.
Pawitan, H. (2002). Hidrologi DAS Ciliwung dan andilnya terhadap banjir di Jakarta. Makalah
disajikan dalam Lokakarya Pendekatan DAS dalam menanggulangi banjir Jakata,
diselenggarakan oleh Lembaga Penelitian IPB bekerjasama dengan Andersen Consult, Jakarta, 8 Mei 2002.
Pramono, I.B. (2013). Cara alami atasi banjir Jakarta. Republika online 22 Januari 2013.
Pramono, I.B., Paimin, Basuki, T.M. & Purwanto (2013). Kajian Aplikasi “Tipologi DAS”
dalam Pengembangan sistem perencanaan pengelolaan DAS lintas propinsi. Laporan Hasil Penelitian BPTKPDAS Surakarta.
Preeja, K.R., S. Joseph, J.Thomas, H. Vijith.2011. Identification of groundwater potential zones
of Tropical river basin (Kerala, India) using Remote Sensing and GIS techniques. J.Indian Soc.Remote Sensing 39 (1):83-94
Purnama, S., A Kurniawan, Sudaryatno. 2006. Model konservasi air tanah di daerah pantai Kota
Rahmat A.R. & Pamungkas, A. (2014). Faktor-faktor kerentaan yang berpengaruh terhadap
bencana banjir di Kecamatan Manggala Kota Makassar. J. Tehnik Ponits 3(2): 178-183
Ratnaningsih, M. (2013). Analisis dampak kerugian banjir di Jakarta. Diskusi Panel:
Membumikan upaya mengatasi banjir Jakarta secara holistic dan terintegrasi. Yayasan
Sarana Wana Jaya dan Ditjen BPDAS& PS. Jakarta: 7 Mei 2013.
Samsuhadi. (2009). Pemanfaatan air tanah Jakarta. JAI. 5 (1): 9-22.Badan Pengkajian Penerapan Teknologi, Jakarta.
Subagyono, K. & Pawitan, H. (2008). Water harvesting techniques for sustainable water
resources management in the catchment area. Proceedings of International workshop on
integrated watershed management for sustainable water use in a Humid Tropical Region.
Bull. Univ. Tsukuba 8 (Supplement No. 2): 18-30.
Thomas, B.F., A.Behrangi, and J.S. Famigilietti. 2008. Precipitation intensity effects on groundwater recharge in the Southwestern United States. Water 8 (90):1-15
Wibowo, M. (2006). Model penentuan kawasan resapan air untuk perencanaan tata ruang
berwawasan lingkungan. J. Hidrosfir 1(1): 1-7. Badan Pengkajian dan Penerapan
Teknologi, Jakarta.
Forum Geograf
i
,
V
ol 30 (1) July 2016: 24-33
Distribution
of W
ater
...(Pramono)