Published online EarlyView 21 November 2013 in Wiley Online Library (wileyonlinelibrary.com) DOI: 10.1002/smj.2207 Received 13 June 2011;Final revision received 18 October 2013
DOMINANT DESIGNS, INNOVATION SHOCKS,
AND THE FOLLOWER’S DILEMMA
NICHOLAS ARGYRES,1* LYDA BIGELOW,2and JACK A. NICKERSON1 1Olin Business School, Washington University in St. Louis, St. Louis, Missouri,
U.S.A.
2David Eccles School of Business, University of Utah, Salt Lake City, Utah, U.S.A.
A dominant design is thought to usher in a period of intense competition based on cost, causing an often-fierce industry shakeout. We aim to challenge the foundations of the dominant design literature, and develop new insights about the evolution of competition. We argue that strategic repositioning and elevated exit rates are often observed long before the emergence of a dominant design, and that a key cause is the introduction of a particular product for which demand is unexpectedly high (an “innovation shock”). This introduction creates a dilemma for followers, which we suggest is resolved based on followers’ comparative adjustment costs. We test implications of these ideas on data from the early U.S. auto industry, treating Ford’s Model T as the innovation shock. Copyright2013 John Wiley & Sons, Ltd.
INTRODUCTION
The notion of “dominant design” has long been featured prominently in the literatures on industry evolution, technology management, and strategy. Since Utterback and Abernathy’s (1975, 1978) seminal articles proposing a model of industry life cycles, numerous studies assume, investigate, or develop the idea that the emergence of a dominant design leads to an industry shakeout (elevated net exit rates over a short period of time) as cost becomes the primary basis of competition. Seminal contributions to business strategy such as Porter (1980), Teece (1986), and Anderson and Tushman (1990) also have been influenced by, and have contributed to, theories of dominant design.
While highly influential, theories of dominant design suffer from several shortcomings. First, scholars have argued that the theories lack a
Keywords: dominant design; industry evolution; innova-tion; strategic positioning; industry shakeout
*Correspondence to: Nicholas Argyres, Olin Business School, Campus Box 1133, Washington University in St. Louis, St. Louis, MO 63130. E-mail: [email protected]
Copyright2013 John Wiley & Sons, Ltd.
the demand for which surges in an unanticipated way. We call this shift an “innovation shock.” Examples of such pioneering products include the 1906 Underwood Model 5 typewriter, the 1908 Ford Model T, the 1952 RCA color television, the 1984 Apple Macintosh computer, the 2001 Apple iPod, and the 2007 Apple iPhone. We also suggest that while dominant designs do not typically ini-tiate shakeouts, shakeouts sometimes do emerge as anoutcome of the strategic dynamics launched by an innovation shock. When a dominant design does emerge, it can exacerbate a shakeout that is already underway.
Second, we characterize the industry dynamics that an innovation shock initiates—what we call “The Follower’s Dilemma.” While dominant design theories consider only imitation and exit as strategic responses, we suggest that an innovation shock can also lead to strategic repositioning by incumbents, and to changes in entry patterns. We develop the idea that an incumbent’s ability to reposition away from the firm that initiated the innovation shock is determined by the incumbent’s comparative adjustment costs. Firms are thus not entirely at the mercy of technological forces in the environment as suggested by dominant design theories. To the contrary, we suggest that strategic management and managerial decision making play important roles in determining a firm’s best response to, and therefore its likelihood of survival following, an innovation shock.
We conduct an empirical analysis of the early U.S. auto industry to test several implications of these arguments. The auto industry was the original setting in which Abernathy and Utterback (1975, 1978) developed the concept of a dominant design, based in part on Abernathy’s (1978) historical research. Using a more comprehensive dataset than was available to earlier researchers on dominant design in automobiles, we show that a period of increased exits in the U.S. auto industry began shortly after Ford’s introduction of the Model T, not later (i.e., around 1923) as had been assumed in earlier studies. The elevated exit rates suggest that it was the innovation shock represented by the Model T more than a decade earlier, not the later adoption of a common product architecture across the industry as a whole (a “dominant design”) that marked the transition between the initial stage of the industry’s evolu-tion and the following stages of rising exit rates and the ultimate shakeout. While the eventual
emergence of a dominant design did accelerate this shakeout, it did notspark the shakeout.
We also examine firms’ responses to the introduction of the Model T as a way to begin to explore the role of comparative adjustment costs in conditioning the Follower’s Dilemma. We show that, consistent with resource/capabilities approaches to strategy and concepts from organi-zational ecology, the firms most likely to exit the segment defined by the Model T while remaining active in the industry were smaller, younger firms with a broader base of technological knowledge (by our proxy). We suggest that these findings are consistent with our arguments about comparative adjustment costs, while not inconsistent with other theories of industry evolution such as those based on Klepper (1996). We conclude by suggesting that a more complete theory of the Follower’s Dilemma requires greater understanding of the comparative adjustment costs that various kinds of firms face in responding to an innovation shock.
LITERATURE REVIEW AND THEORETICAL DEVELOPMENT
The notion of an industry life cycle has a substan-tial history in research in economics, management, strategy, and innovation. In early work, Aber-nathy (1978), Utterback and AberAber-nathy (1975), and Sahal (1985) argued that industries tend to shift from an initial stage of product design exper-imentation by firms to a stage featuring process innovation aimed at cost reduction. At some point, this experimentation leads to the emergence of a dominant design, defined as “the concepts that define how the components of the product interact or relate to each other” (Christensen, Suarez, and Utterback, 1998: S208). The basis of competition then shifts from alternate product designs to low-cost production of products that are based on the dominant design. This cost competition leads to an industry shakeout, which is marked by a substan-tial portion of industry participants exiting during a brief window of time.
experimentation, which ceases with the emergence of the dominant design. In this characterization of industry evolution, a dominant design emerges through a variation-selection-retention dynamic, which poses real, albeit poorly understood, chal-lenges for managers (Anderson and Tushman, 1990). The dominant design concept has also helped shape the strategy literature on entry timing (e.g., Lieberman and Montgomery, 1998; Mitchell, 1989; Tegarden, Hatfield, and Echols, 1999).
While the dominant design concept is not always considered in the organizational ecology literature, that literature has sometimes used the idea of a “dominant architectural solution” to demarcate historical period (e.g., Carroll and Han-nan, 1995; Wade, 1995). The themes associated with the dominant design model emerge once again in this literature, which describes a period of high rates of experimentation with technical and organizational architectures, ultimately followed by a period of concentration and lower levels of variation, etc. The ecology literature implies that legitimation processes drive the selection of a dominant solution, so that such a solution is not necessarily the most efficient or effective from a technical standpoint.
A key feature of the organizational ecology perspective on industry dynamics is that it allows for differential levels of entry and exit in different segments of the industry. Beginning with Carroll (1985), researchers have studied how generalist vs. specialist firm entry rates may vary based on the size of the niche they occupy in the overall population. Consistent with industry life cycle research, over time density tends to decrease while concentration increases, yet allowance is made for the possibility of viable segments of the industry far from the market center. This part of the literature is relevant to our treatment of the Follower’s Dilemma. However, implications for strategic decisions by firms confronting a period of elevated exit rates remain underdeveloped in the ecology literature.
Innovation researchers and economists have also developed insights regarding the types and timing of innovation that use the dominant design concept. Henderson and Clark’s (1990) seminal paper on architectural innovation, for example, outlines the implications of distinguish-ing another dimension of product innovation beyond radical vs. incremental. In particular, they define an “architectural innovation” as involving a
reconfiguration of both demand-side and supply-side arrangements for commercializing the indus-try’s dominant design. Jovanovic and MacDonald (1994) developed a formal model depicting the pattern of increasing density and entry until an event such as a new technological solution trig-gers a shakeout. The shakeout involves a drop in entry and a rise in exits, leading to a decline in the overall number of firms. This model depends on the explicit assumption that the technological shock precipitating the shakeout is exogenous to the industry.
Klepper’s (1996) seminal model of industry evolution produces the same pattern of entry, exit, and density as classic dominant design theory, but the key dynamic is not the emergence of a dominant design, but the operation of increasing returns to scale over time. In the model, early entrants eventually gain an insuperable cost advantage over later entrants into the industry because the returns to investment in cost-reducing process R&D increase with scale. Thus, as firms grow, the gap in costs between early entrants and later entrants grows larger, leading later entrants to exit. A dominant design does eventually emerge in Klepper’s model, as firms imitate each other’s innovations and customer preferences converge. But the key driver of exit is not the (later) emergence of a dominant design, but process R&D investment, which is operating from the industry’s very beginning. Klepper (2002, 2006) finds evidence for this dynamic in multiple industries, and also finds that entrants with prior experience in related industries are much more likely to survive thande novo entrants.
the traditional dominant design literature does not typically consider. Differently from population ecology, however, shakeouts are not sparked by increasing density alone, but by the introduction of an innovation shock.
Differently than Henderson and Clark’s (1990) concept of architectural innovation, our notion implies that an innovation shock occurs before a dominant design has emerged, and does not necessarily involve disruption to both demand-side and supply-demand-side linkages. Somewhat similar to Jovanovic and MacDonald (1994), we postulate that a new technological solution drives increases in exit rates (as well as repositioning) and can culminate in a shakeout. A critical point of difference is that, in our account, the solution is generated inside the industry, rather than outside it. We define an innovation shock as the introduc-tion by a firm of a new product that stimulates a substantial surge and acceleration in demand for that product— a surge that was generally unex-pected by market participants. The new product, we suggest, is based on a new configuration of attributes that might include radical or incremental innovations, and might include components devel-oped in-house or by other firms. The critical fac-tors that identify the innovation shock are that the new product represents a novelcompositionof ele-ments (even if many individual eleele-ments already existed in rival products) and that it benefits from a large, unanticipated surge in demand. We suggest that an innovation shock does not typically launch new industries. Rather, it comes along well into the industry’s early development.
An innovation shock thus reveals information about demand that implies the discovery of a “pool of revenue.” The firm introducing the innovation shock is therefore in the position to reap a sudden windfall, and to potentially capture a durable first mover advantage. The financial returns and the potential for developing longer-term advantage do not, however, go unnoticed by rivals and potential entrants. The sudden and surprising revelation that a new composition of elements is highly desired reshapes rivals’ and potential competitors’ expectations. In the wake of the demand surge, rivals and potential entrants must reassess their strategic positions in the market.
The arrival of an innovation shock forces rivals to consider three strategic responses: imi-tation, repositioning, and exit, and leads potential competitors to consider entry and imitation. For
rivals, failing to respond to the newly revealed demand information, thereby allowing the firm introducing the innovation shock to build compet-itive advantage uncontested, greatly increases the likelihood of financial loss and exit. This moti-vates rivals to strategically respond. We describe each strategic response and explain why the innovation shock stimulates it. In what follows, we refer to the product or service design that acts as an innovation shock as “ISD” for “innovation shock design.” (In earlier drafts of this paper, we used the Latin term compositio desiderata to describe an innovation shock design.)
Imitating
Rival firms, which by definition are not offering the ISD at the time of its introduction, face powerful economic pressures to respond and compete for a portion of the profit pool discovered by the innovator. It is well known that supernormal returns (i.e., economic rents) attract imitators: both incumbents repositioning to compete for these returns and new entrants (we discuss entry below). Imitation can be an economically viable strategic response for incumbents for three reasons. First, imitating the innovator’s composition of elements can lead to the capture of a share of the newly discovered profit pool. For instance, the unanticipated surge in demand may make it difficult for the innovator to satisfy all the latent demand for the ISD. Second, investing in low-cost production, a robust supply chain, developing distribution channels, brand capital, and any other co-specialized and complementary assets (Teece, 1986) needed to take full advantage of the new and growing demand (and to create imitation barriers) takes time, giving imitators a chance to respond (e.g., Markides and Geroski, 2004).
that can be used against them. At some point, it can become virtually impossible for those who are late to imitate to successfully challenge the innovator.
Repositioning
With the innovator having identified substantial demand from the information shock and rapidly accumulating advantage, rivals could choose to avoid direct competition by repositioning distantly from the ISD. With the rapid acceleration in demand for the ISD, rivals positioned in a niche near the ISD before it was introduced will likely experience falling demand as its customers flock to the new composition of elements demanded. In other words, the closer the rival’s niche is to the ISD when it was introduced, the less demand the rival will realize once the innovator launches the new product or service (unless it imitates as described above). If a rival’s demand decreases and that rival does not imitate, then remaining viable in the industry requires repositioning to a more distant niche. The more successful the ISD, the more distant must be the rival’s position. Of course, distant repositioning requires the existence of residual demand in alternate market segments not served well by the ISD and its underlying co-specialized investments. If sufficient hetero-geneity in customer preferences exists and the ISD is unable to serve all demand, niche positions will exist and may be economically viable.
Exiting
With the ISD attracting imitators and remaining available niche spaces attracting firms that are repositioning, capturing profit will become increas-ingly difficult. Competition will drive rivals to pursue sources of competitive advantage, leav-ing those unable to accumulate advantage to be selected out. Those rivals that choose to compete with the innovator of the ISD will seek to acquire and/or build capabilities to capture economies of scale and scope, network externalities, etc., in order to compete. As rivals become stronger, the level of competition will ratchet upward, and exit rates will rise (e.g., Barnett, 2008).
Entering
The arrival of the innovation shock generates knowledge about the constellation of product
features needed to access the newly discov-ered pool of revenue, which may stimulate entry of two kinds. First, firms operating in other industries may choose to enter if they possess resources and capabilities that are sufficiently redeployable or fungible to compete with the innovator. For instance, firms that have peted in related industries or markets, e.g., com-ponent manufacturers or firms that compete in other geographic markets, may now find that they can compete in the focal industry because the innovation shock reveals new information about not only the magnitude of profits avail-able but also the capabilities and resources needed to capture a share of those profits. It is precisely the availability of this new informa-tion that reduces the uncertainty of entering by imitation.
De novo entry also can be stimulated by the arrival of an innovation shock. Because the com-position of product and service elements that attracts a revenue pool is now known, potential entrants can now calculate their expected prof-its upon entry with greater precision. The reduc-tion in uncertainty not only occurs for prod-ucts and services near the ISD but also occurs for distant niches, which become better defined. Reduction in demand uncertainty can therefore stimulate additional entry across all industry positions.
Primary implications
Our perspective implies that strategic responses to the arrival of an innovation shock will take time—even a decade or more—to play out. For instance, a robust stream of research in organizational ecology argues that organizations vary in their degrees of inertia, defined as the inverse of adaptation speed (e.g., Amburgey, Kelly, and Barnett, 1993; Barnett and Freeman, 2001; Carroll and Hannan, 2000; Dowell and Swaminathan, 2000; Hannan and Freeman, 1984). Therefore, even if all firms become aware of the information shock at the same time, not all firms will respond immediately. The greater an organization’s inertia (which often is proxied in the population ecology literature by factors such as organizational age and size), the longer it will take to undertake “core” change and repositioning.
On a different dimension, the narrower the tech-nological base of the firm prior to the introduc-tion of an innovaintroduc-tion shock, the less likely it will be able to switch segments quickly if doing so requires a different technology base. This lag in adjustment is due to the cost and time required to acquire, develop, and apply the requisite knowl-edge (e.g., Dierickx and Cool, 1989). Because of heterogeneity in inertia and in prior knowledge among rivals, response times will vary signifi-cantly after an innovation shock is introduced. Many slow responders will be forced to exit.
A second implication of our perspective is that a dominant design emerges long after the ISD, in part because it is an endogenous outcome of the innovation shock. Because the impact of the emer-gence of a dominant design on exit rates occurs only after its emergence, its effects come much later in the industry’s life cycle. Thus, after an innovation shock is introduced, competitive inten-sity will increase in the industry segment in which it is introduced, and possibly in adjacent segments as well. Competitive intensity will continue to increase over time because, after the innovation shock arrives, an increasing number of firms try to execute their best strategic response. With increas-ing competitive intensity, firms find it in their inter-est to search for sources of competitive advantage, creating additional pressures for slower and weaker firms to exit. Imitating, repositioning, and search-ing for competitive advantage, as well as attempts to neutralize others’ competitive advantages, will
in turn naturally lead to architectural similarity of products within each industry segment (even though individual features may continue to evolve as part of the competitive process). For instance, a rival may reposition to closely copy the ISD by imitating the first mover’s product or service features exactly, or may offer more (fewer) incre-mental innovative product or service features to the same product architecture in order to achieve a price premium (or cost advantage). If numerous firms choose to imitate the first mover in these ways, the industry segment in which the innovation shock was introduced becomes more homogeneous in terms of the features of the segment’s products and services. Eventually, the homogenization may spill over to adjacent segments, ultimately giving rise to a dominant design for the industry as a whole. By the end of this process, the eventual dominant design may contain some of, but not nec-essarily all, the features of the ISD.
Once the dominant design is established, compe-tition based on economies of scale and incremen-tal, component-level innovation will lead to fur-ther exit, as Abernathy and Utterback (1978) pro-posed. Firms not producing the dominant design, and unable to switch to it, are likely to exit the industry (Anderson and Tushman, 1990). But the exits associated with the emergence and establish-ment of the dominant design come much later in the industry’s development, and therefore cannot explain the elevation in exit rates that occurs ear-lier, around the time that the innovation shock was introduced. Indeed, the fact that researchers define the dominant design as the majority of indus-try participants providing products with the same architecture (e.g., Tegardenet al., 1999) itself sug-gests that much of the competitive action occurs long before the dominant design becomes estab-lished.
Who chooses which strategy?
describes (1980, 1985)? We suggest that an inno-vation shock is an important antecedent for the four strategic responses. Practitioners and schol-ars alike would benefit from a theory that predicts which strategy a rival or potential entrant will choose in response to an innovation shock, and when they will choose it. Although our paper does not offer such a complete theory, we nonetheless sketch the outline of a theory that makes some testable predictions, and can serve as a basis for future theorizing. Our thinking is based on the idea that an organization’s likelihood of success-fully repositioning in response to an innovation shock depends upon its initial stock of techno-logical knowledge and human, physical, and other intangible resources on the one hand, and the com-parative adjustment costs it faces of acquiring, reconfiguring, or eliminating resources as needed to support a new strategic position (e.g., Teece, Pisano, and Shuen, 1997).
Comparative adjustment costs
The arrival of an innovation shock creates an exigent environment in which a swift response is required. Delay is costly due to the very real threat of obsolescence, the likely exacerbation of poor positioning as competitors reposition, and the limited availability of viable mergers and niches. Yet despite the urgency, organizations are constrained by inertia, but more broadly by what we call comparative adjustment costs: the costs and risks of moving from an existing strategic position to each of the alternative positions of imitating, differentiating, or exiting (relative to other rivals’ adjustment costs). These adjustment costs differ for different organizations, hence our reference to comparative adjustment costs. We suggest three categories of adjustment costs, though what we offer next is not so much intended as an entirely novel theory, but rather a synthesis of factors known to affect mobility within an industry.
The three broad categories of determinants of comparative adjustment costs that we consider are: (1) internal resources, knowledge, and capabilities; (2) internal organization structure and incentives; and (3) relationships with external parties such as suppliers, buyers, and regulators. The first cate-gory includes the firm’s financial strength. Firms with greater financial resources can obviously sur-vive longer than those firms that face more severe
capital constraints. It also includes the technolog-ical knowledge currently embedded in the firm’s human and physical assets. We suggest that the broader the knowledge embedded in the firm’s assets, the lower will be the firm’s adjustment costs as it adjusts from one position to another. By contrast, firms whose embedded knowledge is narrower will face higher adjustment costs as they reposition. These higher adjustment costs arise because acquiring new knowledge, especially if some of it is tacit, is often subject to a number of failures in the strategic factors market (Bar-ney, 1986). Markets for knowledge often suffer from severe information asymmetry (e.g., Caves, Crookell, and Killing, 1983). Technology is also often embedded or lumped together with other technologies that are less desirable to the buyer, creating indivisibilities that hinder quick acquisi-tion and development (e.g., Penrose, 1959; Teece, 1982). Learning new knowledge also is often sub-ject to time-compression diseconomies, making quick learning infeasible (e.g., Dierickx and Cool, 1989). While knowledge can be gained by acquir-ing rivals or suppliers or through relationships with other firms or with outside institutions such as universities, there are often significant costs in the acquisition process and in the formation and management of interorganizational relation-ships. Often, geographic location is important in determining the ease of access to such knowledge. Regardless, however, the more that repositioning requires knowledge that the firm does not cur-rently possess, the greater are the adjustment costs it faces.
Finally, in many cases firms will have lower adjustment costs to the extent that they do not have long-term contractual commitments to employees or their unions, to suppliers, to buyers, to govern-ment agencies, etc. (Argyres and Liebeskind, 1999; Nickerson and Silverman, 2003). While strong, long-standing relationships with these external par-ties can be important in reducing adjustment costs if those relationships are built on trust and norms of reciprocity, they can be a hindrance if based more fundamentally on highly formalized contrac-tual or regulatory relationships, as is often the case (e.g., unions in the U.S. auto industry). Compara-tive adjustment costs associated with repositioning, therefore, are higher to the extent that firms rely on durable legal-contractual commitments.
HYPOTHESES
In this section, we draw on the above discussion of innovation shocks and comparative adjustment costs to develop four testable hypotheses. While there are doubtless other hypotheses that could be developed from our framework, we examine a few major implications that we are able to test on data from the early U.S. auto industry (the industry is described in the next section).
Our first hypothesis concerns the impact of an innovation shock on industry exit. It has been observed that a rise in exit rates often begins after a single pioneering firm introduces an innovation shock. The introduction of Underwood Model 5 in 1906 led immediately to a rise in exits in the typewriter industry, as did the introduction of the RCA color T.V. and the U.S. government’s adoption of its technology as a standard in 1952 (Utterback and Suarez, 1993). IBM’s introduction of the PC in 1981 encouraged the entry of clonemakers, but it also elevated exit rates such that the net effect was an immediate and severe shakeout (Dinlersoz and MacDonald, 2009). In each of these cases, a single firm transformed the industry by introducing a design with a composition of elements that immediately appealed to a very broad set of customers.
Our contention is that, in many industries, an innovation shock is the central driver of increas-ing exit rates and eventual industry shakeouts. The competitive responses unleashed by an innovation shock are so intense that the survival of all firms whose products are sold in the same industry or
industry segment are severely threatened. As we noted above, other theories have emphasized dif-ferent drivers of exits. Population ecology, for example, has emphasized that the force of legit-imation that accounts for early industry growth eventually gives way to competition as the density of firms increases beyond what is supportable in the environment (e.g., Carroll and Hannan, 1995). This theory does not feature any special role for one firm or another in driving increased exit rates and the shakeout; rather, density alone is the cul-prit. It does not afford any role for an ISD intro-duced by a single firm in causing shakeouts.
The theories of industry evolution due to Klepper and colleagues (e.g., Klepper, 1996, 2002; Klepper and Graddy, 1990) also do not afford a clear role for a single innovating firm. In Klepper’s model (Klepper, 1996), for example, the firms most likely to survive are those that entered early and those with pre-entry experience in a related industry. Early entrants are able to build a cost advantage that becomes insuperable due to increasing returns from process R&D as production scale increases. In empirical tests, early entry is usually proxied by firm size (e.g., Klepper, 2002). In Klepper’s theory, multiple early entrants could benefit from these advantages. While not inconsistent with Klepper’s theory, our argument emphasizes the role of a single firm introducing an innovation shock as a key driver of increased industry exit. We therefore hypothesize that
Hypothesis 1: The effect of an innovation shock on firms’ hazard rates of industry exit is positive and significant.
incentive systems that raise their adjustment costs. In addition, older firms are more likely to have made durable legal-contractual commitments to external parties that inhibit adjustment. Thus, setting aside the option of exiting the industry, which is discussed in regard to Hypothesis 1, inertia makes older firms less likely to reposition away from the industry segment in which an innovation shock is introduced. We therefore hypothesize that
Hypothesis 2: Older incumbents are less likely to reposition away from the industry segment in which an innovation shock is introduced.
Firm size is another variable that is frequently used as a proxy for structural inertia. Large firms are often more highly scrutinized by various audi-ences, more accountable to them for consistent behavior, and therefore less likely to make strate-gic changes (Hannan and Freeman, 1984). In addi-tion, large firms typically have made larger fixed investments in complementary assets that are spe-cific to a set of customers (e.g., Ghemawat, 1991). Indeed, these past asset commitments are often an important reason why the firm has been able to grow large in the first place, achieving either economies of scale and scope or effective differ-entiation (e.g., Chandler, 1990). Moreover, larger firms are thought to suffer from more rigid bureau-cracy (e.g., Burns and Stalker, 1961; Thompson, 1967) and lower-powered incentives (Williamson, 1985) that inhibit repositioning. Therefore, we posit that larger firms face higher adjustment costs, and are therefore less likely to strategically repo-sition following an innovation shock:
Hypothesis 3: Larger incumbents are less likely than other incumbents to reposition away from the industry segment in which an innovation shock is introduced.
The strategy literature has emphasized that sus-tainable competitive advantage rests on a firm’s bundle of unique capabilities and assets, where capabilities based on unique organizational knowl-edge are often of particular importance (e.g., Dier-ickx and Cool, 1989; Grant, 1996; Kogut and Zander, 1992; Rumelt, 1984). Moreover, the lit-erature on dynamic capabilities suggests that the “paths” open to a firm at any point in time (i.e.,
its strategic alternatives) are determined by the firm’s current “asset position,” which includes “technology, intellectual property, complementary assets, customer base, etc.” (Teece et al., 1997: 518). We therefore suggest that in many indus-tries (especially those serving consumer markets in which consumer preferences are heterogeneous), the broader a firm’s base of technological knowl-edge, the greater the likelihood of it being able to reposition away from the ISD. Avoiding direct competition with an ISD, we have argued, is often necessary for survival and for eventually gaining competitive advantage. The possibility of reposi-tioning arises because a broader technological base reduces adjustment costs associated with acquiring or internally developing the kinds of extensions to the firm’s technology base that are needed to suc-cessfully reposition. Thus,
Hypothesis 4: Incumbents with a broader base of technological knowledge are more likely to reposition away from the industry segment in which an innovation shock is introduced and focus instead on a different segment(s).
EARLY AUTO INDUSTRY
0 50 100 150 200 250 300 350
1906
Year
Density
Entering
Exiting
Number of Firms Each Year
1911 1916 1921 1926 1931
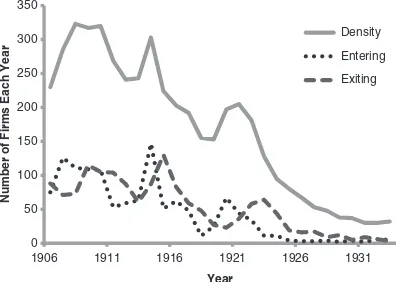
Figure 1. Exit, entry, and density of the early U.S. auto industry
in World War I began in April 1917 and ended in June 1919, which created a surge of new entrants that exceeded exits in 1920. However, by the next year, exits again exceeded entries and the number of firms resumed its decline, not to increase again until after World War II. The reason for the discrepancy in shakeout period dates is that the older data on which Suarez, Utterback and others relied was not comprehensive.
A quite plausible interpretation of our data, then, is that the auto industry shakeout attributed to the mid- and late 1920s actually began much earlier. It picked up speed in the 1920s, but did not begin in that decade. Exit rates were substan-tial starting in the early 1900s, and were briefly interrupted by a truly exogenous event: World War I and its aftermath. The database unfortunately does not contain information on the war-related production activities of the 1920 entrants. How-ever, it seems likely that some, and perhaps many, of these entrants were hoping to capitalize on knowledge gained from fulfilling government contracts for production of armaments such as personnel carriers, ambulances, tanks, and other war-related industrial goods during the war. Most of these 1920 entrants exited within a few years.
Table 1 also includes figures on Ford’s produc-tion of the Model T, which began on October 1, 1908, and peaked in 1923. Ford was a dominant player in the industry during this time, as shown by the evolution of its production share. The role of Ford as a dominant player has not been much dis-cussed in analyses of the auto industry life cycle.
The introduction of the Model T was highly anticipated by auto dealers, but Ford was not fully prepared for the tremendous demand it
generated. Production was “to order” during the first several months of its production, but by the spring of 1909, the company found that it lacked capacity to process new orders, and stopped taking them for two months (Nevins, 1954: 396). Ford began construction of its new, larger-scale Highland Park plant in 1909, but it was not completed until 1910. Even as it scrambled to increase production capacity, Ford found that it also lacked adequate marketing and distribution assets to handle the additional volume of output. During 1909–1913, Ford built a network of distribution offices (“branches”) as well as several geographically dispersed assembly plants to reduce shipping costs. It also expanded its network of independent dealers (Nevins, 1954: 400–404).
By 1911, Ford was closer to meeting demand. In that year, production increased by 118 percent. In 1912, 1913, 1914, 1915, and 1916, Ford’s produc-tion levels increased year over year by 12 percent, 114 percent, 83 percent, 63 percent and 48 percent, respectively. In the three years leading up to World War I, Ford accounted for about 50 percent of total industry production. This unanticipated surge of demand for the Model T has been widely written about, and the Model T is widely considered to be the most important car model ever introduced in the auto industry. Its popularity was largely driven by its ease of use, reliability, and low price.
Table 1. Entry, exit, and production in the U.S. auto industry
Year
Number of firms
Industry
production Ford’s production
Annual increase in Ford’s production (%)
Ford’s share of industry production (%)
1906 230 24,250 8,729 n/a 36
1907 285 33,200 14,887 71 45
1908 323 43,000 10,202 −31 24
1909 317 63,500 17,771 74 28
1910 320 123,990 32,053 80 26
1911 269 181,000 69,762 118 38
1912 241 199,319 170,211 12 39
1913 243 356,000 202,667 114 47
1914 303 461,500 308,162 83 91
1915 224 548,139 501,492 63 82
1916 203 895,930 734,811 47 25
1917 192 1,525,578 622,351 −15 87
1918 155 1,745,792 435,898 −30 49
1919 153 943,436 820,445 88 67
1920 197 1,651,625 419,517 −2 69
1921 205 1,905,560 903,814 58 80
1922 181 1,686,813 1,179,257 −10 47
1923 128 2,274,185 1,825,766 60 52
1924 95 3,624,717 1,756,880 −6 54
1925 80 3,185,881 1,651,675 −3 45
1926 67 3,735,171 1,377,241 −14 37
See text for sources.
some of the confusion around the dominant design concept.
Ford’s production levels dropped dramatically during World War I as its Rouge plant, construction of which began in 1917, was converted to produce Eagle Boats for the U.S. Navy, and as other parts of its production capability were converted for production of tanks and ambulances. In addition, private demand for Ford’s cars no doubt dropped during wartime. In 1919, however, the last year of the war, Ford’s production surged again. There were more substantial surges in 1921 and 1923.
These figures suggest a plausible alternative explanation for the pattern of exits in the auto industry. Rather than a shakeout simply being caused by the emergence of a dominant design around 1923, it seems quite likely that the shakeout was really started by the tremendous demand for Ford’s Model T around 1910–1911. The shakeout gained steam after the dominant design emerged, but was arguably initiated much earlier.
It is also instructive to consider Ford’s pricing behavior during this period. During 1908–1922, the price of Ford’s Model T fell from $440 to $335, a 24 percent drop. An increase to $393 in 1923 was followed by a decline to $380 in 1924, and then by another 24 percent drop to $290 in 1925
(Lester-Steele, 1960). These price declines were made possible by Ford’s legendary production system based on interchangeable parts (Hounshell, 1984). (Ford’s Model T may have represented process more than product innovation, whereas other innovation shocks may feature more product innovation.) Once again, economic logic suggests that these large price reductions by the dominant player—the player representing 40–50 percent of production output at key points—must have contributed to the elevated exit rates during the dominant design period.
Our price data, which covers 31 percent of the car model years in the population of U.S. auto firms, indicates that the unweighted mean car price during the period of our study was $2,104, while the median price was $1,695. Thus, Ford remained positioned in the low-end segment throughout the period. The mean auto price decreased throughout the period, likely reflecting attempts by surviving firms, especially those competing in the lower-price segment, to maintain or reduce their lower-price gaps with Ford.
to demand cars with more features than those offered by the relatively “stripped down” Model T (e.g., Kuhn, 1986). But because Ford was slow to introduce higher-priced, more differentiated models, General Motors was able to surpass Ford as market share leader in 1927, and maintained its lead for decades thereafter.
Our interpretation of the evolution of the early U.S. auto industry can be compared with that of Klepper. As noted above, Klepper’s (1996, 2002) model of (and findings regarding) industry shake-outs is based on numerous early entrants gain-ing insuperable cost advantages through cumula-tive investments in process R&D. His model does not invoke dominant designs to explain industry shakeouts. These two points are quite consistent with our interpretation. However, Klepper (1997) interprets his data on entry, exit, and production in the early U.S. auto industry as consistent with the dominant design theory. Our more comprehen-sive data leads us to question that consistency. Moreover, differently from Klepper (1996), our data points to the role played by a single domi-nant firm at the time: Ford. Theories of industry life cycles are only just beginning to consider the roles of single dominant players and the strategic interactions they spark (e.g., De Figueiredo and Silverman, 2007).
It may be useful to consider some examples of firms in our data that faced the Follower’s Dilemma that we analyze. The Arbenz Company is an example of a company that failed to reposition. When the Model T was introduced, Arbenz was producing a single model in the low horsepower segment. Managers attempted to reposition by producing 6- and 8-cylinder automobiles (much higher horsepower engines compared to the Model T), in order to avoid the competition created by Ford (Motor Age, August 1, 1915, v. 18: 152). To do so, it hired an engineer who had worked with those who had developed 8-cylinder engine technology. But other than this single engineer, Arbenz had no prior technical or organizational knowledge for producing larger cars. Arbenz ultimately continued to produce only a 4-cylinder model until it was forced to exit in 1917 (Kimes and Clark, 1989).
Nash Motors provides an example of a success-fully repositioning firm. In 1916, Charles Nash, a former Buick executive, acquired the Thomas B. Jeffrey Company. Jeffrey at the time was producing two successful and innovative models:
the Rambler, which featured an innovative hybrid engine and advanced starter and ventilation system, as well as one of the first successful four-wheel-drive vehicles, the Quad. The Rambler was a 25-hp car selling at a price that was 60–70 percent higher than the Model T, and while initially successful, its sales began to drop after the Model T was introduced. Within two years of acquiring Jeffrey, Nash was able to replace the Rambler with multiple car models in the mid-price range based on an innovative overhead valve engine to which newly recruited Buick engineers had contributed (Norbye, 1981). This example thus illustrates how a firm with a wider technological base (its two diverse models reflected its innova-tive engineers) was able to attract additional inno-vative engineers who helped the firm reposition away from the innovation shock of the Model T.
MODEL ESTIMATION
The database for our study was constructed from a larger database that includes a range of information on auto companies and car components for virtu-ally every auto producer in the U.S. auto industry during the period 1885–1981. From this data, we analyze the crucial period during which the shake-out occurred. The larger database was constructed from a variety of historical sources, especially Baldwin et al. (1987), Georgano (1982), Gunnell (1987), Kimes and Clark (1989), and Flammang and Kowalke (1989). Each of these sources repre-sents the culmination of many years of research by historians, journalists, collectors, and others. The main difference between this database and those analyzed by previous studies of dominant design in the auto industry is that our database includes substantially more firms, especially smaller firms operating between 1905 and 1910.
Our analysis follows the general approach taken by Carrollet al.(1996) and Klepper (2006) in their survival analyses of the U.S. auto industry. We estimate a Gompertz hazard rate model of firm mortality because nonparametric analyses suggest that the Gompertz specification shows superior goodness of fit relative to the Weibull and other specifications. We conduct this analysis at the level of the firm rather than at the level of the car model because our theory is about firms.
Model T up to 1926, at which point its sales were declining substantially. While Ford began production of the Model T late in 1908, as discussed above, Ford was unable to fully meet the unanticipated and dramatic increase in demand until 1911. We therefore identify 1911 as the year in which we expect effects on industry exit from the innovation shock to begin to show in the data. For comparison’s sake, we also evaluate the effects of Ford’s production level from 1909 (because the Model T was introduced only in the last quarter of 1908) and from 1910.
Our first main independent variable is a dummy variable representing the industry segment in which the Model T was introduced. Recall that no other firm posed nearly the kind of competitive threat posed by Ford’s Model T. Therefore, we assume that our dummy variable for LOW SEG-MENT would be picking up the effect of the ISD only. The price data from Lester-Steele (1960) indicates that this was the low-price segment in the industry. Thus, our LOW SEGMENT variable takes the value of 1 if a firm was positioned near the Model T at the low end of the market, and 0 otherwise.
Because our price data is not comprehensive, we identify those firms that participated in the lowest price segment using horsepower data. Our database includes information on the horsepower of the car models sold by each firm in the popu-lation (some firms produced multiple car models in a given year during this period, though most did not). Horsepower was used as the basis for measuring organizational niches in organizational ecology studies using data upon which we draw (e.g., Dobrev, Kim, and Hannan, 2001; Dobrev et al., 2002). Organizational niches are similar to notions of industry segments. Indeed, in the sample of firms on which we have price data, the correla-tion between model price and model horsepower is 0.5 (p<0.04). We identify firms as competing
directly with Ford if they produced a vehicle with a horsepower ≤25 (LOW SEGMENT=1;
other-wise=0). We chose 25 as our cut-off because the
Model T’s horsepower was 20 or 22 (depending on the model year) during our period of interest, and because the distribution of minimum horsepower shows a large, natural break at 25 in our data over the relevant time period. The next natural break in the data comes at a horsepower level of 50. We therefore identify a middle segment between 26 and 50 (MID SEGMENT). Our omitted category
is the high-end segment consisting of cars with horsepower levels greater than 50. Thus, based on Hypothesis 1, we predict a positive and signifi-cant sign for the coefficient on LOW SEGMENT, indicating a significantly greater hazard of exit associated with the arrival of the innovation shock in the low price segment.
We might also expect the competitive effects of the innovation shock to spill over to some degree into the middle segment, although our framework suggests that the effect would be weaker than for the low segment. We might therefore expect a pos-itive but smaller coefficient estimate on the MID SEGMENT variable. We also included control variables from our database that have been shown by Carrollet al. (1996) and Klepper (2006) to be (positively) associated with firm survival in the auto industry, and by others to have similar effects in other industries (e.g., Dunne, Roberts, and Samuelson, 1988): firm age (AGE), log of firm size (LOG SIZE), and pre-entry experience (if entered from a related industry, DEALIO=1;
other-wise=0). These variables are all expected to carry
negative and significant signs. We also included a variable, NUMODEL, which measures the number of car models produced by the firm in the year in question. This variable is meant to capture possible economies of scope that could contribute to sur-vival chances. We added the log of gross national product (LOG GNP) to proxy for macroeconomic conditions that might impact firm exit rates.
Population ecology emphasizes the role of density and density squared in driving exit rates. Including both of these variables in our regres-sions would not be appropriate, however, because we study the population well after the industry’s birth. Population ecology predicts an inverse-U relationship between density and exit rates only in data that begin from population birth (Carroll and Hannan, 2000). The time frame for our study begins only after the very earliest stage of industry development in which, according to population ecology, “legitimacy” was increasing, and instead focuses exclusively on the later “competition for resources” stage. We therefore include a measure of density alone (DENSITY), expecting a positive coefficient estimate on that variable’s coefficient (rather than the negative one found in ecological studies) given our focus on the period of elevated exit rates.
that we expect would affect exit rates. WWI takes the value of 1 for the years 1917–1918, and 0 otherwise. This controls for the period during which the U.S. participated in World War I. DOMINANT DESIGN takes the value of 1 for the years 1923–1926, representing the time frame in which there is agreement that the dominant design emerged. We predict a positive and significant sign on this variable, consistent with the notion that the dominant design did accelerate the increase in exit rates when it finally emerged.
To test Hypothesis 2 to Hypothesis 4, which focus on those firms that remained in the industry but were at risk of repositioning, we construct a subpopulation consisting of data on only those firms that were active in the lowest industry seg-ment between 1906 and 1926 (i.e., did not exit the industry during that period). For those firms that repositioned from the low segment to some other segment during the period, we coded the time at which the repositioning occurred. We conducted a hazard rate analysis on this subpopulation, seeking to predict which firms were more or less likely to reposition out of the low segment (but not leave the industry) after the introduction of the Model T. We again used the Gompertz specification, although our results are robust to Weibull specifi-cation. Because our subpopulation by construction did not exit the industry, we omit DENSITY from our estimation here. Hypothesis 3 predicts a (more) negative and significant coefficient on the AGE variable for the post-innovation shock period compared to the pre-innovation shock period, reflecting organizational inertia. Hypothesis 3
makes a similar prediction with regard to LOG FIRM SIZE. Hypothesis 4 predicts that producers of more car models were more likely to reposition out of the segment after the innovation shock. We therefore expected a (more) positive and significant sign on the coefficient estimate for NUMODEL for the post-innovation shock period compared to the pre-innovation shock period.
EMPIRICAL RESULTS
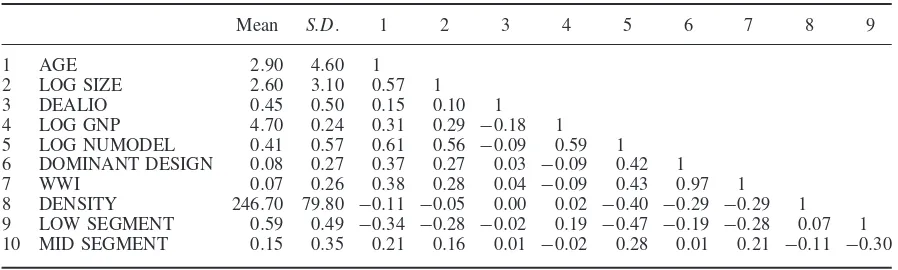
Table 2 contains descriptive statistics and defini-tions of the variables used in the study. We note the high correlations between AGE, SIZE, and NUMODEL. These correlations may tend to inflate the standard errors in our regressions. However, the coefficient estimates for each of these variables carry the expected signs at expected significance levels, suggesting that the underlying relationships we are theorizing about are not being masked by excessive multicollinearity. The variance inflation factors for all covariates are below 3.0.
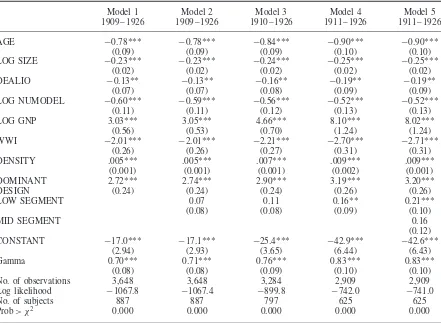
Table 3 shows the coefficient estimates for the regressions aimed at examining our hypotheses. The estimation of Model 1, which covers years 1909–1926, yields expected coefficient estimates. Firm size, age, number of models, and related pre-entry experience all improve the average firm’s survival chances, consistent with prior findings with the various subsets of this dataset (e.g., Argyres and Bigelow, 2007; Carrollet al., 1996), as well as with other auto industry databases (Klepper, 2006). GNP’s positive and significant
Table 2. Variable descriptions, descriptive statistics, and intercorrelations
Mean S.D. 1 2 3 4 5 6 7 8 9
1 AGE 2.90 4.60 1
2 LOG SIZE 2.60 3.10 0.57 1
3 DEALIO 0.45 0.50 0.15 0.10 1
4 LOG GNP 4.70 0.24 0.31 0.29 −0.18 1 5 LOG NUMODEL 0.41 0.57 0.61 0.56 −0.09 0.59 1 6 DOMINANT DESIGN 0.08 0.27 0.37 0.27 0.03 −0.09 0.42 1 7 WWI 0.07 0.26 0.38 0.28 0.04 −0.09 0.43 0.97 1 8 DENSITY 246.70 79.80 −0.11 −0.05 0.00 0.02 −0.40 −0.29 −0.29 1 9 LOW SEGMENT 0.59 0.49 −0.34 −0.28 −0.02 0.19 −0.47 −0.19 −0.28 0.07 1 10 MID SEGMENT 0.15 0.35 0.21 0.16 0.01 −0.02 0.28 0.01 0.21 −0.11 −0.30
Variable descriptions: AGE=firm age in years; LOG SIZE=log of firm size in number of units sold; DEALIO=1 if firm has
pre-entry experience from a related industry, else 0; LOG GNP=log of gross national product; MULTI MODEL=1 if firm produced more than 1 car, else=0; DOMINANT DESIGN=1 for the years 1923 onward, else=0; WWI=1 for the years 1917–1918,
Table 3. Gompertz hazard rate of industry exit models
Model 1 Model 2 Model 3 Model 4 Model 5
1909–1926 1909–1926 1910–1926 1911–1926 1911–1926
AGE −0.78*** −0.78*** −0.84*** −0.90*** −0.90***
(0.09) (0.09) (0.09) (0.10) (0.10)
LOG SIZE −0.23*** −0.23*** −0.24*** −0.25*** −0.25***
(0.02) (0.02) (0.02) (0.02) (0.02)
DEALIO −0.13** −0.13** −0.16** −0.19** −0.19**
(0.07) (0.07) (0.08) (0.09) (0.09)
LOG NUMODEL −0.60*** −0.59*** −0.56*** −0.52*** −0.52***
(0.11) (0.11) (0.12) (0.13) (0.13)
LOG GNP 3.03*** 3.05*** 4.66*** 8.10*** 8.02***
(0.56) (0.53) (0.70) (1.24) (1.24)
WWI −2.01*** −2.01*** −2.21*** −2.70*** −2.71***
(0.26) (0.26) (0.27) (0.31) (0.31)
DENSITY .005*** .005*** .007*** .009*** .009***
(0.001) (0.001) (0.001) (0.002) (0.001)
DOMINANT 2.72*** 2.74*** 2.90*** 3.19*** 3.20***
DESIGN (0.24) (0.24) (0.24) (0.26) (0.26)
LOW SEGMENT 0.07 0.11 0.16** 0.21***
(0.08) (0.08) (0.09) (0.10)
MID SEGMENT 0.16
(0.12)
CONSTANT −17.0*** −17.1*** −25.4*** −42.9*** −42.6***
(2.94) (2.93) (3.65) (6.44) (6.43)
Gamma 0.70*** 0.71*** 0.76*** 0.83*** 0.83***
(0.08) (0.08) (0.09) (0.10) (0.10)
No. of observations 3,648 3,648 3,284 2,909 2,909
Log likelihood −1067.8 −1067.4 −899.8 −742.0 −741.0
No. of subjects 887 887 797 625 625
Prob> χ2 0.000 0.000 0.000 0.000 0.000
Standard errors are in parentheses.
***p<0.01; **p<0.05; *p<0.1; one-tailed test.
effect likely reflects auto supply outstripping demand as the economy grew over the period as a whole. Models 2 and 3 include LOW SEGMENT, with Model 2 estimated on data starting in 1909, and Model 3 beginning in 1910. The coefficient estimate on LOW SEGMENT is positive but nonsignificant in these two models, providing no support for Hypothesis 1. However, as explained above, Ford was not able to fully meet demand for the Model T until 1911. Models 4 and 5 restrict the estimation to 1911, and in those regressions, the coefficient estimate on LOW SEGMENT becomes positive and statistically significant, thus we cannot reject Hypothesis 1. The lag between the introduction of the Model T and its impact on exit likely resulted from constraints on Ford’s production and distribution capacity in the first couple of years after introducing the Model T.
Model 5 adds the variable MID SEGMENT, whose coefficient estimate is positive but not
statistically significant. This indicates that the competitive effects from the innovation shock did not spill over into the middle segment significantly more than they spilled over into the high-end segment (the omitted category). However, the estimate is consistent with our assumption that the middle segment (as well as the high segment) to which many firms fled after the innovation shock was introduced did in fact offer more defensible positioning, likely because of the numerous types of differentiated positions distant from the Model T that could be established in the segment (Argyres and Bigelow, 2010).
that the coefficient for DD is much larger than the coefficient for LOW SEGMENT. The smaller coefficient on LOW SEGMENT suggests that it was the innovation shock thatinitiatedthe industry shakeout, even if the emergence of the dominant design later had a large effect. As we argue above, an innovation shock can set off a set of industry dynamics that can lead to the later emergence of a dominant design, so the two variables do not represent rival theories of shakeouts, but rather are part of the same dynamic. The innovation shock is key to understanding the dynamic in full.
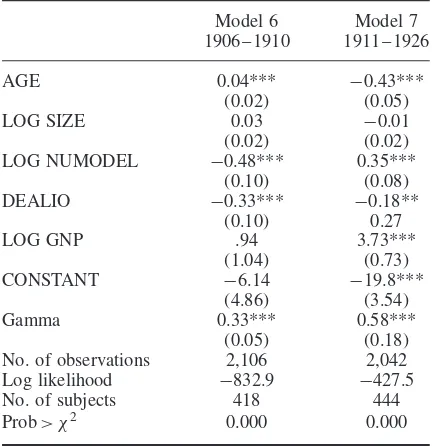
Table 4 provides regression results on data that include the subpopulation of low segment firms only. The regressions examine the likelihood of low segment firms repositioning to other segments, while remaining in the industry until at least 1926. Model 6 is limited to the pre-innovation shock period of 1906–1910, while Model 7 examines the post-innovation shock period. We omit DENSITY, DOMINANT DESIGN, and WWI from the regres-sions for ease of comparison with Models 4 and 5, and because we have no reason to suggest that these covariates should influence segment repo-sitioning (as opposed to industry exit). Because strategic repositioning is not discussed in popula-tion ecology, that literature provides no theoretical or empirical precedence for including industry or segment density in our regression on reposition-ing. In unreported regression models that included these three omitted covariates, we found that the signs, magnitudes, and statistical significance of our main variables are essentially the same as those found in Models 6 and 7.
The coefficient estimate on AGE in Model 6 is positive and significant, while it is negative and significant in Model 7. This implies that older firms were significantly less likely to exit the low segment after the innovation shock occurred there, consistent with Hypothesis 2. The positive and significant coefficient on AGE in Model 6 likely reflects the fact that, early in the industry’s history, organizational inertia was not a major factor limiting repositioning, because firms were not yet old enough to have developed significant such inertia. The coefficient estimate on LOG FIRM SIZE is negative in Model 7, as predicted, but is not statistically significant. Thus, no evidence is found in support of Hypothesis 3.
Finally, the coefficient for NUMODEL is pos-itive and significant in Model 7, while negative in Model 6, providing support for Hypothesis 4.
Table 4. Gompertz hazard rate of segment repositioning models
Model 6 Model 7
1906–1910 1911–1926
AGE 0.04*** −0.43***
(0.02) (0.05)
LOG SIZE 0.03 −0.01
(0.02) (0.02)
LOG NUMODEL −0.48*** 0.35***
(0.10) (0.08)
DEALIO −0.33*** −0.18**
(0.10) 0.27
LOG GNP .94 3.73***
(1.04) (0.73)
CONSTANT −6.14 −19.8***
(4.86) (3.54)
Gamma 0.33*** 0.58***
(0.05) (0.18)
No. of observations 2,106 2,042
Log likelihood −832.9 −427.5
No. of subjects 418 444
Prob> χ2 0.000 0.000
Standard errors are in parentheses.
***p<0.01; **p<0.05; *p<0.1; one-tailed test.
This implies that firms producing a larger number of models, reflecting a broader technological base, were more likely to reposition away from the low end segment after the innovation shock arrived. Thus, while the positive and significant coefficient estimate on NUMODEL in Model 6 suggests that firms with a broader technology base were more likely to establish themselves in the low-end seg-ment prior to the shock, the Model 7 result implies that they were also better able to reposition away from that segment after the shock.
DISCUSSION AND CONCLUSION
industry dynamics from which the dominant design, only later, emerges.
We also argue that an innovation shock cre-ates a Follower’s Dilemma that launches a series of responses by rivals and potential competitors. Empirical analysis provides preliminary support for our hypotheses that an innovation shock stim-ulates exit from the industry, and especially exit from the industry segment in which the shock occurs. It also suggests that comparative adjust-ment costs play an important role in determining which firms reposition in response to an innovation shock.
From a strategic management perspective, our theory offers an advance over the dominant design literature by highlighting a vital role of strategic choice. In particular, when faced with an inno-vation shock, managers have the responsibility to explore and identify alternative strategies for exit, entry, or repositioning, and estimate the attendant comparative adjustment costs for each alterative considered. Although not elaborated in this paper, managers also are responsible for leading and implementing these strategies, thereby coping with inertia and managing adjustment costs. In contrast, the dominant design literature offers only a limited role for managers or for strategic management.
Our hypotheses and empirical analyses are appropriately characterized as exploratory. Our primary focus in this paper is to introduce and begin to develop a new and potentially impactful concept. The empirical portion of the paper focuses on the industry exemplar with reference to which much of the dominant design literature developed—U.S. automobiles. This industry is therefore particularly appropriate for exploring the concept of innovation shocks and for evaluating its contribution over and above that of the concept of dominant design.
We suggest that future research build on the innovation shock design concept. For example, it is important to identify the key characteristics of innovation shock designs, and to understand the conditions under which they become or do not become dominant designs. Anecdotal obser-vation suggests that there is variance on both of these counts across innovation shocks, indicating opportunities for further theoretical development. In addition, future conceptual work could seek to provide a theoretical foundation for the emergence of Porter’s (1980) typology of strategies: low cost, differentiation, and focus. We suspect that the
typologies often emerge because of a Follower’s Dilemma. Developing this theoretical antecedent would provide a more integrated and cumulative theoretical perspective for the positioning school in strategic management. In addition, a broad research in strategy focuses on entry, exit, and repositioning decisions (including mergers and acquisitions), but a review of this literature suggests to us that rarely are the antecedents of these strategic moves in terms of industry evolution identified and integrated into the theo-retical explanation of the decisions. We therefore posit that building a theory to connect innovation shocks with these other decisions may provide the foundation for a more integrative theoretical framing of a wide variety of strategic decisions.
Finally, we believe there is much value to be added to the strategic management literature— especially to notions of dynamic capabilities—by developing a more thorough and comprehensive theory of comparative adjustment costs. Doing so may enable the prediction of best responses whether they involve exit, entry, or repositioning, which not only may be of value for advancing understanding of competitive dynamics but also prove valuable for managers attempting to strategically manage their organizations.
ACKNOWLEDGEMENTS
We thank the co-editor, Will Mitchell, and two reviewers for helpful comments. For valuable feedback we also thank audiences at, and reviewers for, the Academy of Management Meetings and Strategic Management Society Conference, as well as participants in the strategy seminars at the following universities: University of Toronto, University of Western Ontario, University of Carlos III Madrid, and INSEAD.
REFERENCES
Abernathy WJ. 1978.The Productivity Dilemma: Road-block to Innovation in the Automobile Industry. Johns Hopkins University Press: Baltimore, MD.
Abernathy WJ, Utterback J. 1978. Patterns of industrial innovation.Technology Review 80(7): 40–47. Amburgey T, Kelly D, Barnett W. 1993. Resetting
the clock: the dynamics of organizational change and failure. Administrative Science Quarterly 38(1): 51–73.
Anderson P, Tushman M. 1990. Technological discon-tinuities and dominant design: a cyclical model of technology change.Administrative Science Quarterly
35(4): 604–633.
Argyres N, Bigelow L. 2007. Does transaction misalign-ment matter for firm survival across all stages of the industry lifecycle? Management Science 53(8): 1332–1345.
Argyres N, Bigelow L. 2010. Innovation, modularity and vertical de-integration: evidence from the early U.S. auto industry.Organization Science21(4): 842–853. Argyres N, Liebeskind J. 1999. Contractual
commit-ments, bargaining power and governance inseparabil-ity: incorporating history into transaction cost theory.
Academy of Management Review24(1): 49–63. Baldwin N, Georgano GN, Sedgewick M, Laban B. 1987.
The World Guide to Automobile Manufacturers. Facts on File: New York.
Barnett W. 2008.The Red Queen Among Organizations: How Competitiveness Evolves. Princeton University Press: Princeton, NJ.
Barnett W, Freeman J. 2001. Too much of a good thing? Product proliferation and organizational failure.
Organization Science21(5): 539–558.
Barney J. 1986. Strategic factor markets: expectations, luck and business strategy. Management Science
32(10): 1231–2144.
Bigelow L, Argyres N. 2008. Transaction costs, industry experience and make-or-buy decisions in population of early U.S. auto firms.Journal of Economic Behavior & Organization66(3–4): 791–807.
Burns T, Stalker G. 1961.The Management of Innovation. Tavistock: London, UK.
Carroll G. 1985. Concentration and specializa-tion: dynamics of niche width in populations of
organizations. American Journal of Sociology 90(6): 1262–1283.
Carroll G, Bigelow L, Seidel M-D, Tsai L. 1996. The fates of de novo and de alio producers in the American automobile industry 1885–1981. Strategic Management Journal, (Summer) Special Issue 17: 117–137.
Carroll G, Hannan M. 1995. Organizations in Industry: Strategy, Structure and Selection. Oxford University Press: New York.
Carroll G, Hannan M. 2000.The Organizational Demog-raphy of Corporations and Industries. Princeton Uni-versity Press: Princeton, NJ.
Caves R, Crookell H, Killing JP. 1983. The imperfect market for technology licenses. Oxford Bulletin of Economics and Statistics 45(3): 259–267.
Chandler A. 1990. Scale and Scope: The Dynamics of Industrial Capitalism. Belknap Press: Cambridge, MA.
Christensen C, Suarez F, Utterback J. 1998. Strategies for survival in fast-changing industries. Management Science 44(12): S207–S220.
De Figueiredo J, Silverman B. 2007. Churn, baby, churn: strategic dynamics among dominant and fringe firms in a segmented industry. Management Science 53: 632–650.
Dierickx I, Cool K. 1989. Asset stock accumulation and sustainability of competitive advantage. Management Science 35(4): 1504–1513.
Dinlersoz E, MacDonald G. 2009. The life-cycle of the size distribution of firms. Review of Economic Dynamics 12(4): 648–667.
Dobrev S, Carroll G. 2003. Size (and competition) among organizations: modeling scale-based selection among automobile producers in four major countries: 1885–1981. Strategic Management Journal 24(6): 541–559.
Dobrev S, Kim T-Y. 2006. Positioning among organiza-tions in a population: moves between market segments and industry structure. Administrative Science Quar-terly 51(5): 230–261.
Dobrev S, Kim T-Y, Carroll G. 2002. The evolution of organizational niches: U.S. automobile manufacturers, 1885–1981. Administrative Science Quarterly 47(2): 233–264.
Dobrev S, Kim T-Y, Carroll G. 2003. Shifting gears, shifting niches: organizational inertia and change in the evolution of the U.S. automobile industry, 1885–1981.Organization Science14(3): 264–282. Dobrev S, Kim T-Y, Hannan M. 2001. Dynamics of niche
width and resource partitioning. American Journal of Sociology 106: 1299–1337.
Dowell G, Swaminathan A. 2000. Racing and back-pedalling into the future: new product introduction and organizational mortality in the U.S. bicycle industry, 1880–1918.Organizational Studies 21(2): 405–431. Dunne T, Roberts M, Samuelson L. 1988. Patterns of
entry and exit in U.S. manufacturing industries.RAND Journal of Economics 19(4): 495–515.