Application of Radon Isotopes to Determine Permeable Zones in
Rajabasa Geothermal Field, Indonesia
Nandi Haerudin
1,2,a*, Wahyudi
1,b, Dikdik Risdianto
3,cand Wiwit Suryanto
1,d1Department of Physics, Faculty of Mathematics and Natural Sciences, Gadjah Mada University,
Sekip Utara No. 1,Yogyakarta 55281, Indonesia
2Department of Geophysics Engineering, Faculty of Engineering, Lampung University,
Jl. Sumantri Brojonegoro No. 1, Bandar Lampung 35145, Indonesia
3Center of Geological Resource, Geology Agency of Indonesia, Jl Soekarno Hatta no 444,
Bandung 40254, Indonesia
a[email protected], b[email protected], c[email protected], d[email protected]
Keywords: fault zones, radon, thoron, permeable zones, conductive zones
Abstract. This study aims to determine permeable zones (i.e. fault or fracture zones) in the Rajabasa geothermal field using radon isotopes. Radon concentration of soil gas was measured by Scintrex Radon detector RDA 200 consisting of 123 measurement station. The measurement site spacing was between 200 m and 350 m. The radon concentration was classified based on a statistical approach, i.e. low, high and very high. Very high value of radon concentration, called radon anomaly, associated with permeable zones. From the radon anomaly contour map, a 2D Radon migration from the source to the surface was modelled by means of numerical simulation. Finally, the radon contour map was overlaid with the surface geological map and the resistivity contour map in the area of study. It suggests that the radon anomaly correlates with the location of permeable zone in the centre part of the study area i.e. mud pool manifestation at the Kunjir and the Cugung (Bulakan) fumarole. Based on numerical simulation, the width of the fault is 2,800 m; velocity of fluid is 0.08 m/s and the Radon concentration is 860,000 Beq/m3. The resistivity contour
map results in low resistivity of 0 to 100 Ωm indicating the conductive zone coincide with permeable zones based on radon measurements. Furthermore, the peak of the profile curve of Radon concentration could be an indication of fault systems in this area.
Introduction
Measurements of radioactivity Radon were used in the exploration of geothermal areas adopted from mineral exploration techniques. The anomalous Radon concentrations can be observed in the active fault zone because it provides a conduit for upward migration. The radon method is usually
used in geothermal exploration as geochemical tools. Radon measurements are usually performed in conjunction with measurement of gases such as CO2, CH4 and Hg. [1-5]. In this study, the radon method was used as geophysical tools. It will be made the 2D modeling of Radon migration. Its
contour map will overlay with the apparent resistivity map, which were resulted from DC resistivity method. The resistivity method is one of a geophysical method which is superior in geothermal prospecting. Previously, as a geophysical tool, Radon method is used for mineral exploration and earthquake precursors [6].
This paper aims to describe how to determine the permeable zones (i.e. fault or fracture zones) at Rajabasa geothermal field using information from radon isotopes. Geophysical methods that are applied to the geothermal areas are difficult to determine the fault exactly because of ambiguity in the interpretation. Radon method used as a geophysics tool in geothermal areas is expected to provide a solution to map the fracture zones and faults, especially buried faults under the surface.
The study area was focused on the Pematang Belirang prospect area, which was the main geothermal prospect, located in the southern part of the Rajabasa Volcano. Rajabasa geothermal is a stratovolcano type, where the system is associated with Quaternary volcanic activity and magma intrusion (young igneous systems).
Method
The survey area covers 25 km2 consisting of 123 measurement stations with site spacing between
200m and 350 m. Dry and not altered soil is chosen for measurement station. Some stations were shifted due to watery areas, ravine or hard rock which cannot be penetrated by the probe device.
Radon concentrations in soil gas were measured by Radon detector (i.e. RDA-200, Scintrex).
The probe is inserted to ground until 70 cm depth to avoid atmospheric influence and it will be channelled for soil gas from ground to the device by suction. Soil gas was circulated through the detector manually with hand pump, replacing the air in the detection cell. A probe was connected with a rubber hose to a filtration flask in order to avoid any water entrance to the detector. After the flask, the soil gas passed throughout a desiccant tube. Before the counting process started the hole was clogged with the ground or organic matter to avoid soil gas to be mixed up with atmospheric air.Radon concentrations were measured by an alpha-scintillation radon counter into a scintillation chamber. Alpha-particles that were produced during the radon decay hit the ZnS(Ag) layer in the scintillation counter. The amount of alpha particles was then measured by a photo-multiplier and a counter. Concentrations of Radon were calculated three times every 2 minutes by alpha emission.
To characterize the spatial distribution of Radon in the study area, contour maps were produced using the krigging interpolation based on a linear variogram algorithm. In the permeable zone, Radon rapidly migrates to the surface before disintegrating into daughter products. The radon will turn into the steam phase and moves to higher elevations through permeable zones. The degree of rock fractures and the ability of the groundwater flowing through permeable rocks associated with radon releasing. The high value of Rn/Tn concentration ratio is an indicator to detect the existence of fractures or fault systems connecting of the deep zone to the surface. Thoron has a short half-life, 55 s, its concentration decreases quickly during 2 min of sequential measurement. In the contrary, Rn has a half-life of 3.8 days and can be transported in fractures for long distance.
The Radon concentration (C) was classified into three categories, i.e. low, high, and very high based on a statistical approach. They were calculated using the geometric mean plus one standard deviation [7]. The geometric mean (г) was read at the 50th percentile; and the standard deviation (σ) representing the spread in the data. Low value of Radon concentration considers as background, whereas a very high value as Radon anomaly [5].
The peak of the radon concentration contour was used to delineate permeable zones. Then the cross section through the permeable zone was made. The profile of Radon concentration was fitted by the numerical 2D forward modeling. In this case, the assumptions is that the fluid is incompressible, where the migration way is only in vertical coordinates and the overburden rock is homogenous [8]. Finally, the Radon contour map was overlaid with the apparent resistivity contour map to determine the conductive zone that was associated with the zone containing geothermal fluids. The permeable zones containing fluids are the prospect area and it is targeted location for geothermal exploitation by drilling. The apparent resistivity contour map is secondary data that measured by DC resistivity method.
Results and Discussion
The results of this Radon (Rn) measurements are from 311 Beq/m3 to 17750 Beq/m3 and Thoron
(Tn) values are from 0 Beq/m3 to 8133 Beq/m3. Distribution of Radon and Thoron classification
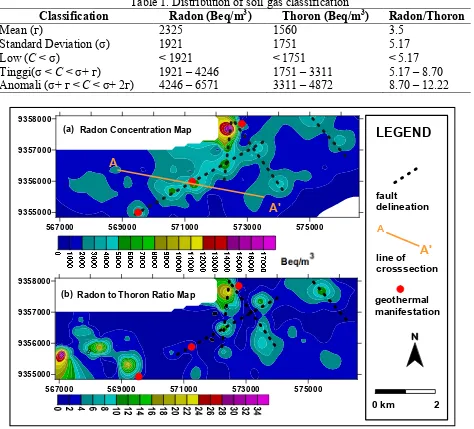
Table 1. Distribution of soil gas classification
Classification Radon (Beq/m3) Thoron (Beq/m3) Radon/Thoron
Mean (г) 2325 1560 3.5
Fig 1. Contour map of (a) Radon concentration and (b) Rn/Tn concentration
The measured profile along the 100º azimuth through the Kunjir mud pool showed in Fig 1(a). A wedge of profile AA’ is formed by a line connected to the points of measurement. First the prominent peaks and background from the original curve are defined. The fracture zone can be identified by a multiple peak anomaly consisting of several single peaks. When the fracture zone anomaly consists of three peaks, then the model was constructed by the fitting model used the 2D forward modelling. The result showed in Fig 2. The parameters chosen for forward modelling were: depth of the conduit radon migration is 2,800 m, velocity is 0.08 m/s and the radon concentration is 860,000 Beq/m3.
(a) (b)
Fig 2. Radon concentration distribution above a geothermal fracture zone; (a) the 2D migration model of radon concentration under surface of a sliced line AA’ from Fig 1(a) and (b) Radon
concentration curve of profile AA’ at 70 cm depth.
0 100 200 300 400 500 600 700 800 900 1000 1100 1200
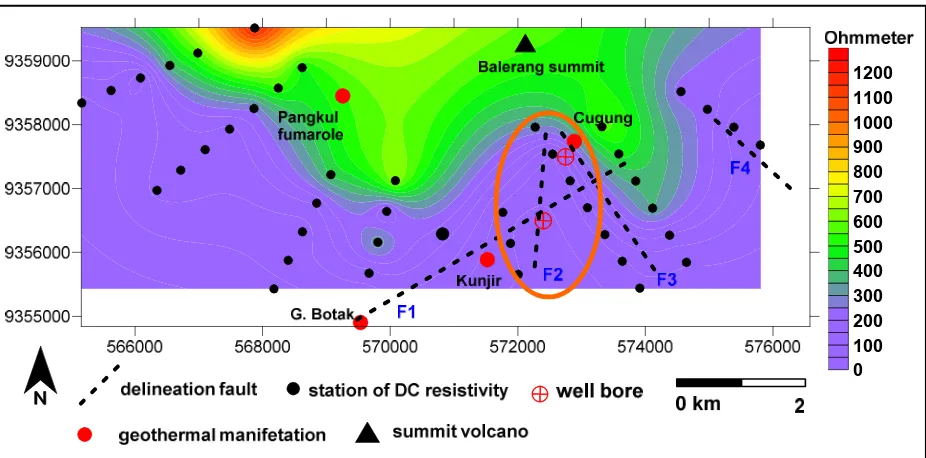
Fig. 3. The apparent resistivity contour map at 250 m depth (Orange circle indicated a conductive zone that coincide with delineated fault zone)
The apparent resistivity contour map in Fig. 3 shows low resistivity values 0 to 100 Ωm (purple color). This indicates a conductive zone, lied coincide with delineated fault zones based on Radon measurements, located in the southeast of study area (orange circle). The result of two shallows well bore located in this area, noted alteration rock begin at 200 m depth. This suggests that there is a fracture zone containing geothermal fluid as a target for drilling or geothermal exploitation located between the Kunjir mud pool and the Cugung fumarole.
Conclusion
F2. It is located in the southeast of the study area between the Kunjir mud pool and the Cugung fumarole.
Acknowledgement
The authors would like to thank Prof. Suprajitno Munadi from LEMIGAS for supporting this research and Ferry Faizal for supporting in making the code of numerical, and also to thanks to Geological Agency of Indonesia for allowing to use resistivity data.
References
[1] A. Lopez, L. Gutierrez, A. Razo, and M. Balcazar, Nuclear Instruments and Methods in Physics Research 255 (1987) 426-429.
[2] A. Rodriguez, Y. Torres, L. Chavarria, and F. Molina, Geothermal Training Proggrame 30th AnniversaryWorkshop Orkustofnun, Grensasvegur 9, Iceland (2008).
[3] C. Karingithi and J. Wambugu, The Geochemistry of Arus and Bogoria Geothermal Prospect,. Proceeding World Geothermal Congress 2010 Bali, Indonesia (2010).
[4] M. Balcázar, A. López, Martínez, M. Huerta, J. H. Flores, Ruíz and P. Peña, “Use of Environmental Radioactive Isotopes in Geothermal Prospecting” in The 17th Pacific Basin Nuclear Conference, Instituto Nacional de Investigaciones Nucleares, Mexico (2011).
[5] N. K. Phuong, A. Harijoko, R. Itoi and Y. Unoki, Journal of Volcanology and Geothermal Research 229–230 (2012) 23-33.
[6] Walia V., Yang T.Y., Hong W.L., Lin S.J., Fu C. C., Wen K.L., Chen C.H., Geochemical variation of soil–gas composition for fault trace and earthquake precursory studies along the Hsincheng fault in NW Taiwan, Applied Radiation and Isotopes 67 (2009) 1855–1863.
[7] R.W. Klusman, Gas and Related Methods for Natural Resource Exploration, England: John Wiley & Son Ltd, 1993.
[8] A. Abdoh and M. Pilkington, Radon Emanation Studies of The Ile Bizard Fault, Montreal,
Geoexploration vol. 25(4) (1989) 341 – 354.
[9] N. Haerudin, Wahyudi and W., Suryanto, Analysis of The 3D Geothermal Reservoir Model