Measuring Village Unit Cooperative Performance
Using Stepwise Discriminant Analysis (A Case of
West Lombok Region)
I Gusti Lanang Parta Tanaya
Department of Agricultural Socio Economics – The University of Mataram
Abstract
Realizing that most Indonesian live in rural areas and use rural business activities as main source income, most of governmental policy released to promote all small business in this area including agriculture. Refers to the national constitution (UUD 1945), cooperative is considered the most suitable business form that can accommodate people interest. In 1978 under presidential instruction most of village unit cooperatives or Koperasi Unit Desa (KUD) were established throughout the nation. However, this business organization is far left behind compared to private owned business and state owned business. Despite, some methods were introduced to evaluate the growth and performance of KUD, until reformation era the situation of this business is still unchanged. This paper tried to use a stepwise discriminant analysis to measure the KUD performance in West Lombok. Financial, organizational, and operational data were collected to support this analysis. Geometric index was applied to identify the performance of KUD. Selected variables were identified to classify individual cooperatives into bad or good performance groups with stepwise discriminant analysis. It is found that the length years of manager run KUD’s business and participation of member doing business with KUD were the two variables that contribute the most significant influence on KUD performance.
Keywords: Rural business, Village Unit Cooperatives, Discriminant Analysis
Abstrak
financial, organisasional dan operasional dikumpulkan untuk mendukung analisis ini. Indeks Geometri juga digunakan untuk menghitung kinerja KUD. Dengan menerapkan Analysis Diskriminan Berjenjang variable-variabel terpilih digunakan untuk menggolongkan KUD yang kinerjanya baik dan buruk. Ditemukan bahwa lamanya manager mengelola KUD dan partisipasi anggota dalam usaha KUD adalah dua variabel yang mempengaruhi kinerja KUD paling signifikan.
Kata kunci: Bisnis pedesaan, koperasi unit desa, analysis diskriminan
Introduction
Indonesia is currently described as developing country in which about 71 percent of its population lives in rural areas and dependence on agricultural sector as main source of income (Word Bank, 2005). Rural poverty is a main issue not only in Indonesia but also in most developing countries.
The development of KUD in rural area of this nation is aims to improve the economic disparity between urban and rural areas. Theoretically KUD can increase the villagers welfare because it works with the business that closely related to the member’s daily activities like rural banking, purchasing farm product and supplying farm inputs. Even, nowadays the KUD business is expand to collaboration with public owned enterprise like Nation Power Company or Perusahaan Listrik Negara (PLN) and Indonesian Telecommunication Company. The role of KUD in this collaboration is to serve rural people to pay power and telephone bill. Under this system, the KUD is expected to be a backbone of rural economic in future.
In West Lombok Region (The District of West Lombok and Mataram Municipality), there has been an increase in the number of cooperatives starting up business during the past 10 years but no increase of the number of KUD. This is because the regulation restriction to established new KUD. Most of these KUDs are marketing associations which were established to meet the needs of members who had outgrown their local markets. KUDs have played a major role in West Lombok economic development for well over 25 years. This region could be freedom from famine due to the hard effort of KUD to introduce modern farm input like fertilizers, certified seed and pesticides to the rural people within the first five year establishment. Moreover, the guarantee of farm product marketing by the KUD could not be said as a minor contribution.
people like Santoso (1993), Tanaya (1997), Sutrisno (2000), Saleh (2004) tried to find out the best method to asses the performance of KUD both partially (financial or organizational) and holistically. Again the situation of this kind of business organization is remain unchanged.
Based on the discussion above, this paper tried to introduce a new approach to identify significant factors of the classification of the KUD in West Lombok Region using Stepwise Discriminant Analysis on the basis of holistic KUD performance. The objectives of this study are to (1) develop a methodology to evaluate the influence of selected variables on KUD performance and (2) to identify factors which are significantly associated holistic performance of KUD.
Methodology
Object and Location of Study
The KUD involved for the study were all KUD in the West Lombok Region. It is easy to identified the KUDs because the reasonable data about this is well available in Department of Cooperative and Small-Medium Enterprise (DCSME) of NTB. Each of the KUDs which began operations within the past 25 years was still operating at the time of the study. This means that this study use a census system to select the object research.
Data Collection and Variable Measured
All data used in this study is from the attachment of annual meeting documents in 2006. Financial reports including annual operating statements and balance sheets were provided in the annual meeting documents. Due to the KUD always directed by the governmental institution, the DCSME, the form of its financial report is relatively same. The financial performance is shown by liquidity (current ratio, quick ratio and cash ratio), leverage (liability ratio, ratio profit to interest paid, ratio total liability to equity, ratio long-term liability to equity), activity (turnover of equity, turnover of operational assets, turnover of total assets), and profitability (gross profit, net profit, return on assets and return on equity). The organizational performance is indicated by
the proportion of representative attend annual meeting, proportion of KUD’s
personnel attend business meeting, proportion of members lend money from the KUD and frequency of auditor board (Badan Pemeriksa) audits the manager. The holistic performance of every KUD is presented in Geometric Mean from all variables in financial and organizational performance.
8
PKUD = ROE×ROA×GPM×NPM×TOA×TTA×PMAPM×PMAAM
ROA Return on Asset GPM Gross Profit Margin NPM Net Profit Margin
TOA Turnover of Operating Asset TTA Turnover of Total Asset
PMAPM Proportion of Member Attending Personnel Meeting PMAAM Proportion of Member Attending Annual Meeting
A major consideration for this study was the availability of data. Financial report and general annual meeting report were the most readily available and comparable information which could be consistently collected. Cooperative managers most often use the financial ratio as a measure of cooperative performance (French et al.). The value of cooperative performance is then divided into two categories: good and bad performance based on the average value of P. Those cooperatives which have value over the average were categorized as good performance cooperative and vise versa.
Discriminant analysis was then used to determine which variables best classified an individual cooperative as a good performance or bad performance cooperative. The combination of variables which provide the best fit for the model of cooperative classification is the final result of the analysis.
Selecting Variables for Discriminant Analysis
Twenty one factors were identified that were thought to influence the nature and extent of financial success for a cooperative. These factors had to be quantifiable. The group of factors were divided into two sets. One set contained the discrete variables, and the second set was comprised of continuous variables. The discrete variables were as follows:
WRKPLN Type of working (operational) plan (1 = yearly and 0 = otherwise) REQCON Requirement of member production con tract (1 = required and 0
= otherwise)
ADSPRD Whether cooperative advertise products (1 = it does and 0 = otherwise)
DLVPRD Whether cooperative delivery products to market (1 = yes and 0 = no)
GDRPRD Whether cooperative grade the products (1 = yes and 0 = no) RCHSGL Has cooperative reach the sales goals (1 = yes and 0 = no) COLOCO Whether cooperative collaborate with other cooperatives (1 = yes
and 0 = no)
MANTYP Whether cooperative manager full-time worker (1 = yes and 0 = no)
LOTPLN Whether cooperative have a long term (5 year) plan (1 = yes and 0 = no)
The following variables comprise the continuous group. FEEDUE The amount of member fee dues
MEMSAV The value of individual member money save in KUD PDYSLS Percentage of total sales from rice procurement program OTHSLS Percentage of total sales from other than rice procurement CRDSLS Percentage of total sales from the activity of Banking
FINSLS Percentage of total sales from subsidized farm input supplying WSDSLS Percentage of total sales from retailer outlet (Waserda) PLNSLS Percentage of total sales from collaboration with PLN MEMGRT Average annual percent growth of members
KUDAGE Number of years KUD formally doing business EXPMNG Number of years of manager experience in the KUD
Preliminary statistical tests were performed on each variable to select those which would be the most useful for the discriminant analysis. The discrete variables were tested by constructing contingency tables for each variable comparing good performance and bad performance groups. The chi-square test statistic was used as a test statistic at the a = 0.05 confidence level to test for goodness-of-fit.
Group means for the continuous variables were compared by using the t-test statistic for the two growth groups. Significant differences in group means for variables were noted at the a = 0.05 confidence level.
Those variables which showed a significant relation to cooperative growth were selected for use in the Stepwise Discriminant Analysis.
Data Analysis
The selected variables were then tested using the stepwise discriminant analysis. Discriminant analysis theory has evolved from Caccuolus (1973) and Tu and Han (1982). Model of Discriminant Analysis developed for this study is discussed below.
Discriminant Analysis is a statistical technique used to distinguish between two or more groups using characteristics on which the groups are expected to differ (Manly, 1994). Groups are forced to be as statistically different as possible by forming a weighted linear combination of the discriminating variables (Santoso, 2004). The weights are estimated so that they result in the ‘best’ separation between the groups. A linear discriminant function can be represented as:
i 1 i1 2 i2 p ip
D =
Z +
Z + ... +
Z
where;
Zip are the standardised values of the p discriminating variables.
The standardised weighting coefficients (βp) reflect the relative importance of each discriminating variable (Zip). Variables with relatively
larger βp contribute more to the discrimination of groups. Two statistics are commonly used to gauge the importance of a discriminant function. The first is
Wilks’ Lambda, an inverse measure of the function’s discriminating power; the
smaller the value of Wilks’ Lambda the better the discriminating power of the function. The second is the correct classification rate. This shows how well the discriminant model predicts the actual group membership of the original observations. For a three-group study like this, only two discriminant functions can be extracted - with the first function accounting for the largest proportion of the differences among the three groups.
Stepwise Discriminant Analysis is usually used to identify specific variables that can be determined group of object. The criteria is used to determine the characteristics to specify the group at first step uses the value of F calculated and the smallest Wilk Lambda (). Mathematically these two parameters can be expressed as follows:
SSB × (k-n)
F =
SSW × (k-1)
SSW
Φ =
SSW + SSB
Where:
SSB is some square between the group SSW is some square within the group k is number of group
n is number of object
Next step is selected the characteristic variables from all variables which are not selected in step one. The step of selection variables will be stop once the F calculation is less than one. The formula for F calculation for the step two and the rest is as follows:
p+1 p
p+1 p
(n-k-p) [1-(
Φ /Φ )]
F =
(k-1) (
Φ /Φ )
Where:
P is the number of variables
Φp+1 is the value of Wilks Lambda for the following step
To decide whether the Discriminant Function is reliable or not, it is used the V-Bartlett test under Chi-square distribution with degree of freedom p(k-1). The V value of V-Bartlett test is formulized as follows:
V = [n-1-(p+2)/2] ln(1+
α)
If the value of V is more than the Chi-square means the function is significant and reliable, and vice versa.
Hypotheses to Be Tested
Each variable was tested for its contribution as a classification variable. The null hypothesis was formulated such that the variable did not improve the classification KUD. Afifi and Clark (1984) describe the test this way: "Equivalent null hypotheses are that the population means for each variable are identical, or that the population D2[squared difference between the means of the standardized values of Z] is zero."
One can then determine whether each variable improves the discrimination by testing if there is a significant increase in D2as each variable enters the analysis. The null hypothesis is that the two population D2values are identical.
The variables used in computing the classification functions are chosen in a stepwise manner as discussed in previous section. There is always the possibility of making an incorrect placement of a KUD into the wrong performance group when using the selected variables to classify KUDs as bad or good performance. Verification of KUD assignment can be performed by calculating the posterior probability of the individual cooperative falling into the assigned group.
The posterior probability expresses the probability of a given KUD belonging to a particular group using the values for the selected variables from the Discriminant Analysis. Posterior probabilities can also be used to interpret the classification results. A high probability favoring classification into one group over the other can be used to verify a KUD's classification into one of the groups. Judgment might be withheld on KUDs with probabilities close to 0.5, the chance probability for falling into either of the two groups.
Result and Discussion
Based on data availability all KUDs could be analysed for their performance value. five of the sample KUDs were classified in the bad performance group and 10 were classified in the good performance group.
Only three of the 21 variables suggested have potential for distinguishing between good and bad performance of KUDs. These variables were LOTPLN (the KUDs have long-term plan), MEMPRT (member participation in cooperative) from the set of discrete variables, and EXPMNG (Number of years of manager experience in the KUD) from the continuous group. Therefore, only these three variables were used in the discriminant function.
The existence and application of a KUD long-term planning document appeared to be associated with the more successful KUDs based on the value of it Geometric index. The greater the extent to which the members participated in and supported their KUD, and the more years of experience the manager working in KUD, the more likely would a KUDs have the value of PKUD over the average.
It would appear that many of the other variables would have been just as useful in distinguishing between good and bad performance. But upon reflection of the data, their inability to do so may have been caused by the relatively accuracy of available data. Their short span of operation may have prevented any strong associations between the variables and the KUD’s performance from being sufficiently established to be measured by statistical analysis.
Stepwise Discriminant Analysis
Discriminant analysis was used to analyze the ability of the selected variables LOTPLN, MEMPRT, and EXPMNG to accurately classify KUDs into the two groups, bad and good performance of KUDs. Although each of the variables already showed some relation to KUD’s performance, Stepwise Discriminant Analysis further explores this re-lation and can show which combination of variables maximizes the difference between bad and good performance groups of KUDs. By systematically observing the correct classification of each KUD into a particular group, an empirical measure of the success of the Discriminant Analysis can be developed and used to test the accuracy of the analysis.
The F statistic is used to test the null hypothesis that the selected variable does not improve the classification. The associated probability values for the F statistics for LOTPLN and EXPMNG are approximately 0.05 and 0.025 respectively. Therefore, the null can be rejected at a = 0.05 and conclude that the two variables significantly improve the classification between the two groups of KUDs.
Table 1. Classification of KUDs into Performance Groups Using Variables LOTPLN and EXPMNG
No. of co-ops in each group
Group Percent correct Bad
Performance
Good Performance
Bad Performance 80.0 4 1
Good Performance 90.0 1 9
Total 85.0 5 10
Table 1 shows the classification of KUDs into the two performance groups by using the selected variables LOTPLN and EXPMNG to classify individual KUDs. The associated percentages of correct classifications are included in the table.
The use of the variables EXPMNG and LOTPLN in the discriminant model to classify each KUD in the appropriate performance group results in a high percentage of correct classifications. More than 80 percent of all the cooperatives were correctly classified using the discriminant model.
The number of years of manager working in KUD coupled with the application of long-term working plan by a KUD provided a good indication of whether a KUD attained a bad or good performance.
Reliability of the SDA
The SDA procedure simply places an individual KUD into either the bad performance group or the good performance group according to the strength of its association with other factors. Because the possibility exists that a KUD will be placed in the wrong classification, it is required to compute the probability that explains why a given KUD belongs to the performance group in which it was classified. The posterior probability, which expresses the probability of belonging to a particular population after performing the analysis was used to evaluate the results of a SDA.
purposes of this study, it was less confidence in the classification of KUDs with a posterior probability closer to the chance probability of 0.5.
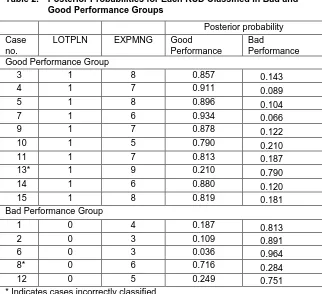
Table 2 lists the calculated posterior probability for each KUD classified in a given performance group. The individual KUD data for the variables LOTPLN and EXPMNG were also included. The two KUDs incorrectly classified by the SDA model are noted with an asterisk next to their case number.
Upon reviewing the data summarized in Table 2, we may have less confidence in the classification of case no. 10 in the good performance group and case no. 12 for the bad performance group. Both cases were correctly classified, but each has a substantially lower probability than the other correctly classified KUDs in their respective groups.
Table 2. Posterior Probabilities for Each KUD Classified in Bad and Good Performance Groups
Posterior probability
Case no.
LOTPLN EXPMNG Good
Performance
Bad
Performance Good Performance Group
3 1 8 0.857 0.143
4 1 7 0.911 0.089
5 1 8 0.896 0.104
7 1 6 0.934 0.066
9 1 7 0.878 0.122
10 1 5 0.790 0.210
11 1 7 0.813 0.187
13* 1 9 0.210 0.790
14 1 6 0.880 0.120
15 1 8 0.819 0.181
Bad Performance Group
1 0 4 0.187 0.813
2 0 3 0.109 0.891
6 0 3 0.036 0.964
8* 0 6 0.716 0.284
12 0 5 0.249 0.751
* Indicates cases incorrectly classified.
cooperative with application of long-term plan in its business and manage by a manager with experience over five years would have a better than 90 percent chance to be classified in a good performance KUD.
Conclusion
There are a number of factors that influence the KUD’s performance in West Lombok Region. This study attempted to determine those factors which appeared to be most closely associated with KUDs exhibiting bad and good performance. KUDs that has KUD performance index exceeding an average level were identified as good performance KUDs and those with the average level or less as bad performance KUDs.
Twenty-one variables were selected which were thought to be important factors affecting performance and were at the same time quantifiable. Both continuous and descrete variables were identified and tested for the nature and extent of their association with the good and bad performance KUD groups. Only three variables showed statistically significant associations with performance. Those were MEMPRT, the level of member participation in the KUD; LOTPLN, the application of a long-term plan; and EXPMNG, the number of years of the manager working in the KUD.
These three variables were then incorporated in a SDA to determine if a particular combination of these variables would satisfactorily assign the KUDs to their appropriate performance categories. In 13 of the 15 KUDs, the two variables LOTPLN and EXPMNG correctly placed the KUDs in their appropriate category.
While the application of a long-term plan and a well-experienced KUD manager in no way guarantee operational success for a KUD, they certainly should increase the likelihood of out performing those KUDs not having those features.
It was somewhat surprising and at first puzzled that at least some of the other variables were not equally helpful in suggesting those characteristics associated with good performance KUD. It was concluded that their failure to do so may have been caused by the relatively short existence of some of the KUDs not permitting sufficient time to establish the presumed associations between those variables and performance characteristics. It was also believed that the method of analysis is valid and that subsequent investigations with more complete data will increase the usefulness of SDA in studies of this type.
References
Adams, T. M. "Vermont Cooperatives: Their Business Activities." Agr. Exp. Sta. Bull. 540, University of Vermont, Burlington. 1946.
Butcher, D. et al. New York Agriculture 2000 Report. N.Y.S. Dept. of Agriculture and Markets, Albany, NY. 1984.
Cramer, G. L. "An Economic Analysis of the Merger Component in the Growth of Agricultural Cooperatives." Univ. Microfilms, Inc.: Ph.D.
dissertation, Oregon State Univ. 1968.
Davidson, D. R. and Street, D. W. "Top 100 Cooperatives, 1983 Financial Profile." USDA, Farmer Cooperative Service. Washington, D.C. 1985.
Fisher, R. A. ' 'The Use of Multiple Measurements in Taxonomic Problems." Annals of Eugenics, 7(1936): 179-188.
French, C. E. et al. Survival Strategies for Agricultural Cooperatives. State Univ. Press, Ames, IA. 1980.
Garoyan, L. and P. O. Mohn. The Board of Directors of Cooperatives. Coop. Ext. Serv., Univ. of California. 1976.
Griffin, N. et al. "The Changing Financial Structure of Farmer Cooperatives." U.S. Dept. of Agr., Farmer Coop. Res. Rpt. No. 17. 1980.
Grinnell, H. C. "An Economic Study of the Organization, Finance and Operations of Farmers' Business Cooperatives in Vermont." Agr. Exp. Sta. Bull. No. 327, University of Vermont, Burlington. 1932.
Henehan, B. M. "An Economic Study of the Organization , Financial
Performance, and Operations of Emerging Farmers1 Cooperatives in Vermont." Masters Thesis, University of Vermont. 1985.
Kerr, S. et al. "Connecticut River Valley Agriculture Project Report." Vermont Dept. of Agriculture and New Hampshire Dept. of Agriculture. February 1982.
Manly 1994. Multivariate Statistical Methods: A Primer. Second Edition, Chapman and Hall, London.
Marion, B. W. and C. R. Handy. "Market Performance: Concepts and
Measures." U.S. Dept. of Agr., Econ Rptg. Serv., Agr. Econ. Rpt. No. 244. 1973.
Richardson, R. M. et al. Statistics of Farmers Cooperatives, 1982. U.S. Dept. of Agr., Agr. Coop. Serv 1984.