Abstract
This study investigates local residents travel behaviour in Bali Province during evacuation in the event of a tsunami. The analyses include shelter and human response time choices. Data were collected by distributing Stated Preferences (SP) questionnaires to local residents from two coastal areas of Kuta and Sanur. Data include household preferences to shelter and response time choices, personal data, socio-economy, a distance of resi-dence to the coastline, and the experience of natural disasters. The analyses are conducted using binary logistic regression model. The study shows that significant factors influencing shelter choices are education levels, car ownership and no natural disaster knowledge. Significant factors influencing response time choices are age, a household with total income per month less than 3 million rupiahs, and car and motorcycle ownerships. The study suggests that the local government should begin to disseminate the alternative types and locations of shelter during an evacuation, considering the limited ability of the government in providing shelter in case of a tsunami. In addition, the local government is expected to consider the types and number of mass transport fleet that must be provided when the tsunami hit.
Keywords: Tsunami, shelter, response time, logistic regression
Abstrak
Studi ini meneliti prilaku evakuasi penduduk lokal jika terjadi tsunami di Provinsi Bali yang meliputi pilihan
tujuan perjalanan ke tempat berlindung (privat atau publik) dan waktu respon (cepat atau lambat). Data dikumpulkan dari dua wilayah pantai yaitu pantai Kuta dan Sanur dengan menyebarkan kuisioner Stated
Preferences (SP) kepada penduduk lokal. Data meliputi preferensi rumah tangga terhadap pemilihan tempat berlindung dan pilihan waktu respon jika terjadi tsunami, data pribadi, sosial ekonomi, jarak tempat tinggal ke tepi pantai, dan pengalaman terhadap bencana alam Analisis dilakukan menggunakan model regresi logistik biner. Hasil studi menunjukkan faktor-faktor yang berpengaruh terhadap pemilihan tempat berlindung adalah tingkat pendidikan, jumlah unit mobil yang dimiliki rumah tangga dan tidak mempunyai pengalaman terhadap bencana alam lainnya (selain Tsunami). Faktor-faktor yang berpengaruh terhadap waktu respon penduduk adalah umur, total pendapatan rumah tangga per bulan kurang dari 3 juta rupiah, jumlah unit mobil dan sepeda motor yang dimiliki rumah tangga. Studi ini menyarankan agar pemerintah daerah mulai mensosialisasikan alternatif tipe dan lokasi tempat berlindung saat evakuasi, mengingat kemampuan pemerintah yang tentunya terbatas di dalam menyediakan tempat berlindung jika terjadi tsunami. Pemerintah daerah juga diharapkan mengkaji tipe dan jumlah armada angkutan masal yang harus disediakan saat terjadi tsunami.
Kata-kata Kunci:Tsunami, tempat berlindung, waktu respon, regresi logistik
.
Travel Behaviour Analysis of Local Residents during Evacuation
in the Event of Tsunami in Bali Province
D.M Priyantha Wedagama
Department of Civil Engineering, Faculty of Engineering, Udayana University, Bukit Jimbaran-Bali, Indonesia 80361, E-mail: [email protected]
Jurnal Teoretis dan Terapan Bidang Rekayasa Sipil Jurnal Teoretis dan Terapan Bidang Rekayasa Sipil
1. Introduction
A high-tech tsunami early warning system has been officially placed in several locations in Indonesia coastal areas in November 2008. This system aims to reduce the recurrence of tsunami impact, especially fatalities as occurred in 2004 in several Asian countries including Indonesia (in particular the Province of Nanggroe Aceh Darussalam). This 1.4 trillion worth of equipment is able to detect and predict earthquakes in the sea within the next five minutes whether a tsunami will occur or not.
Natural disasters including the tsunami have destruc-tive effects on human casualties and material damages. In a such situation, evacuation is the best alternative to ensure the public safety. The key success of evacuation plan is the capability to transport people to a safe loca-tion. Various analytical models however, have been developed to estimate travel demand during evacuation in the event of natural disasters (Faulkner, 2001; Fu and Wilmot, 2004; Charnkol and Tanaboriboon, 2006). These models are used to plan evacuation time and determine the effectiveness of evacuation as part of a proactive strategy of action. One important aspect of the evacuation model is the human behaviour. The hu-man behaviour in question is to translate the knowledge of human beings who were evacuated in the event of a disaster into quantitative measures (Charnkol and Tanaboriboon, 2006).
Travel demand forecasting for evacuation is different to that of daily activities (travel to work, shopping, education and recreation). For the evacuation plan, travel demand forecasting is primarily based on evacu-ation behaviour. It is therefore, very crucial to under-stand the factors that may influence people’s decisions during evacuation.
Tsunami is in fact quite often occurred in the Caribbe-an Sea, the MediterrCaribbe-aneCaribbe-an, IndiCaribbe-an Caribbe-and AtlCaribbe-antic OceCaribbe-an. Tsunami evacuation models however, have been rarely developed in comparison with the evacuation floods, cyclones and hurricanes models (Faulkner, 2001; Charnkol and Tanaboriboon, 2006). In addition, having learned the tsunami experiences in Thailand, Bali prov-ince, especially in the southern coast, requires a trans-portation planning application procedures for evacua-tion in the event of a tsunami. This requires a compre-hensive understanding of what will happen and how to response in the event of tsunami and the impact of tsu-nami on evacuation behaviour. In order to establish the evacuation plan, an analytical model is required to describe human behaviour during evacuation in the event of a tsunami.
The dominant factors that may influence evacuation behaviour consisting the choice a refuge or shelter and the response time in the event of a tsunami. In this study, the choice analyses of both shelter and response time do not consider transport mode and route choices that can be used during evacuation. Many factors how-ever, may contribute to shelter choice and response time in case of tsunami, so that variables used in this study are restricted to follow previous studies in Thai-land by Charnkol, et.al, (2006 & 2007). These include personal data, household characteristics distance of residence from the coastline and previous experiences of both tsunami and other natural disasters. This study aims to support in developing a tsunami evacuation management system in the future and is expected to provide recommendations for tsunami evacuation plan.
2. Literature Review
2.1 Previous studies
A previous study by Charnkol and Tanaboriboon (2006) examined the evacuation behaviour of local residents and tourists in the event of a tsunami in Thai-land. Evacuation behaviour data were collected in two coastal areas of Phuket and Phang-nga. Behaviour anal-ysis was conducted to investigate human responses to tsunami early warning. This analysis particularly deter-mined human evacuation patterns (fast, medium or slow) for which the condition is divided into four inter-vals of preparation and response time of 60, 45, 30 and 15 minutes respectively. Preparation and response curve represents the time to start evacuation and move to a safe place. Preparation and response curves were then estimated and compared between local residents and tourists. Evacuation models were developed with binary logistic regression model to estimate the possi-bility of any local residents and tourists to be in a group (for example, a group that sooner or later response). The results of this model is a natural reaction of tsuna-mi evacuation including response time and evacuation behaviour.
Another study was also conducted on the coast of Phu-ket, Thailand by Charnkol et.al (2007) which examin-ing the alternative of a travel destination or a location used as a refuge (shelter) in the event of a tsunami and the factors that affect local residents and tourists to choose such a site. Trip destination model was developed using logistic regression models describing the shelter choice (either public or private). The results of this study indicated that the estimated goal of this trip is not only describing the information about the preferred shelter type but is also used to plan the mate-rials required during evacuation.
Meanwhile, a study by Fu and Wilmot (2004) assum-ing that the decisions taken at the time of evacuation in case of typhoons or storms are based on a binary choice at a certain time. Binary logit model was developed to determine the evacuation behaviour by the household. The behaviour is determined using the economic char-acteristics of the household, the charchar-acteristics of cyclone/hurricane and the policies adopted by local governments in relation to natural disasters. Based on the analysis, logit model is able to explain the dynamic of human behaviour during evacuation.
2.2 Logistic regression
population proportion or probability (P) that the result-ing outcome is equal to 1. Parameters obtained for the independent variables can be used to estimate odds ratios for each of the independent variables in the model (Washington, 2003).
The specific form of the logistic regression model is:
The transformation of conditional mean (x) logistic function is known as the logit transformation. The logit is the LN (to base e) of the odds, or likeli-hood ratio that the dependent variable is 1, such that
where:
The logistic regression model accounts for a curvilinear relationship between the binary choice Y
and the predictor variables Xi, which can be continu-ous or discrete. The logistic regression curve is approximately linear in the middle range and logarith-mic at extreme values. A simple transformation of Equation (1) yields
The fundamental equation for the logistic regression shows that when the value of an independent variable increases by one unit, and all other variables are held constant, the new probability ratio [Pi/(1-Pi)] is given
as follows:
When independent variables X increases by one unit, with all other factors remaining constant, the odds [Pi/(1-Pi)] increases by a factor exp Bi. This factor is
called the odds ratio (OR) and ranges from 0 to posi-(x) = P = x
tive infinity. It indicates the relative amount by which the odds of the outcome increases (OR>1) or decreases (OR<1) when the value of the correspond-ing independent variable increases by 1 unit.
There is no true R2 value in logistic regression, as there is in Ordinary Least Squares (OLS) regres-sion. Alternatively, Pseudo R2 can be a proxy of an R2 including Cox & Snell Pseudo-R2 and Nagelkerke Pseudo-R2 (Charnkol, et.al, 2007).
The null model includes only the constant while the k model contains all explanatory variables in the model. Cox & Snell R2 value cannot reach 1.0, so that Nagelkerke is used to revise it.
A Hosmer-Lemeshow Test is used to carry out the goodness of fit measure. The null hypothesis for this test is that the model fits the data, and the alternative is that the model does not fit. The test statistic is con-ducted by first breaking the data set into roughly 10 (g) groups. The groups are constructed by ordering the existing data by the level of their predicted probabili-ties. The data are ordered from least likely to most likely for the event. The equal sized groups are formed. From each group, the observed and expected number of events is computed for each group. The test statistic is,
where:
If the observed number of events differs from what is expected by the model, the H-L test will be large and there will be evidence against the null hypothesis. Cox & Snell Pseudo-R2 = R2 = 1 -
= The Hosmer-Lemeshow test (H-L test)
Ok = Observed number of events in the kth
Bi : the parameter estimates for the
inde-pendent variables
Xi : set of independent variables (i =
1,2,...,n)
P : probability ranges from 0 to 1
3. Case Study Area and Data Collection
3.1 Case study area
The case study area is located in the coastal areas of Kuta and Sanur beach as shown in Figure 1. Both loca-tions are considered as the most favourite tourist desti-nations in Bali. In fact, in Kuta beach has been allocated a device of tsunami early warning system.
Kuta beach areas used as research locations cover three sub districts of Seminyak, Legian and Kuta. Mean-while, Sanur beach areas cover three sub districts of Sanur, Sanur and Sanur Kaja Kauh. Based on data obtained from Badung and Denpasar City Central Bureau of Statistics in 2010, the number of population in the study areas in 2009 is presented in Table 1.
Urban neighborhoods chosen as the study area are located on the waterfront. When the tsunami struck, these areas are initially affected. It is realised however, that there are still many potential locations affected by the tsunami given their location on the waterfront. Compared to other waterfront locations however, these two sub-districts are having higher population density and are the most favourite tourist destinations in Bali southern coastal areas.
Tidak untuk
Figure 1. Case study area
Sub Dis-tricts
Population (persons)
Sub Districts
Population (persons)
Sanur 16089 Seminyak 4153
Sanur Kaja 8822 Legian 3422
Sanur Kauh 13960 Kuta 11856
Total 38871 Total 19431
Table 1. Number of local residents in case study area
3.2 Data collection
The number of population of each study area is used to determine the sample size. Using a 10% precision, the number of sample taken in Sanur and Kuta coastal areas were 100 respondents respectively (Yamane, 1967). These samples distributed evenly on each sub district in the case study area. The respondent selection is based on household (of local resident) locations in neighbourhood environment, i.e by the main and local roads and in the alley. These household locations are intended to represent the economy class of the respondents. On the assumption that the respondents who lived by the main and local roads and in the alley are upper, middle and lower classes respectively.
Data are collected by distributing Stated Preference (SP) questionnaires and interviewing local residents in both areas (Kuta and Sanur coastal areas). This ques-tionnaire contained two hypothetical scenarios in which the respondents are asked to give preference or willingness of their shelter choice and response time in the event of tsunami. There are four questionnaires withdrawn from Sanur coastal areas. As a result, there are 196 samples used for this study consisting 96 and 100 samples for Sanur and Kuta coastal areas respec-tively.
predictors. It is realised however, in making evacua-tion decisions, evacuees are more likely considering safer places when given evacuation orders, objective and subjective risk factors. More importanly, social and economic factors are the primary determinants of the destination decision (Whitehead et al., 2000 in Charnkol and Tanaboriboon, 2006). These factors therefore, are highly considered and employed as the predictors (independent variables) in the choice process as shown in Table 2.
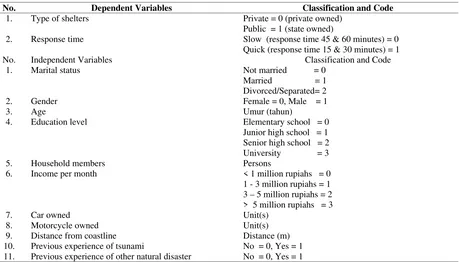
There are two scenarios conducted for this study. The first scenario is a shelter choice in case of tsunami (code = 0 and 1 for private and public shelters respec-tively). During the interview, respondents were given description of shelter’s locations and the difference between shelter’s types (e.g private and public shel-ters). Public shelter is a temporary shelter owned by public and it has only a very minimal protection facili-ties compared to private shelter which consisting hotel or resort or buildings owned by family or friends.
The second scenario is the response times required by the local residents to prepare and evacuate to safer places when tsunami warning is given. Based on a previous study by Charnkol and Tanaboriboon (2006), time interval of tsunami from detected to struck the coast in Thailand was two hours eleven minutes. In that previous study, the response times given for the respondents were 60, 45, 30 and 15 minutes respectively. Generally, this is considered to be a sufficient time to evacuate if the early warning system detector works well (Charnkol and Tanabori-boon, 2006). Having considered above, the response
No. Dependent Variables Classification and Code
1. Type of shelters Private = 0 (private owned)
Public = 1 (state owned)
2. Response time Slow (response time 45 & 60 minutes) = 0
Quick (response time 15 & 30 minutes) = 1
No. Independent Variables Classification and Code
1. Marital status Not married = 0
Married = 1 Divorced/Separated= 2
2. Gender Female = 0, Male = 1
3. Age Umur (tahun)
4. Education level Elementary school = 0
Junior high school = 1 Senior high school = 2 University = 3
5. Household members Persons
6. Income per month < 1 million rupiahs = 0
1 - 3 million rupiahs = 1 3 – 5 million rupiahs = 2 > 5 million rupiahs = 3
7. Car owned Unit(s)
8. Motorcycle owned Unit(s)
9. Distance from coastline Distance (m)
10. Previous experience of tsunami No = 0, Yes = 1
11. Previous experience of other natural disaster No = 0, Yes = 1
Table 2. Study variables
times employed for this study are 60, 45, 30 and 15 minutes respectively. Respondents for this study are expected to answer according to their real household conditions.
Discrete variables classified into several categories or codes are called dummy variables. In the analysis of data using SPSS version 15, then dummy variable must be designed so that both independent variables and dependent variables can be read by the SPSS. A dependent variable on a logistic regression model is a categorical variable or discrete variable. As for the independent variables (independent variables) can be either categorical variables (discrete) or continuous variables as shown in Table 2.
Meanwhile, the ordered logit model has been initially examined for the response time choice data. However, the p-value (sig) for the test of parallel lines of the ordered logit model is less than 5% (p<0.001). This indicates that there is no ordinal nature in the categories, thus the ordered logit model does not fit the response time choice data (Chan, 2005). As the results, the respondents are classified into two groups, a group with fast responses (15 and 30 minutes with code = 1) and slow responses (45 and 60 minutes with code = 0).
4. Model Development and Analysis
independent variables is obtained. The percentage is calculated for a hypothesis testing for each classifica-tion. This is carried out to eliminate the variable classi-fication that have a significance level of less than 5% as shown in Table 3.
The results of this hypothesis test are as follows:
a. Marital status is not used as independent variables because the variability of that category is not signif-icant. This means that the case study area have a high homogeneity of marital status in which most of respondents are married.
b. Gender category is statistically significant so it can be used as an independent variable.
c. A low proportion for the category of graduated from elementary school so it is not statistically significant. This category is combined with the category of graduated from junior high school and defined as a new category of graduated from junior high school
Description X N Sig. 95% confidence interval
Lower Upper Marital Status
Not married* 4 196 0.020 0.0 0.0
Married 181 196 0.923 0.9 1.0
Divorced* 11 196 0.056 0.0 0.1
Gender
Female 74 196 0.378 0.3 0.4
Male 122 196 0.622 0.6 0.7
Education Level Elementary
School* 14 196 0.071 0.0 0.1
Junior High
School* 8 196 0.041 0.0 0.1
Senior High
School 102 196 0.520 0.5 0.6
University 72 196 0.367 0.3 0.4
Household Income per month
< 1 million* 6 196 0.031 0.0 0.1
1 – 3 million 100 196 0.510 0.4 0.6
3 – 5 million 50 196 0.255 0.2 0.3
> 5 million 40 196 0.204 0.1 0.3
Previous experience of tsunami
No 193 196 0.985 1.0 1.0
Yes 3 196 0.015 0.0 0.0
Previous experience of other natural disaster
No 153 196 0.781 0.7 0.8
Yes 43 196 0.219 0.2 0.3
Tabel 3. Hypothesis testing: statistics data
Note:
*) Not statistically significant at the 5% (95% confidence interval consisting 0) with: X = Number of classification and N = Number of data/samples
d. A low proportion of household monthly income below 1 million rupiahs so it is not statistically sig-nificant. This category is combined with total income between 1and 3 million rupiahs and defined as a new category of total monthly income less than 3 million rupiahs.
e. The experience of the tsunami-affected respondents has a very low proportion so it is not statistically significant, thus it is not used as an independent variable.
f. Other natural disaster experience is statistically sig-nificant so it can be used as an independent variable.
5. Results and Discussion
The relationship between independent and dependent variable in the model is examined as shown in Table 5. This table shows that shelter choice and response time models have chi-square test values of 41.002 and 44.147 respectively at 5% significance level. This shows that the two models are structured to have a significant relationship between independent and dependent variables.
Washington, et al. (2003) describes that in a logistic regression model, the higher the value of pseudo R2 (goodness of fit), the better the model. However, this is not always the case. O'Donnell and Connor (1996) states this practical value can be ignored because in a logistic regression model there is no default value for the pseudo R2 to measure the goodness of fit of a model. This value has an upper limit, which both theoretically and empirically are always less than one. Hosmer and Lemeshow test (H-L test) therefore may be used to examine the goodness of fit of a model.
The H-L test value is equal to or less than 5% means that there is a significant difference between the model and the observations since the developed model
Shelter Choice Model Response time Model
Chi-Table 5. Significance of the developed models
Shelter Choice Model Response Time Model
Cox &
Snell R2
Nagelkerke R2
Cox &
Snell R2 Nagelkerke R
2
.189 .261 .202 .290
Tabel 6. Determination coefficient of the developed models
at 95% confidence level can not predict the value of observation. In contrast, if the statistical value of H-L test is greater than 5% then the model is able to pre-dict the value of observations at 95% level of confi-dence. Table 7 shows the significance values of H-L test for two developed models are greater than 5%. The two logistic regression models, i.e shelter choice and response time models are significant and able to predict the value observation at 95% confidence level.
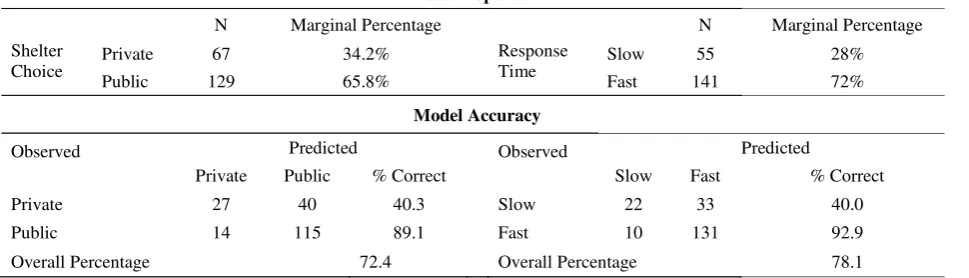
A criteria to examine the classification model accura-cy used is generally 25% or higher than the data pro-portion. This analysis is used to examine whether the full model is significantly different to the null model (a model with constant and with no independent varia-bles). For a shelter choice model, the data proportion is 0.342 ² + 0.658 ² = 0550 (55%) and the model accu-racy is 72.4%. The shelter choice model accuaccu-racy is greater than its data proportion. Similarly for a re-sponse time model, the data proportion is 0.28 ² + 0.72 ² = 0596 (59.6%) and the model accuracy is 78.1%. The response time model accuracy is greater than the data proportion. Both shelter choice and re-sponse time full models therefore, are significantly different and better than their null models.
Significant variables in the model are analysed to examine factors which influencing shelter choice and response time of local residents in Kuta and Sanur coastal areas. Table 9 shows that standard error (SE) value of each independent variable is less than 2.0. This indicated that no multicollinearity (strong de-pendence amongst the independent variable in the model) presents in both models.
Shelter Choice Model Response Time Model
Chi-Tabel 7. H-L test for shelter choice model
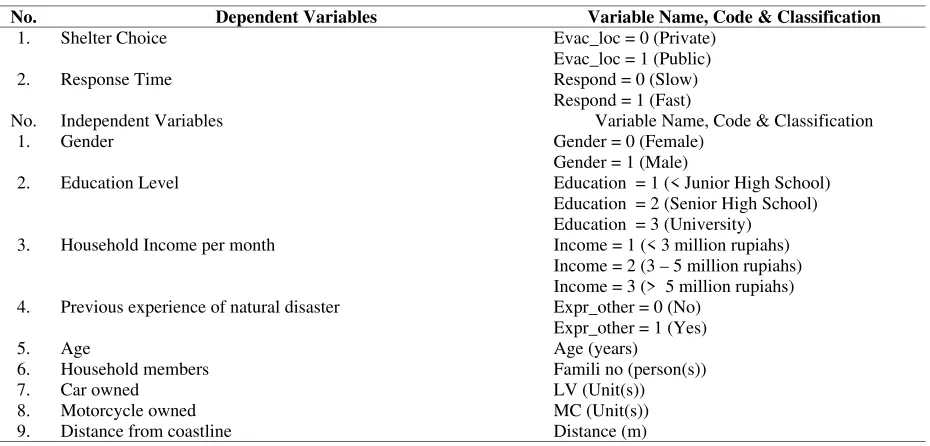
No. Dependent Variables Variable Name, Code & Classification
1. Shelter Choice Evac_loc = 0 (Private)
Evac_loc = 1 (Public)
2. Response Time Respond = 0 (Slow)
Respond = 1 (Fast)
No. Independent Variables Variable Name, Code & Classification
1. Gender Gender = 0 (Female)
Gender = 1 (Male)
2. Education Level Education = 1 (< Junior High School)
Education = 2 (Senior High School) Education = 3 (University)
3. Household Income per month Income = 1 (< 3 million rupiahs)
Income = 2 (3 – 5 million rupiahs) Income = 3 (> 5 million rupiahs)
4. Previous experience of natural disaster Expr_other = 0 (No)
Expr_other = 1 (Yes)
5. Age Age (years)
6. Household members Famili no (person(s))
7. Car owned LV (Unit(s))
8. Motorcycle owned MC (Unit(s))
Data Proportion
N Marginal Percentage N Marginal Percentage
Shelter Choice
Private 67 34.2% Response
Time
Slow 55 28%
Public 129 65.8% Fast 141 72%
Model Accuracy
Observed
Predicted Observed
Predicted
Private Public % Correct Slow Fast % Correct
Private 27 40 40.3 Slow 22 33 40.0
Public 14 115 89.1 Fast 10 131 92.9
Overall Percentage 72.4 Overall Percentage 78.1
Tabel 8. Classification model accuracy
The significant factors influencing shelter choice at 5% significance level are education level, household car ownership and no previous experience of natural disas-ters (other than tsunami). The significance of each factor can be seen from the expected value of the inde-pendent variable (Exp (B)) in Table 9. The likelihood ratios of selecting public to private shelters are as follows:
a. Respondents who graduated from junior high school (or lower) are nearly 14 times greater than those who graduated from the university.
b. Respondents who graduated from high school are approximately three times greater than those who graduated from the University.
Education(1) : Graduated from Junior High School or lower
Education(2) : Graduated from Senior High School
Age : Age of respondent (as a head of a family)
Expr other(1) : Have no previous experience of other natural disaster
Income(1) : Household income < 3 mllion rupi-ahs per month
Income(2) : Household income 3-5 mllion rupi-ahs per month
LV : Number of car owned by household
MC : Number of motorcycle owned by household
where: c. Respondents who have no previous experience of
natural disaster (other than tsunami) are almost four times more than those who do have.
d. A household owning at least one car is almost two times more than that does not.
Respondents who graduated from the university are less interested in public shelters than those who had lower education. In other words, those who had lower level education would have been more interested in public shelters than those who had higher education. Respondents who had lower education possibly are not aware of or having less information about private shel-ters availability in their surrounding areas. In addition, respondents who have at least one car prefer public to private shelters. This may be explained to the fact that public shelters including an open space area or a foot-ball court can also be used as car parking area during evacuation.
Respondents who had no experience of other natural disaster (other than tsunami) also prefer public to pri-vate shelters than those who did. Those respondents who had natural disaster knowledge’s (but tsumami) possibly consider private shelters are more safer than public shelters. In fact, about 78% of respondents (refer to Table 3) had no natural disaster knowledge’s. Generally, this specifies that introducing disaster knowledge is important to the local community in Bali.
Based on the shelter model results, the local govern-ment therefore, has to commence socialising the
alter-Shelter Choice Model Response Time Model
Variables B SE Sig. Exp(B) Variables B SE Sig. Exp(B)
Education(1) 2.631 .813 .001 13.884 Age -.060 .026 .023 .942
Education(2) 1.214 .369 .001 3.368 Income(1) -1.752 .607 .004 .174
LV .622 .259 .016 1.863 Income(2) -.245 .675 .717 .783
Expr_other(1) 1.458 .403 .000 4.297 LV -.817 .272 .003 .442
Constant -1.786 .491 .000 0.168 MC .693 .224 .002 2.000
Constant 3.520 1.302 .007 33.800
native types of shelter that can be used especially on private property during evacuation. This is certainly due to the local government limitation in providing public shelter in the event of a tsunami.
The significant factors influencing response time at 5% significance level are respondent’s age (head of the family), total household income per month less than 3 million rupiahs, and household cars and motor-cycle ownerships. The significance of each factor can be seen from the expected value of the independent variable (Exp (B)) in Table 9. The likelihood ratios of choosing fast to slow responses are as follows:
a. Older respondents are 5.8% (0942-1 = 0.058) less than those younger respondents.
b. A household with total income less than 3 million rupiahs per month is 83% less than a household with total income greater than 5 million rupiah per month.
c. A household owning car is 56% less than that does not have.
d. A household owning motorcycle is two times more than that does not have.
Based on the response time model results, the local government is expected to consider the priority and the way for evacuating the older age group of local resi-dents and for families with low income in the event of tsunami. In addition, the local government should con-sider the appropriate type of mass transport fleet for evacuation in case of tsunami.
In a previous study by Charnkol and Tanaboriboon (2006), the response patterns of permanent residents in the event of tsunami are significantly influenced by the number of family members, residence distance to the coastline, previous knowledge of natural disasters, previous experience of tsunami and boat or ship own-erships. These factors are different to the findings in this study. This is possibly due to different demo-graphic characteristics between local residents in coastal areas in Bali and Thailand. In addition, knowledge and previous experience of tsunami be-tween local residents in coastal areas in Bali and Thai-land may significantly contribute to the response pat-terns.
Further studies however, are still required to investi-gate tsunami evacuation more thoroughly. In addition, more potential predictors (e.g. the distance from local residences to the nearest shelter, shelters capacity and facility, and evacuation routes) should be considered in the developed model.
6. Conclusions
1. The significant factors that influence shelter choices in the case of tsunami are education levels, car ownerships and no previous experience of other natural disasters.
2. The privately-owned shelter tends to be selected by local residents with: higher education levels, no light vehicles and previous experiences of natu-ral disasters other than tsunami.
3. The significant factors that influence the response time in case of tsunami population are age of respondent (head of the family), total household income per month less than 3 million rupiahs, and household car and motorcycle ownerships.
4. Fast response time tends to be chosen by a younger respondent, a household with total income per month greater than 5 million rupiahs and a household with no car but a motorcycle.
5. This study suggested that the local government should begin to socialise the alternative types and locations of the shelter that could be used at the time of evacuation, especially that owned by private. This is certainly due to the local govern-ment limitation in providing shelter in the event of a tsunami. Having considered the local residents groups of age and vehicle ownerships, the govern-ment is expected to consider the number and the types of mass transport fleet that must be provided when the tsunami hit.
References
Chan, Y.H., 2005, Biostatistics 305: Multinomial logistic regression, Singapore Med J, Vol. 46, No. 6, pp. 259-269.
Charnkol, T. and Tanaboriboon, Y., 2006, Tsunami Evacuation Behaviour Analysis, One Step of Transportation Disaster Response, IATSS Research, Vol. 30, No.2, pp. 83-96.
Charnkol, T., Hanaoka, S. and Tanaboriboon, Y., 2007, Emergency Trip Destination of Evacua-tion as Shelter Analysis for Tsunami Disaster: A Case Study in Phuket, Thailand, Proceedings of the Eastern Asia Society for Transportation Studies, Vol. 6.
Fu, H. and Wilmot, C.G., 2004, Sequential Logit Dynamic Travel Demand Model for Hurricane Evacuation, Transportation Research Record, 1882, pp. 19-26.
O’Donnel, C.J. and Connor, D.H., 1996, Predicting The Severity of Motor Vehicle Accident Injuries Using Models of Ordered Multiple Choice, Accident Analysis and Prevention, Vol. 28, No.6, pp. 739 – 753.
Statistics of Badung Regency, 2010. Bali in Figures. Statistics of Denpasar City, 2010, Bali in Figures.