CHAPTER 18
Fish Stock Development under
Hydrographic and Hydrochemical
Aspects, the History of Baltic Sea
Fisheries and Its Management
CORNELIUS HAMMER, CHRISTIAN VON DORRIEN, PETER ERNST,
TOMAS GROHSLER, FRITZ K€ OSTER, BRIAN MACKENZIE, CHRISTIAN M€ OLLMANN,€ GERD WEGNER, and CHRISTOPHER ZIMMERMANN
ABSTRACT
In this chapter, the development of the fishing in the Baltic Sea is reviewed starting with the beginning of the twentieth century. Fishing in the Baltic Sea started in modern terms as flatfish fishery and only after World War II cod, herring and sprat fishery developed and grew eventually to present levels. Effects of climate and saltwater inflows into the Baltic Sea on the flatfish, cod, sprat and herring stock developments are evaluated, first of all in view of the reproductive success, recruitment, and growth. Finally, the potential for the recovery of the eastern Baltic cod stock in its environmental context is discussed.
18.1 INTRODUCTION
The fish community in the Baltic Sea is relatively species poor when compared to fish communities in other ecosystems of similar size (Bartz, 1958; Ojaveer and Kalejs, 2005). The low species richness is due to its low salinity that stresses both marine species immigrating from the North Sea and freshwater species immigrating from freshwater. The species richness is also low because the Baltic Sea is geologically young; species therefore have had relatively little time to invade and adapt to its environment. Nevertheless, as its waters became increasingly infiltrated by fish species of both marine and freshwater origin, humans living in coastal communities began to exploit them.
As a result, fishery in the Baltic has certainly a tradition, reaching back to the times of colonization by the first settlers at theAncylus-lake or even further. As a matter of fact, excavated remainders, rock carvings and paintings indicate the catch of herring, salmon,
State and Evolution of the Baltic Sea, 1952–2005, edited by Rainer Feistel, G€unther Nausch, and Norbert Wasmund CopyrightÓ2008 John Wiley & Sons, Inc.
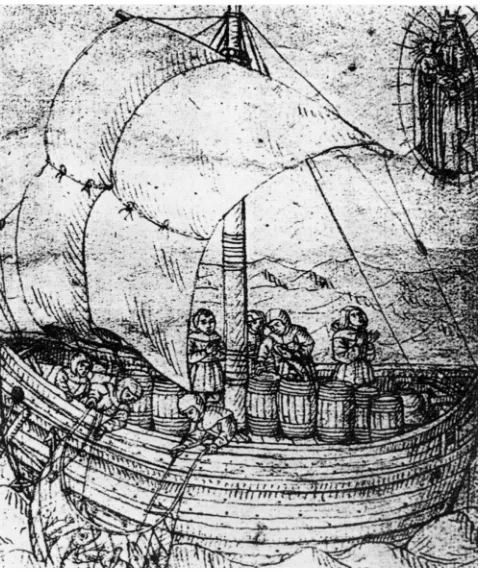
flatfishes, mussels, and seals in coastal area of the Baltic Sea in stone-age times. Even more than today fishing success has been directly dependent on the hydrographical changes in the environment. At the end of the second phase of theAncylus-Lake, about 8000 years ago, a relatively sudden change in the limnic environment occurred when due to eustatic increase of the sea level (Lambeck and Chappell, 2001) the first big salt water intrusion into the region happened, with a rapid increase of the sea level of about 2.5 cm/year (Kliewe and Janke 1982; Lemke, 1998). This will without doubt have had an immediate impact on the fishery of the early settlers in the region at the time after the last ice age, when fast changes took place from a freshwater to a brackish water environment. The relatively sudden appearance of saltwater sets the mark and starting point of hydrographic impacts on the fishery. At least since the ninth century AD long distance trade brought dried and smoked fish from the western and southern Baltic Sea deeper into inshore areas (Lampen, 1997). Archaeological evidence from the Atlantic Warm Period (ca. 7000–3900 BC) shows that fishermen on Bornholm were already catching cod, other gadoids, and flatfishes (Enghoff et al., 2007), indicating that the invasion of the Baltic by marine and brackish species was well underway (Ojaveer and Kalejs, 2005). Later, in mediaeval times (Fig. 18.1), herring schools appeared at the southern and western Baltic coasts in great quantities and provided the base for the first quasi industrial fish processing (Saharge and Lundbeck, 1992). The resulting trade reached up to 100 000 barrels of salted herring per year (Bartz, 1958) and was a cornerstone of the Hanseatic commercial power. The changes of abundance of herring in the Baltic in the
following centuries led to first ideas of local overexploitation during the times of enlighten-ment (Bock, 1769). Still, until the twentieth century fishery was guided by theology according to which fish stocks were not diminishable by fishermen due to their divine task to feed mankind.
By late twentieth century standards, the Baltic fishery has developed only very recently: for example, cod landings in the eastern Baltic Sea during the early decades of the 1900s were only a few thousand tonnes per year, whereas landings at this time in some other European seas (e.g., North Sea, Norwegian-Barents Sea) were>100 000 t (Eero et al., 2007), and cod landings in some other regions were already at this level several hundred years earlier (Øiestad, 1994; Rose, 2004; Rosenberg et al., 2005).
Nevertheless, irrespective of all technical achievements in the modern fishery, it is still directly or indirectly affected by and dependent on the occurrences of saltwater and oxygen-rich inflow in the Baltic Basin (cf. Chapter 9). These occurrences or nonoccurrences determine the distribution and recruitment of the fish stocks, and with some delay also the landings of the fishery, and are therefore of major economic relevance.
For the Baltic the most important fisheries are presently those (in order of quantities) for sprat, herring, cod, flounder, and salmon. Apart from these there are other fisheries, which are only locally important, such as the Danish fishery on dab (Limanda limanda) in the Belt Sea, the pikeperch (Zander lucioperca) fishery in the central but rather more coastal areas of the Baltic Sea or the eel (Anguilla anguilla) fishery in the Oder-Bank region. Historically, Baltic fisheries for eel and some other species (e.g., sturgeonAcipenser sturio, salmonSalmo salar) were much more important than at present. Now most natural populations of these three species are essentially locally extinct, and the Baltic sturgeon is on the Red List in some Baltic countries (Fricke et al., 1996). These local extinctions are probably due to a combination of overfishing and ecosystem changes (especially habitat changes in rivers and coastal areas).
The larger fisheries on the eastern and western cod stocks and about four major herring stocks are presently of most commercial importance. In terms of quantities though the fishery on sprat is the largest (Fig. 18.2). The temporal developments of the spawning stock biomass (SSB), catch, fishing mortality, and recruitment for all of these species have changed with time, dating back as far as the scientific stock assessments reach, but it must be borne in mind that the time scales for the different stocks differ greatly.
It is apparent from Fig. 18.2 that all stocks have recently undergone strong changes in abundance, that is, in the SSB. It is obvious that the first four stocks, that is cod of the central Baltic Sea, cod of the western Baltic Sea, herring in the central Basin and the herring in the Western Baltic Sea, have declined with time, even if the most recent years may show an increase of the SSB again, such as Central Baltic herring.
Not all fish stocks in the Baltic have, however, declined. It is only due to the selection of the five commercially most important stocks presented here, that four out of five stocks show a decline over the years. By contrast, other stocks of herring in the Baltic Sea have increased in the recent past. These are for instance the herring stocks in the Gulf of Riga, and in the Bothnian Sea or the Bothnian Bay. The overall picture is, however, that the stocks showing an increase are the herring and sprat stocks, that is the clupeid species, which are relatively small schooling pelagic fish.
0
1965 1970 1975 1980 1985 1990 1995 2000 2005
spawning stock biomass (1000 t)
1965 1970 1975 1980 1985 1990 1995 2000 2005
catch (1000 t)
1970 1975 1980 1985 1990 1995 2000 2005 0 10
1970 1975 1980 1985 1990 1995 2000 2005
spawning stock biomass (1000 t)
1976 1980 1984 1988 1992 1996 2000 2004
spawning stock biomass (1000 t)
1976 1980 1984 1988 1992 1996 2000 2004
catch (1000 t)
Catch Herring central Baltic 25-29, 32 excl. Gulf of Riga
1970 1975 1980 1985 1990 1995 2000 2005 0
1970 1975 1980 1985 1990 1995 2000 2005 0
1970 1975 1980 1985 1990 1995 2000 2005 0
1970 1975 1980 1985 1990 1995 2000 2005 0
1976 1980 1984 1988 1992 1996 2000 2004 0
1976 1980 1984 1988 1992 1996 2000 2004 0
0
1980 1985 1990 1995 2000 2005
spawning stock biomass (1000 t)
1980 1985 1990 1995 2000 2005
landings (1000 t)
1976 1980 1984 1988 1992 1996 2000 2004
spawning stock biomass (1000 t)
1976 1980 1984 1988 1992 1996 2000 2004
catch (1000 t)
1980 1985 1990 1995 2000 2005 0
1980 1985 1990 1995 2000 2005 0
1976 1980 1984 1988 1992 1996 2000 2004 0
whereas those for the eastern Baltic cod stock go back to the mid 1960s as data collection started earlier for this stock.
The level of the stock biomasses in terms of tonnes of mature fish is certainly the most prominent feature of the stocks, usually taken as the prime proxy of the state of the stocks. This information is, however, only correctly interpreted and thus relevant, in comparison to the past. For instance, a level of some 80 000 t of parental cod in the central Baltic Sea at present may appear large, at least in comparison with the cod stock of the western Baltic Sea, which is ca. 20 000 t. In comparison with its SSB in the early 1980s (700 000 t) the eastern cod stock is without any doubt very low, being presently in the range of 10% of what it used to be in the early 1980s. Such perception is again challenged when going back to the beginning of the time series (Fig. 18.2), since in the mid 1960s the SSB was at a level of some 150 000 t. A much higher stock biomass should be expected in the eastern Baltic Sea as the entire habitat is much larger. Metanalyses have shown (MacKenzie et al., 2003) that this is to be expected.
In other words, the qualitative evaluation of the present appearance of the stock, that is, its size, and what such a number (without any accompanying estimates of the variance) implies, is only (if at all) possible in the light of the past. For this reason it is a constant debate amongst fishermen and scientist about what might be the reference level of“normality.”In the given example of cod in the Central Baltic Sea it boils down to the question whether the high abundance in the 1980s was an exceptional event due to some hydrographical and/or planktological circumstances, or whether during the periods before and after this the environmental circumstances were rather bad or being representative for the prevailing conditions only. Depending on the perception, the management objectives for this stock will alter and the recent past appears by far rather more or less dramatic.
In addition to defining a historical baseline against which current abundance can be compared and interpreted, one can compare the Baltic spatially with other areas. This can be done in a variety of ways, including meta-analytically (MacKenzie et al., 2003). For example, a common feature of animal populations living in the wild is that their mean abundance over time (i.e., many generations) covaries with estimates of habitat size. A similar comparison for cod populations in the North Atlantic shows indeed that larger habitats contain more cod and that in fact one would expect that the eastern Baltic should have a fairly large population, given its size. However, as we can now see, cod spawner biomass currently (2005) is considerably below not only its long-term historical average (Figs. 18.2 and 18.3), but also below the biomass that might be expected on the basis of more general considerations about cod abundance—area relationships (Fig. 18.3). This observation supports the time series evidence that cod biomass in the eastern Baltic is now much lower than might be expected for an ecosystem of such size.
To put the results of the stock assessments into the appropriate perspective and thus to help the interpretation, it is important to try to extend the knowledge on the state of the stocks further into the past, without the aid of fish stock assessments that provide the estimates. One source of data that reach further back than the assessments are the catches of the fishery from the official landings statistics. These have been compiled since the beginning of the twentieth century but have naturally some shortcomings. To circumvent this, the biomass of the fish in the Baltic was estimated back to the 1920s by using the available assessments and indirect methods (Thurow, 1997).
Some of the major deficiencies for the use of the landings data as a proxy of stock abundance are the constant improvement of the fishing technology, the change of fleet behavior due to the variability of prices and the unreliability of the coverage of the collected data. Therefore it is difficult to assess how representative and complete or incomplete the reported landings are. A number of countries have started reporting national catches apparently with some delay or even only long after the fishery had started. It is reported from Meyer and Kalle (1950) for instance that a German, Swedish, Polish, Latvian, and Estonian fishery on cod developed before WW II in the Gotland Sea, which was partly not reported to the official landings statistics. For these reasons the dynamics of the catches are not fully reflected in some cases.
Estimates of the SSB have become available only with the stock assessments, which are based on time series of catches, age and maturity analyses of the cohorts and effort indices of the fisheries for at least about 10 years. Officially reported catch data, though usually without accompanying age and maturity information, reach as far back as the beginning of the twentieth century. Moreover, other kinds of Baltic fishery data (e.g., landings of private individuals, companies or monasteries recorded in diaries; fishery taxes paid to governments and churches; fish exports and imports) are available from earlier centuries (Otterlind, 1984; MacKenzie et al., 2002a; Lajus et al., 2007 submitted, MacKenzie et al., 2007a). In some circumstances historical catch data alone can be direct indicators of changes in abundance or distribution because the fisheries (i.e., technologies, effort, and spatial area) remained unchanged over long periods of time.
There are additional data that can extend the official landings records of fishing activity farther back in time. Archaeological remains also indicate the species composition of local Baltic fisheries and when compared over time can indicate how the species composition change due to fishing and environmental factors (Enghoff, 1999; Enghoff et al., 2007). These historical written and nonwritten data, now being recovered and compiled within projects such as the Census of Marine Lifes History of Marine Animal Populations program (Baltic-HMAP, 2001), will provide new material to develop the historical baselines against which recent biomass fluctuations and management objectives can be interpreted.
As we progress further in time toward the present, and in particular throughout the twentieth century, we must incorporate in our historical discussion of the development of the fish stocks in view of how human society has influenced not only the fish populations via exploitation, but how it has influenced other components of the Baltic ecosystem. The Baltic Sea during the twentieth century has become eutrophied (Hansson, 1985) and nearly all of its top marine mammal predators (seals, harbor porpoises) have been eliminated (MacKenzie et al., 2002b; HELCOM, 2002).
These impacts represent major changes to the productivity, structure, and function of the Baltic food web, and most certainly have influenced the fish community. For example,
predation by seals in 1900 consumed 300 000 tonnes of fish per year (Elmgren, 1989). The influence of eutrophication on fish production in the Baltic is more difficult to assess but in the early decades has probably stimulated fish production via increased primary produc-tion (Nixon, 1988; Thurow, 1997); this event happened in the adjacent waters of the Kattegat (Nielsen and Richardson, 1996). The carrying capacity of the Baltic Sea for fish in 1900 was therefore probably somewhat lower than today (Thurow, 1997; MacKenzie et al., 2002b), even after accounting for todays higher exploitation level. Hence in the intervening years, it cannot be ruled out that these major changes in the Baltic food web have contributed, along with increased fishing effort and technology, to the huge increase in landings. That is, the increase in landings might be due in part to a real increase in fish production and abundance.
Because of the large-scale biomanipulation experiment of the twentieth century, the Baltic Sea should therefore be a fish and fisheries paradise. And in fact for sprat and herring it seems to be (Fig. 18.2). So much so that they are now competing among themselves for food and may even be inhibiting recovery of the cod population. Additional details of these interactions, and the role of climate on their regulation, are described below.
18.2 THE COD STORY
The cod fishery was negligible in the early decades of the 1900s (Bagge et al., 1994; Thurow 1997). The reasons for this are unclear (MacKenzie et al., 2002b)—it was due to low biomass, low regional demand (and therefore low effort) for cod or marketing difficulties (e. g., cod imports from other areas dominated local markets)? These issues are forming the basis of new studies that are investigating the historical development of the cod fisheries in the Baltic Sea (MacKenzie et al., 2002a; Eero et al., 2007). Understanding why landings were low at that time will be important for setting new management objectives for both the Baltic cod population and the ecosystem itself.
Regardless of the cause of the low landings in the early 1900s, the cod fishery in the Baltic Proper clearly increased with the onset of WWII, or shortly before. Cod catches were in the order of a few thousand tonnes only until the mid 1930s and increased to over 20 000 t in the following years until the war. A complete picture is derived if the reports of prewar catches of Lithuania, Estonia, Poland and Sweden (Meyer and Kalle, 1950) of cod in the Central Baltic (many from the Northern Gotland Basin area) are taken into consideration. These catches reached 1000 to 15 000 t between 1925 and 1938 and only partly have been officially reported. Both together demonstrate that a fishery on the cod stock in the Central Baltic existed, although until the war, this was a small and undeveloped fishery, not making much use of the available resource. Prior to the start of WWII, large steam trawlers were banned from the Baltic (Meyer, 1952a) in an effort to conserve flatfish, which is the first notable management measure in the Baltic. The consequence was also that cod was relatively protected from these fishing vessels until the war started.
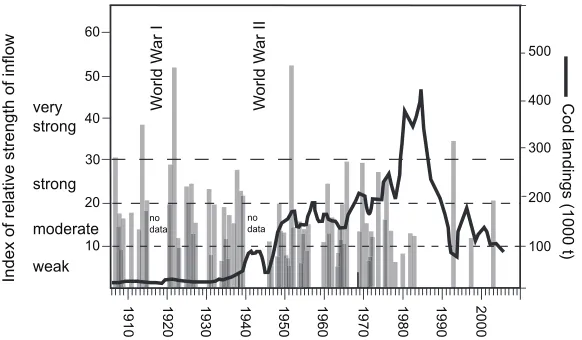
real cod fishery in Baltic Sea started shortly before or with the war: despite the enormous danger some 100 steamers were fishing east of Bornholm (Meyer, 1952b), reaching catches in 1943 of over 80 000 t (Fig. 18.3).
In the following years after the war and until the late 1970s the cod catches increased continuously (Fig. 18.3). During the early 1950s sufficiently refitted and new-built boats and cutters were in use (Hagena and Franz, 1998) and operated in the unregulated international waters outside the 12 n.m. zone and were subsidized nationally for the construction of new vessels and the employment of crew (Jennerich, 1998). The Danish fleet for instance modernized its fleet continuously and changed from coastal boats to small cutters to vessels operating offshore. In 1970, more than half of the nearly 950 vessels of the Danish Baltic Sea fleet was postwar built, and the cod fishery (70% of the catches) in the Bornholm Sea had become its main fishing area. The Polish fleet was similarly modernized, aiming at the open-water resource in the Bornholm Sea, as a nearby resource, offering a lot of high quality food supply at low expense (Tetzlaff, 1972).
Part of the increase in cod catches in the 1950s and 1960s can be attributed to an intensifying fishery discovering a new resource. This seems to be even more the case when including the catches of the USSR and Poland, which have not been recorded by the official FIGURE 18.3 Reported catches of clupeids, cod, and flatfish in the Baltic and Belt Sea. The stated catches represent with great likelihood minimum estimates of the true catches. The data are mostly derived from the Bulletin Statistique (1909–1972) and Bulletin Statistique (1973–2005) for the years 1906–2005. Here the catches for the“Baltic“and the“Belt Sea”are separately specified. According to the more contemporary definition the Belt Sea belongs to the Baltic and is not necessarily distinguished from the remaining Baltic. The data in Bulletin Statistique (1909–1972), (1973–2005) do not represent necessarily the true catches but rather what has been reported. In some cases (e.g., plaice in the years 1921–1938 or cod between 1945 and 1960) the figures in the Bulletin Statistique deviate considerably from other sources, such as Meyer (1952a) for plaice or Meyer and Kalle (1950) and Thurow (1974) and citations in there for cod. As in such cases the reported catches are usually higher than those given in the Bulletin Statistique, it is assumed that the higher figures do represent the true catches better than the smaller figures in the Bulletin Statistique and were accepted for these purposes here. Other missing data were estimated from Thurow (1974) or compiled from other sources Laszcynski et al. (1964), Berner (1957, 1965) as cited there and adopted here. In the earlier years (until WW II) the figures for flounder and dab were partly united, and until the end of WW I all flatfish data were not differentiated either. The catches shown here comprise catches from the Baltic including the Belt Sea catches in most cases. For some years and species this was not possible, as occasionally the catches of the Belt Sea were included in the Kattegat data.
ICES statistics, but can be found in Thurow (1974). Both the Polish and the USSR-catches were reported from 1955 onward in these statistics, starting each with nearly 40 000 t and increasing rapidly in the following years. Other reports (as detailed in Thurow (1974)) provide the catches of the USSR and Poland and give in combination with the ICES-statistics a more complete picture. It becomes apparent from this information that the fisheries have been in operation during the war and with a short interruption (Fig. 18.3) resumed thereafter, and gradually reached the magnitude as reported officially for 1955.
It is not fully clarified to what degree the steady increase of catches between the mid 1940s to the mid 1960s is due to good recruitment of the stock, which subsequently lead to an increase in biomass, or simply to fleet expansion. The latter is however much more likely. The rapid increase of catches in the late 1940s is likely to be due to a combination of rapidly improving technical conditions on board (first of all the availability of small diesel engines for cutters) and as a result increased effort, and improved hydrographic conditions in earlier years; however, inflow data are not available during the war years to fully test this hypothesis. Nevertheless, strong and very strong inflow events in the late 1940s to early 1950s (Fig. 18.4) probably contributed to the reproduction and geographic expansion of the stock during most of the 1950s. For example, the stock will have also spread out further north and east, and the onset of Estonian catches in mid 1930s (Meyer and Kalle, 1950) and Finnish catches in the mid 1950s may indicate that the cod stock expanded in the following years due to the very strong saltwater inflow.
The scientific assessments date as far back as the mid 1960s providing estimates of the SSB. According to these calculations, the SSB in the mid 1960s was ca. 200 000 t and the catches were not very much less, with further increasing trend thereafter (Fig. 18.4). It is evident that the stock would not have sustained the increasing fishing pressure over a longer run if it had not drastically grown itself.
Indeed, in the 1970s another marked increase in the cod catches is notable and coincides with a relatively sudden increase in the stock abundance, which is evident from the
2000
Index of relative strength of inflow
no
assessments. Apparently the series of moderate and strong saltwater inflows had provided conditions that were suitable for the recruitment and growth of the cod in the Bornholm Basin, the Gotland Deep, and the Gdansk Basin.
It is apparent from Fig. 18.4 (and has been reiterated enough in the preceding chapters of this book) that from the early 1980s the inflow regime had apparently changed, leading to less favorable spawning conditions for the adults and survival of the eggs. From now on the catches and the stock biomass are closely linked. The single strong inflow in 1993 had apparently a positive but brief impact on the SSB. The positive effect would have been more dramatic had the exploitation been lower. There is now another chance to benefit from an inflow, the 2003 event. If however fishing (legal or otherwise) continues at the present intensity, then this year class may also not be given the chance to help rebuild the population.
18.3 THE FLATFISH STORY
Several flatfish species inhabit the Baltic Sea (e.g., plaice, flounder, dab). However their distribution varies greatly among species because they have different tolerances for salinity and temperature. For example, flounder distributions extend into the northern Baltic and even some rivers, whereas sole is common in the Kattegat but becomes increasingly rarer as salinity decreases further into the Baltic. Sole abundance in the Kattegat itself also seems to be positively related to temperature (ICES, 2004a). Experimental evidence shows that reproduction in the Baltic Sea by three of these species (plaice, dab, and flounder) is limited by similar factors as cod (i.e., low salinity affects fertilization and hatch success, and via buoyancy differences, increases exposure of eggs of some of these species to low oxygen concentration at spawning sites; Nissling et al., 2002); however, the absolute ranges of sensitivity to salinity are species specific. Hence reproduction and distribution in the flatfish species will be strongly influenced by major Baltic inflows, as will be outlined below in the following discussion of trends in the fisheries and landings.
Even though the official landings statistics need to be treated with appropriate care, the overall picture seems to reflect the history of the fishery in the Baltic appropriately. When comparing the landings during the twentieth century it is apparent from Fig. 18.3 that the entire fishery prior to the mid 1940s remained on a fairly constant level with catches of around 100 000 t. It is remarkable that during this period, apart from the years during WWII, cod was an insignificant or at least not an important species. The prime fishery was clearly a herring fishery, whereas sprat was insignificant until the mid 1930s and was merely of local importance. In addition to this for some time the scene was characterized by a flatfish fishery, which is interesting to investigate a little further.
Each of the two important prewar fisheries, the herring and the flatfish fishery reached at its best years in the late 1930s a magnitude of about 100 000 t. Thereafter the flatfish fishery declined rapidly, remains on a comparatively low level (Fig. 18.3) and has never regained its former importance again.
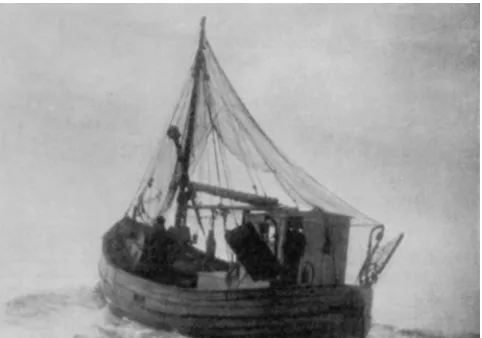
During WW I an intense fishery on flatfish was performed, especially from the German fleet, in the western Baltic Sea, reducing the stock down to nearly nothing (Eichelbaum, 1925), due to severe public food shortage. Soon after, in the 1920s and 1930s flatfish catches of the small cutters (Fig. 18.5) were apparently dominant, this, however more into the area east of Bornholm and the Swedish coast. Attracted by this, German cutters
from Schleswig-Holstein followed and moved their homeports to Mecklenburg and Pommerania (Eichelbaum, 1925). The condition for flatfish growth and reproduction (and/or invasion) were apparently more favorable in the 1920s and 1930s. For instance, in 1930 15 motor-driven vessels and 23 open boats were based in Sassnitz. The open boats operated in a cooperative under the coast of R€ugen Island whereas the motor driven vessels went further out as far as Bornholm Island targeting first of all flounder, but also plaice and herring, sprat and turbot, in 1930 totaling 1781 t. Interestingly, about the same tonnage (1600 t) was caught 65 years later by the same cooperative in 1995 by 18 cutters. Again, the question remains whether the high flatfish catches over almost 20 years have been the result of newly developed fishing methods, and an increase in the fleet or are a consequence of an increase in stock abundance.
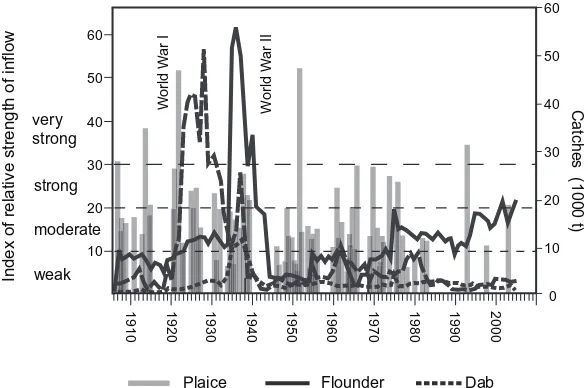
A closer look at the catches (Fig. 18.6) reveals that the flatfish fishery consisted of two distinct phases. During the early 1920s catches of plaice rose rapidly. This was apparently
FIGURE 18.6 Reported catches of plaice, flounder, and dab in the Baltic and Belt Sea (1906–2005).
due to the discovery of plaice abundances in the Bornholm Basin made by the Swedish research vessel“Skagerrak”, carrying out trial hauls away from the traditional near shore fishing places at depths between 20 and 100 m (Hessle, 1934), where plaice catches had declined continuously (Strothmann and Langhammer, 1925). The Danish, German, and Swedish fleets went into this area and made catches of in total more than 50 000 t at the end of the 1920s. Shortly after, the plaice catches declined and the fishery shifted to flounder instead.
From the previous it is now apparent that the very sharp increase of plaice catches in the early 1920s is the result of the discovery of a largely unfished resource, leading to a short bonanza. The fact that there has been a plaice fishery of only a couple of 1000 t before, with marginal catches during WW I, underpins this. Coastal catches have been small and with decreasing tendency. Therefore, it is unlikely that the steep increase in catches was induced by biological effects, even though Strothmann (1935) argues that the increase in size observed in these years was due to the plaice fishery during WWI, which reduced the food competition in the stunted and overcrowded plaice population. This is however less likely the reason for sharply increased plaice catches.
The reverse effect took place only 10 years later, when the stock suddenly declined after a catch of more than 50 000 t (Meyer, 1952a) was made. In the mid 1930s the plaice catches had declined to about 10 000 t and then increased shortly again in 1936 and 1937.
The decline of plaice catches has been subject of a widespread scientific debate. Minimum landing sizes and catch restrictions were imposed (Meyer, 1952a). Germany even initiated a plaice-stocking programme, transferring plaice from the North Sea into the Baltic (Kiel and L€ubeck Bight) (Meyer, 1952a) that totally failed. As a result of rapidly declining catches on plaice the fishery shifted toward herring and cod.
Shortly after the plaice catches declined, an increase of catches is notable for dab and very pronounced for flounder. Flounder catches had increased slightly throughout the 1920s, but sharply peaked at the end of the 1930s. The subsequent drastic decline in the early 1940s is likely caused at least to some degree by the limited WWII fishing conditions, but according to (Meyer, 1952c) still some 27 000 t–17 000 t of flounder were caught during the war. The data series of Meyer (1952c) end in 1944 and the continuing data from (Bulletin Statistique, (1909–1972); Bulletin Statistique, (1973–2005)) are considerably lower. For this reason it is likely that for the subsequent years considerable underreporting of flounder catches occurred for the official landings statistics as given in Bulletin Statistique, 1909–1972 and Bulletin Statistique, 1973–2005.
have revealed whether these fish had newly inhabited the area or not. It is still possible, however, that not a de novo immigration took place with the very strong inflow but that the plaice migrated away from the coastal zones into now favorable habitats in the Bornholm Basin and accumulated there in a relatively small area. In the latter case the mean age and size will have been relatively small. This could only be clarified if otolith samples from these catches were still available.
If the favorable inflow conditions in the early twentieth century had been the cause of plaice growth and/or colonization in the Bornholm Sea the question remains why in later periods of similar favorable inflow conditions such effects were not noticed (e.g., in the early 1950s; Schemainda, 1956). Regardless of what the real reason has been, it is clear that a simple correlation between inflow events and plaice landings is not evident.
18.4 EFFECTS OF CLIMATE- AND FISHERY-INDUCED CHANGES ON BALTIC FISH STOCKS, AND ECOSYSTEM STRUCTURE
Climate-induced hydrographic changes and human exploitation are the main drivers for fish populations in the Baltic Sea (K€oster et al., 2003). Climate change and variability can affect fish populations both directly (through physiology) and indirectly through changes in their biological environment (Ottersen et al., 2004). Changes in the physical environment affect growth and recruitment of fish stocks leading to major fluctuations in stock sizes. These are further affected by the direct impact of fishing and by predator-prey interactions both within the fish community (K€oster et al., 2001), but also with the zooplankton (M€ollmann and K€oster, 2002). Here we review climate effects on cod (Gadus morhua), Baltic sprat (Sprattus sprattus) and herring (Clupea harengus) in the central Baltic Sea, considering effects of the physical environment on reproductive success, recruitment, and growth. Secondly effects of climate and fisheries-induced stock size fluctuations on species interactions and ecosystem structure are described. Finally, we discuss the potential for the recovery of the eastern Baltic cod stock and the benefits of a more balanced ecosystem.
Plaice Flounder Dab
Index of relative strength of inflow
W
18.5 COD REPRODUCTIVE SUCCESS AND CLIMATE-HYDROGRAPHIC PROCESSES
As outlined above, environmental conditions have influenced the dynamics of the cod population in the central Baltic Sea. The primary mechanism is related to the inflow of saline, oxygen-rich water, which is related to large-scale climatic processes (see earlier chapters in this book). This water promotes cod recruitment via several mechanisms. First, cod eggs are neutrally buoyant only in deeper layers of the large basins, where salinities are relatively high. At lower salinities (i.e.,<11 psu), fertilization success and hatchability of cod eggs decreases (Vallin et al., 1999). However, oxygen concentrations at the depth of neutral buoyancy are frequently too low (<2 ml/l) to allow cod eggs to survive (Plikshs et al., 1993; Wieland et al., 1994). Hence, the habitat for successful cod egg development in the Baltic is a layer of water defined by ranges of salinity and oxygen that allow successful fertilization and hatching. Decades of ichthyoplankton surveys (Bagge et al., 1994; MacKenzie et al. (1996a) have shown that cod only spawn in the deeper basins; consequently the cod reproductive habitat can be defined as a volume of water with salinity>11 psu and oxygen concentration >2 ml/l (Plikshs et al., 1993). Estimates of these reproductive volumes for the different
basins show wide variability among and within basins (Fig. 18.8). In general, the Bornholm Basin usually has the best reproductive conditions (volumes always several 10s of km3); volumes in the other basins have wider variations and can often be zero (e.g., during much of 1980s and 1990s in the Gdansk and Gotland Basins.
Much of the variability is related to the inflows of saline water from the North Sea: the major inflows in the late 1970s and in 1993 can be seen as increase in the reproductive volume. The decline in reproductivevolume following an inflow is due primarily to consumption of oxygen. Hence, biogeochemical processes affecting production of organic matter and its decomposi-tion in deep layers has a direct effect on cod reproducdecomposi-tion. These processes operate both at interannual and seasonal scales. For example, the seasonal decrease in reproductive volume estimates between May and August in the Bornholm Basin is positively related to water temperature near the halocline (MacKenzie et al., 1996a). This suggests that higher tem-peratures stimulate the consumption of oxygen in these layers and that some of the oxygen may be lost from the water due to its lower solubility in higher temperatures.
from recovery despite improved egg survival after the major inflow in 1993 (K€oster et al., 2005).
18.6 SPRAT AND HERRING REPRODUCTIVE SUCCESS AND CLIMATE-HYDROGRAPHIC PROCESSES
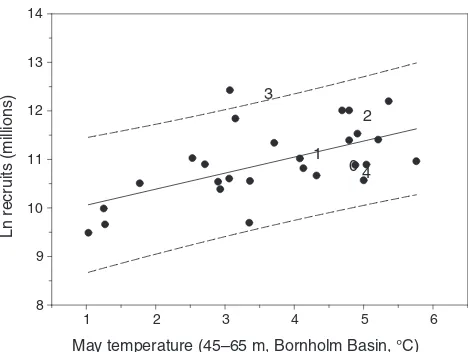
Sprat recruitment has been shown to be driven by climate-induced temperature changes during the years 1955–2005 (MacKenzie and K€oster, 2004; MacKenzie et al., 2008). MacKenzie and K€oster (2004) found a positive correlation between recruitment and the average water column temperature in May (Fig. 18.9). In an exploratory analysis relating recruitment to monthly depth-specific temperatures, Baumann et al. (2006) observed significant temperature-recruitment correlations between March and July in mid-water
Bornholm
FIGURE 18.8 Interannual variability in reproductive volume (water with salinity>11 psu and
oxygen concentration>2 ml/l) in the main cod spawning areas in the eastern Baltic Sea (Plikshs et al.,
depths confirming the results of MacKenzie and K€oster (2004). However, in July to August, correlations shifted to surface waters, with August temperatures in surface waters explaining most of the variability in sprat recruitment (Baumann et al., 2006). These results indicate the importance of direct and indirect effects of temperature on Baltic sprat recruitment. After spawning in spring, sprat eggs occur at depths where the water temperature is affected by winter cooling, and egg and larval development is influenced by extremely low water temperatures. Consequently, weak year classes of Baltic sprat have been associated with severe winters when temperatures of<4C were observed in the intermediate water layer (K€oster et al., 2003; Nissling, 2004). This direct effect of low temperature on eggs and larvae may explain the observed correlations in spring (MacKenzie and K€oster, 2004; Baumann et al., 2006).
The stronger correlations of surface temperature and recruitment in summer (Baumann et al., 2006) may be due to food availability and match-mismatch with the food production (Voss et al., 2006). Sprat larvae prey mainly on the copepodAcartiaspp. (Voss et al., 2003;
Dickmann et al., 2007). Higher water temperatures during the 1990s have resulted in a drastic increase in the standing stock of this copepod (M€ollmann et al., 2003a). Voss et al. (2006) computed an index of larval mortality, which suggests a higher survival of summer over spring born sprat larvae, with pronounced differences in survival for older larvae. Indepen-dent indices of larval growth (RNA:DNA) supported this survival pattern and could be linked to the temporal variability in prey abundance. Growth was faster but less variable in spring-than in summer-born larvae, indicating a strong selection for fast growth in April/May but a less selective environment in June/July (Voss et al., 2006). The advantage for summer-born larvae may be due to the progressed state of theAcartiaspp. population. Although in spring
mostly nauplii are abundant and only very low concentrations of larger copepodites can be found, the situation is reverse in summer. These results suggest that the increasedAcartia
spp. availability during the critical stage of late larvae has contributed to the high reproductive success and eventually the unusual high sprat stock during the 1990s.
6 5
4 3
2 1
8 9 10 11 12 13 14
0 1
2 3
4
May temperature (45–65 m, Bornholm Basin, °C)
Ln recruits (millions)
FIGURE 18.9 Relationship between May temperature at 45–65 m in the Bornholm Basin and sprat recruitment in Subdivisions 22–32 (MacKenzie et al., 2008). The dots are year classes 1973–1999 and the numbers represent year classes since 2000. The regression line (dotted) and 95% confidence limits (dashed) only includes the years 1973–1999 (MacKenzie and K€oster, 2004).
Climate-induced temperature variations affect Baltic herring populations as well. Low recruitment of the Baltic open-sea herring populations during the recent high NAO-period can be explained by low larval survival (Axenrot and Hansson, 2003). However, the Gulf populations (e.g., Gulf of Riga) seemed to have profited from the warmer regime, especially through enhanced copepod production assuring larval survival (G. Kornilovs, personal communication). Almost nothing is known about larval ecology of the open-sea herring stocks. The populations of coastal copepods (e.g.,Acartiaspp.) have increased in the recent warmer period (M€ollmann et al., 2000; 2003b). However, warmer temperatures and enhanced food production did not positively influence the recruitment of the Baltic main basin herring stocks, pointing to the importance of the link between growth and condition. The decreasing growth and condition of the open Baltic herring stock since the 1980s (see below) occurred in parallel to a negative trend in recruitment, suggesting an effect of the former on the latter. Indeed, Laine and Rajasilta (1999) demonstrated that herring females in good condition produce eggs with a higher survival rate. Generally, it is assumed that the successful completion of the embryonic development depends both on parental effects and on environmental conditions at the spawning grounds. The latter is demonstrated by a number of studies showing the importance of the composition and coverage of algal spawning substrates. Especially the availability of certain red and brown algae like Furcellaria, Ceramium, Polysiphoniaseems to be crucial (e.g., Aneer and Nellbring, 1982; Oulasvirta, 1987, Rajasilta et al., 1989; 1993). In this respect, eutrophication of coastal areas, resulting in degradation of algal communities, has caused the disappearance of spawning beds and changes in the location of spawning areas (Oulasvirta, 1987; Oulasvirta and Lehtonen, 1988; Rajasilta et al., 1989). Beside the above listed factors affecting hatching success, temperature conditions impact directly on herring embryonic development. Experimental studies have shown that hatching success depends on temperature with too high temperatures during the incubation period causing lethal developmental abnormalities (Ojaveer, 1981).
18.7 CLIMATE EFFECTS ON GROWTH
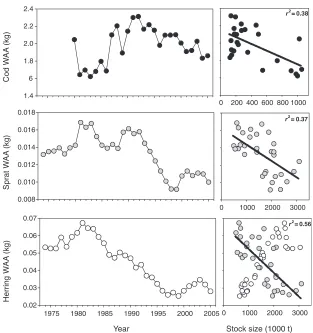
The effect of the physical environment on growth of the major Baltic fish stocks is mainly indirect, working via food availability as well as intra- and interspecific competition. All three major fish stocks displayed pronounced changes in growth during the last three decades (Fig. 18.10).
Both the cod and sprat stocks showed evidence for density-dependent growth. Age-specific individual weight of cod was lowest while the stock size was on record levels during the early 1980s. Since the 1990s individual cod weight was relatively high in parallel to low stock size. Similarly sprat weight-at-age is negatively related to biomass. During the period of low stock size in the 1970s/1980s individual weights were high compared to the period of high stock sizes since the mid 1990s. In contrast, no density-dependent development of growth was observed for herring. Rather individual weights declined in parallel to stock size since the 1970s, with a short increase after the year 2000. However, individual weights were negatively related to the sprat stock size, a fact that is explored below.
(Hansen et al., 2006; Renz and Hirche, 2006). Population size ofP. acuspesdecreased due to the salinity decrease since the mid 1980s (M€ollmann et al., 2000, 2003b). As a result food intake of herring was reduced (M€ollmann et al., 2004) that can be related to the decrease in herring condition (M€ollmann et al., 2003a, 2005). R€onkk€onen et al., (2004) supported this by showing the growth rates of herring in the northern Baltic to be explicitly dependent on the abundance of the copepod.
Food availability, especiallyP. acuspespopulation size, has also been hypothesized to have caused the decrease in sprat growth during 1990s (Cardinale et al., 2002; M€ollmann et al., 2004). However, correlations between the abundance of the copepod and sprat condition in the central Baltic are weak (M€ollmann et al., 2005). It is more likely that strong intraspecific competition at high stock size caused the lowered growth in sprat, explaining the significant relationship between sprat growth and sprat stock size (M€ollmann et al., 2005; Casini et al., 2006). Similarly, intraspecific competition within the large sprat stock has contributed to the reduced herring growth (M€ollmann et al., 2005).
1975 1980 1985 1990 1995 2000 2005 0.02
FIGURE 18.10 Time trends in mean weight at age (WAA) of cod (ages 4–7), sprat and herring (ages 3–5), and results of regression analyses WAA versus stock size (black dots: cod, grey dots: sprat, white dots: herring); linear regressions significant at the 5% level.
Beside the indirect effect of climate induced hydrographic changes via the food availability and the size number of competitors, hydrography may affect growth directly via physiology. Thus a direct relationship among salinity, and herring and sprat growth was shown (Cardinale and Arrhenius, 2000; Cardinale et al., 2002; R€onkk€onen et al., 2004). However, this relationship, may rather reflect the salinity-driven decrease inP. acuspes, than a direct physiological effect on these euryhaline fish species.
18.8 CLIMATE EFFECTS ON SPECIES INTERACTIONS AND ECOSYSTEM STRUCTURE
The decline in the eastern Baltic cod stock due to adverse hydrographic conditions had important effects on the species interactions within the community of commercially important fish species. This is obvious from estimates of predation mortalities by cod (M2) derived using Multispecies Virtual Population Analysis (MSVPA) of cod, sprat and herring for the central Baltic (Fig. 18.11). Both cod cannibalism as well as predation pressure on sprat and herring peaked in the early 1980s, followed by a strong decline. Since the early 1990s predation by cod on their prey is on a stable low level. The decrease in the cod stock resulted in a change in the control mechanism from top-down during the 1970s/1980s to bottom-up since the 1990s, thus representing an indirect effect of climate on the clupeid stocks. Especially the sprat stock profited from the reduced predation control, and due to the climate-driven recruitment success was able to increase the stock to record levels.
Another control process potentially affected by the change from a cod to a clupeid dominated regime is predation on early-life history stages, that is eggs and larvae. As predation by clupeids on larvae of cod and sprat is uncommon in the central Baltic due to a vertical mismatch of predator and prey, a substantial predation on eggs has been observed in the Bornholm Basin (K€oster and Schnack, 1994). Cod egg predation is most intense by sprat at the beginning of the cod spawning season (K€oster and M€ollmann, 2000a). After cessation of their spawning in spring, the largest part of the sprat population leaves the basin, resulting in a reduced predation pressure on cod eggs. In parallel, herring return from their coastal spawning areas to feed in the Bornholm Basin, which includes predation on cod eggs (K€oster and M€ollmann, 2000a). However, the shift in cod peak spawning time from spring to summer (Wieland et al., 2000) resulted in a decreasing predation pressure
1975 1980 1985 1990 1995 2000 2005
0.00 0.05 0.10 0.15 0.20 0.25 0.30
Predation mortality (M2)
Cod
Sprat
Herring
FIGURE 18.11 Time trends in annual average predation mortality (M2) for cod ages 0–1 (black
by sprat. Additionally a decline in individual sprat predation on cod eggs was observed from 1993 to 1996, despite of relatively high cod egg abundance in the plankton. This is explainable by a reduced vertical overlap between predator and prey. Because of the increased salinity after the 1993 major Baltic inflow (Matth€aus and Lass, 1995), cod eggs were floating in shallower water layers, while clupeids dwelled deeper, owing to enhanced oxygen concentration in the bottom water (K€oster and M€ollmann, 2000a). Thus, predation pressure on cod eggs is higher in stagnation periods, and contributed to the low cod reproductive success since the 1980s. Similarly, egg cannibalism was found to be an important source of sprat egg mortality in the Bornholm Basin, thus representing a self-regulating process for the sprat stock (K€oster and M€ollmann, 2000b).
A decrease in top predators and resulting increases in planktivores are believed to cascade down the food chain, thus influencing the dynamics of lower trophic levels (e.g., Frank et al., 2005; Scheffer et al., 2005). Hence, the drastic increase in sprat suggests a top-down control of zooplankton (Rudstam et al., 1994). In the deep basins of the central Baltic interactions between planktivorous fish and zooplankton populations are driven by the vertical overlap of predator and prey species. Within the zooplankton community the habitat is partitioned between the major copepod species (Schulz et al., 2007), withAcartiaspp. occupying the layer in the vicinity of the seasonal thermocline,Temora longicornisinhabiting the deeper intermediate water, andP. acuspesthe even deeper halocline region (Hansen et al., 2006; Renz and Hirche, 2006). This results in major overlaps between the latter two species and sprat and herring feeding in the deepwaters. M€ollmann and K€oster (2002) calculated the consumption of these fish populations for the years 1977–1996 and related it to the production (C/P-ratio) of copepod species.
Resulting C/P-ratios are consistently high only forT. longicornisandP. acuspespreyed upon by sprat, suggesting a fish predation control only on these species (Fig. 18.12). Further, these findings suggest that the increase in the sprat stock and the resulting increase in predation has contributed to the decline ofP. acuspes(M€ollmann et al., 2003b), representing thus a species-level trophic cascade from cod to sprat toP. acuspes. The effect of increased predation onT. longicornis, however, was obviously compensated by the positive effect of the warming during the 1990s, which has prevented a similar decline as observed for P. acuspes(M€ollmann et al., 2003b).
1978 1980 1982 1984 1986 1988 1990 1992 1994 1996 0.0
0.2 0.4 0.6 0.8 1.0
Sprat consumption per copepod production (C/P)
FIGURE 18.12 Predation pressure (C/P—sprat population consumption per copepod production) by sprat on the copepodsPseudocalanus acuspes(black bars) andTemora longicornis(grey bars); data are from M€ollmann and K€oster, 2002.
Figure 18.13 summarizes the main direct and indirect effects of climate- and fisheries-induced processes that have led to the present low cod/high sprat regime in the central Baltic Sea. Climate-induced decreases in salinity and oxygen in the deep basins have negatively affected the cod stock through high egg mortality and lowP. acuspesavailability for the larvae. Temperature increase on the contrary caused high sprat egg survival and highAcartia spp. availability for larval sprat. The resulting decrease in the cod stock and the increase in the sprat stock have been amplified by a strong fishing pressure on the already suffering cod stock. This released the sprat stock from predation and increased the predation pressure on P. acuspes. The latter process stabilized the low level of cod recruitment due to low food availability for cod larvae.
18.9 THE POTENTIAL FOR A RECOVERY OF THE EASTERN BALTIC COD STOCK AND BENEFITS FROM A POTENTIALLY REESTABLISHED BALANCED ECOSYSTEM
Fishery and hydrography are obviously the major driving forces of the fate of the eastern Baltic cod stock. In the absence of a large foraging cod stock, sprat stocks thrive, foraging themselves on the food of cod larvae and on cod eggs as well, leading to a sprat-dominated ecosystem (Fig. 18.14).
The cod stock has been driven down on the one hand by a rigorous fishery, with total allowable catches exceeding over many years the scientific recommendations, the repro-duction on the other hand was hampered by the adverse hydrographic conditions. Under the prevailing conditions, with a continuous lack of inflow and a very high sprat stock a recovery
F
PS
AC
Climate/Hydrography
C SPR
FIGURE 18.13 Scheme summarizing the processes leading to the present low cod/high sprat
of the cod stock at present appears rather unlikely, at least given the current fishing pattern that includes high exploitation of immature cod (ICES, 2006).
However, this situation could probably be reversed if fishing regulations for cod were changed and effectively implemented. This could be done two ways. First, a complete ban on cod fishing in the eastern Baltic has been recommended by ICES for several years in the early 2000s, including 2006, but has not been implemented. Population modeling of the development of the population in the absence of fishing and assuming the low recruitment pattern of the past 10–15 years would still allow the population to increase above safe biological limits with 3–5 years (ICES, 2003, 2005). Secondly, recovery would occur even faster during the moratorium period if an inflow occurred that would increase reproductive success.
On the contrary, continued exploitation, including exploitation of immature cod (ICES, 2006), will delay recovery and increase the risk of extinction from the eastern Baltic Sea (Jonzen et al., 2002; ICES, 2005). This scenario of population collapse due to high exploitation on a marine species at its edge of distribution in the Baltic Sea has occurred before for the dabLimanda limanda(Temming, 1989). Furthermore, once the population
decreases to extremely low levels, recovery may not occur even if cod fishing is banned; this precedent has occurred for cod populations in Newfoundland waters (Hutch-ings, 2000).
We believe that the eastern cod population could still recover relatively quickly. Our optimism is based on the fact there is still a modest population left (ca. 60 000 t, or ca. 25% of the long-term mean spawner biomass; ICES, 2006) and because at least one other European cod population recovered from high exploitation during a fishing ban (North Sea cod during
FIGURE 18.14 Schematic presentation of processes stabilizing a cod or sprat dominated system in the central Baltic. Note the vertical line represents the situation in the second half of the 1990s with the regime shift taking place in the late 1980s and the early 1990s (from K€oster et al., 2003).
World War II; Pope and Macer, 1996). If the Baltic cod population were allowed to recover, there would be many environmental and ecosystem benefits.
First, the cod population itself would be at much lower risk of becoming extirpated. Here we note that the eastern Baltic cod population is physiologically adapted for reproduction in the brackish water of the Baltic Sea (Nissling and Westin, 1997; Nissling et al., 1999) and is genetically distinguishable from other north Atlantic cod populations (Nielsen et al., 2001). It is unlikely therefore that if it were to collapse or be extirpated, it could be quickly replaced by immigrants from other areas (MacKenzie et al., 2007b).
Second, the populations of herring and sprat would decrease because of an increase in predation (K€oster et al., 2001, 2003). As a consequence of their decrease in population size, the density-dependent competition within and among these species for zooplankton prey (M€ollmann et al., 2005; Casini et al., 2006) would decrease. This should subsequently lead to an increase in their growth rates and condition (M€ollmann et al., 2005; Casini et al., 2006). Given that the demand by humans for Baltic herring has partly decreased because of their lower condition, larger and better-conditioned herring would make these fish more attractive to human consumers.
Third, marine ecosystems that have lost populations at high trophic levels are less able to maintain the full range of ecosystem functions (e.g., grazing control of phytoplankton, regeneration of nutrients) than when the food web was more complete and when larger fish were present (Frank et al., 2006; Solan et al., 2006; Worm et al., 2006). Even if we do not know mechanistically how ecosystem functions depend on the upper trophic levels, conserving and recovering these populations, species and size groups is an insurance against loss of ecosystem functions in future. For example, loss of a major piscivore such as cod increases the risk of the Baltic Sea becoming overpopulated or invaded by small, lower trophic level fish species, which have less or no commercial value. This appears to be happening because the abundance of sprat (Fig. 18.2), and round gobies, Neogobius melanostomus, has increased in the past 5–10 years (Corkum et al., 2004).
Once recovery of cod to (above) safe biological biomass has occurred (presently defined as 240 000 tonnes or precautionary spawner biomass; ICES, 2006), the fishery could be re-opened but at a lower more sustainable level. The minimum legal size of cod should also be increased to allow many more cod to have a chance of spawning at least once during their lifetime. Present minimum sizes allow targeted and bycatch capture of many juveniles (ICES, 2006). Implementation of these measures would reduce the risk of population decline in future.
These food web and fishery interactions indicate that managing the fisheries in a sustainable manner will have many positive benefits for not only the fish populations, but also the integrity of the Baltic ecosystem.
18.10 MANAGING INTO AND OUT OF THE CLUPEID TRAP—A CASE FOR CONSERVATION AND BALTIC ECOSYSTEM IMPROVEMENT
stocks thrive, foraging themselves on cod eggs and larvae, leading to an oscillation between a cod and a sprat dominated ecosystem. Sprat is clearly in dominance at the present at least in the central Baltic Sea, whereas this role is taken by herring further north and east, in the Bothnian Sea and Bothnian Bay.
The cod stock in the central Baltic Sea has been driven down by hampered reproduction on the one hand, caused by shrinkage of the reproductive volume and the reduction from three spawning sites to practically only one in the Bornholm Basin. On the other hand, under the prevailing conditions, with a continuous lack of inflow and a very high sprat stock a recovery of the cod stock appears rather unlikely. Even less so, given the current fishing pattern, which includes high exploitation of immature cod (ICES, 2006) by a rigorous fishery, with total allowable catches exceeding over many years the scientific recommendations (Hammer and Zimmermann, in press) and the efforts of the International Baltic Sea Fisheries Commission (IBSFC).
The IBSFC was established based on Article Vof the Gdansk Convention on Fishing and Conservation of the Living Resources in the Baltic Sea and the Belts (The Gdansk Convention) as a regional fisheries management organization, with the aim to regulate the fishery via Total Allowable Catches (TACs) and technical regulations in the Baltic after the establishment of the national exclusive economic zones. As a result, the international waters beyond the 12 n.m. zones disappeared and the Baltic consisted only of national waters, making international cooperation mandatory. The IBSFC-convention was signed in 1973 and came into force in 1974, becoming an organization with a convention area exclusively under national jurisdiction.
The Gdansk Convention was issued to protect the fisheries resources of the Baltic Sea and the Belts and to accomplish their rational utilization by a close cooperation between the Contracting Parties of the Convention. The Gdansk Convention covered all waters of the Baltic Sea and the Belts (excluding internal waters) and all fish species and other living marine resources in the Convention Area.
1970 1975 1980 1985 1990 1995 2000 2005
100 200 300 400 500 600 700
0
Spawning stock biomass cod central baltic (1000 t)
Spawning stock biomass baltic sprat (1000 t)
500 1000 1500 2000
0 Sprat
Cod
FIGURE 18.15 Spawning stock biomasses of cod and sprat of the Baltic Sea and cod of the central Baltic Sea. Mind the different ordinate scales for sprat and cod, data derived from ICES (2006).
The Standing Committee on Regulatory Measures of the IBSFC prepared proposals for regulatory measures to be adopted by the Commission based on the scientific advice provided by the Advisory Committee on Fishery Management (ACFM) of ICES.
Since 1974 the IBSFC underwent a series of structural and organizational changes, first due to the end of the Soviet Union and the subsequent increase of member states of the IBSFC from the Baltic states, and soon after due to extension of the European Community. As a result, the IBSFC shrunk from 8 to 6 members when Sweden and Finland joined the EU in 1995 (IBSFC, 1995). When eventually the Baltic States and Poland joined the EU in 2004 the organization consisted only of two members, the EU and the Russia. As a consequence the IBSFC was dissolved on January 1, 2006.
Within the 30 years of existence the Commission was empowered to adopt extensive measures to support the conservation of the fish stocks that were negotiated and agreed during the Annual Sessions and laid down in the Fishery Rules of the IBSFC. The adopted measures were mainly technical regulations on minimum mesh sizes, minimum landing sizes of fishes, or the introduction of better selecting gears, especially in the directed cod fishery (IBSFC, 1997, 1998, 2001, 2002, 2003), effort reduction like a temporary ban (closed areas, closed seasons) of the cod fishery, which was established from 1996 onward (IBSFC, 1995). In 1997 (IBSFC, 1997) a“Salmon Action Plan”was established as a long-term management scheme for the period 1997–2010. Further Action Plans were introduced under the“Baltic 21”initiative as implementation of the“Agenda 21”for the Baltic based on
the“1992 Rio Declaration.”
In spite of this, the setting of annual TACs was the most important conservation instrument of the IBSFC from the beginning. On the basis of the available scientific advice TACs were set for the four main commercial species cod, herring, salmon, and sprat (Table 18.1). The TACs as collated in Table 18.1 are the results of the international political discussions and deviate considerably from the scientific ICES advice, even if both are not in all cases directly comparable (Hammer and Zimmermann, 2003, in press). Even if the deviations of the TACs from the scientifically recommended ones were significant and the implementation was in many cases reluctant and slow, must the IBSFC be regarded as a success in international cooperation, especially in the political environment of the cold war. And even now where most of the area is under EU jurisdiction is the implementation still not optimal (see ICES, 2006). In the past the implementation could have and nowadays could still be done two ways. The most straightforward measure would be to adhere strictly to the scientific recommendations and to improve significantly the control and enforcement. Second, in the more recent history, a complete ban on cod fishing in the eastern Baltic has been recommended by ICES for several years since the early 2000s, including 2006, but has not been implemented.
Not following the scientific advice for extended periods bears considerable and increas-ing risk, whereas population modelincreas-ing of the development of the population in the absence of fishing and assuming the low recruitment pattern of the past 10–15 years would still allow the population to increase above safe biological limits with 3–5 years (ICES, 2003, 2005). Recovery would occur even faster during the moratorium period if an inflow occurred that would increase reproductive success.
TABLE 18.1 Total Allowable Catches (TACs) Established by the IBSFC for the Respective Years by ICES Subdivisions and/or Areas
Year
Herring Sprat Cod Salmon
22–24/t 25–29 S/ta GOR/t
25–29 S and 32/t
29 N,
30, 31/t 22–32/t 22–32/t 22–24/t 25–29/t
24–31 Main Basin and Gulf of Bothnia/ numbers
32 Gulf of Finland/ numbers
1977 422 000 275 000 275 000 185 000
1978 444 000 184 000 184 000 174 000
1979 405 000 161 000 161 000 175 000
1980 420 000 81 000 81 000 235 000
1981 419 000 60 000 60 000 227 000
1982 445 000 48 000 48 000
1983 475 000 48 000 48 000
1984 475 000 58 000 58 000
1985 480 000 85 000 85 000
1986 490 000 105 000 105 000
1987 490 000 117 000 117 000
1988 490 000 117 000 117 000
1989 490 000 142 000 142 000 220 000
1990 483 000 150 000 150 000 211 000
1991 486 000 163 000 163 000 171 000
1992 486 000 290 000 290 000 100 000
1993 650 000 415 000 415 000 40 000
1994 650 000 90 000 700 000 700 000 60 000 600 000 120 000
1995 560 000 110 000 500 000 500 000 120 000 500 000 120 000
1996 560 000 110 000 500 000 500 000 165 000 450 000 120 000
1997 560 000 110 000 550 000 550 000 180 000 410 000 110 000
1998 560 000 110 000 550 000 550 000 145 000 410 000 110 000
(continued)
TABLE 18.1 (Continued)
Year
Herring Sprat Cod Salmon
22–24/t 25–29 S/t GOR/t
25–29 S and 32/t
29 N,
30, 31/t 22–32/t 22–32/t 22–24/t 25–29/t
24–31 Main Basin and Gulf of Bothnia/ numbers
32 Gulf of Finland/ numbers
1999 476 000 94 000 468 000 468 000 126 000 410 000 100 000
2000 405 000 85 000 400 000 400 000 105 000 450 000 90 000
2001 300 000 72 000 355 000 355 000 105 000 450 000 70 000
2002 200 000 60 000 380 000 380 000 76 000 450 000 60 000
2003 143 349 23 000 60 000 310 000 310 000 75 000 460 000 50 000
2004 143 349 28 000 420 000 29 600 32 000 460 000 35 000
2005 46 000 130 000 38 000 550 000 27 700 460 000 17 000
2006 47 500 128 000 40 000 468 000 28 400 49 220 460 000 17 000
22: Western Baltic Sea, Mecklenburg Bight, 23: The Sound, 24: Arkona Sea, 25: Bornholm Sea, 26: Gdansk Basin, 27: Western Gotland Sea, 28-1: Eastern Gotland Sea, 28-2:Gulf of Riga, 29: Baltic Proper, 30: Bothnian Sea, 31: Bothnian Bay, 32: Gulf of Finland. Blank spaces indicate no established or agreed TAC (TACs).
a
18.11 INFLUENCE OF CONTAMINANTS ON BALTIC FISH AND FISHERIES
The Baltic is unfortunately a depository for many persistent pollutants, including heavy metals, Polychlorinated biphenyls (PCBs) and dioxins (see Chapter 14). Because of its limited exchange with the North Sea, chemical pollutants accumulate in sediments and biota. Concentrations of many of these contaminants have fortunately decreased in the past 10–20 years (HELCOM, 2003) including in the tissues of fish (Fig. 18.16). This must be regarded as a great success of diverse international antipollution initiatives. Despite this, a number of contaminants in fish have remained stable or have even increased and present contaminant levels in the Baltic Sea are still likely to affect cod and other fish species (Schnell et al., 2003; Lehtonen and Schiedek, 2006). However, comprehensive knowledge regarding the biological impact of contaminants either individually or in combination is still limited and their assessment should be included in future monitoring strategies (Lehtonen et al., 2006).
The overall temporal trend for SDDT in fish tissue in the Baltic Sea is a drastic decrease since the 1960s and for PCBs and HCBs since the early 1990s (HELCOM, 2002). The concentration of dioxins is however remaining relatively stable after declining in the 1970s and 1980s (HELCOM, 2002, Anonymous, 2000). Aside from their influence on the fish, the concentrations directly affect the fisheries, at least for some species and sizes of fish, as the dioxin content in Baltic herring can exceed many
1996
Sprat: Roots and Aps 1993 Sprat: Falandysz 1985
E. cod: Bignert et al. 1998 E. cod: Kannan et al. 1992
FIGURE 18.16 Concentrations of PCBs (a) in Baltic herring, sprat, and salmon muscle and (b) in cod liver (MacKenzie et al., 2004). Error bars represent two standard errors.
fold the prescribed EU maximum level (Kiviranta et al., 2003). Swedish authorities have introduced restrictions on the human consumption of fish with fatty tissue, namely herring and salmon. The concentrations are still too high and the Finnish and Swedish Food Administrations recommended in the mid 1990s women of reproductive age, children, and young adults and in particular pregnant women not to consume large amounts of these species, or, respectively, not to consume such fish at all (Anonymous, 1996, 2005; Darnerud et al., 2003). According to Assmuth and Jalonen (2005) the Community dioxin strategy was adopted, whereas Sweden and Finland opposed the EU restrictions on fishing, stressing the socioeconomic and cultural importance of fishing and of certain fish products such as herring in national diets, and the health benefits from consumption of fatty sea fish. Sweden and Finland were thus allowed to delay full implementation of EU limits (EU, 2001) on dioxins in fish. On the basis of the derogations granted to Finland and Sweden in 2002, domestic sale and consumption of dioxin-laden Baltic Sea fish will be allowed until at least 2006, and fish exceeding the EU concentration limits can be sold in Finland and Sweden and outside EU but not to other EU countries (Assmuth and Jalonen, 2005). Germany and Denmark accepted the limit values as such and based on own investigations (Anonymous, 1998, 2004a) Denmark prohibited catch and sale of herring from the eastern Baltic Sea in 2004 in Denmark (Anonymous, 2004b).
Fisheries also have some influence on overall contaminant budgets of the Baltic Sea (MacKenzie et al., 2004). Fishing in the early 1980s removed 40–60 kg PCB/year from the Baltic and ca. 10 kg/year in the mid 1990s (most recent data available). These removals are comparable to some components (i.e., degradation in water column, advective loss to North Sea) of an existing PCB budget model for the Baltic Sea (Wania et al., 2001; MacKenzie et al., 2004).
18.12 SUMMARY AND PERSPECTIVE
In this chapter, we review fishing history and climate effects on cod, sprat, and herring stocks considering effects of the fishery and physical environment on stock development and the reproductive success, recruitment, and growth. Finally, the potential for the recovery of the eastern Baltic cod stock and the benefits of a more balanced ecosystem are discussed.
By the late twentieth century standards, the Baltic Sea fishery developed only very recently. For the Baltic the most important fisheries are presently those (in order of quantities) on sprat, herring, cod, flounder, and salmon. All stocks have recently undergone strong changes in abundance. Four stocks have declined, even if the most recent years may show an increase of the SSB again, such as central Baltic herring. Human activities have influenced not only the fish populations via exploitation, but also other components of the Baltic ecosystem. The Baltic Sea has become eutrophied during the twentieth century and nearly all of its top marine mammal predators (seals, harbor porpoises) had been eliminated, being, however, in the process of recovery now. This caused major changes to the productivity, structure, and function of the Baltic food web, and most certainly has influenced the fish community.