3D VISUALIZATION OF MANGROVE AND AQUACULTURE CONVERSION IN
BANATE BAY, ILOILO
Gerard. A. Domingo, Mayann M. Mallillin, Anjillyn Mae C. Pereza, Alexis Richard C.Claridadesa, b, c, Ayin M. Tamondonga, b
a
Department of Geodetic Engineering, University of the Philippines, Diliman, Quezon City 1101 b
Phil-LiDAR 2 Program Project 2: Aquatic Resources Extraction from LiDAR Surveys, University of the Philippines c
KEY WORDS: Mangroves, Aquaculture, Change Detection, Support Vector Machine Classification, 3D Visualization, Perception Survey
ABSTRACT:
Studies have shown that mangrove forests in the Philippines have been drastically reduced due to conversion to fishponds, salt ponds, reclamation, as well as other forms of industrial development and as of 2011, Iloilo’s 95% mangrove forest was converted to fishponds. In this research, six (6) Landsat images acquired on the years 1973, 1976, 2000, 2006, 2010, and 2016, were classified using Support Vector Machine (SVM) Classification to determine land cover changes, particularly the area change of mangrove and aquaculture from 1976 to 2016. The results of the classification were used as layers for the generation of 3D visualization models using four (4) platforms namely Google Earth, ArcScene, Virtual Terrain Project, and Terragen. A perception survey was conducted among respondents with different levels of expertise in spatial analysis, 3D visualization, as well as in forestry, fisheries, and aquatic resources to assess the usability, effectiveness, and potential of the various platforms used. Change detection showed that largest negative change for mangrove areas happened from 1976 to 2000, with the mangrove area decreasing from 545.374 hectares to 286.935 hectares. Highest increase in fishpond area occurred from 1973 to 1976 rising from 2,930.67 hectares to 3,441.51 hectares. Results of the perception survey showed that ArcScene is preferred for spatial analysis while respondents favored Terragen for 3D visualization and for forestry, fishery and aquatic resources applications.
1. INTRODUCTION
1.1 Background of the Study
Mangrove forests in the Philippines, despite offering social, economic, and ecological benefits and functions, have been reduced drastically due to conversion to fishpond, salt ponds, reclamation, and other forms of industrial development (Melana, et. al., 2000). Aquaculture development, where ponds were built up into cultured ponds for production of shrimp, fish, and other aquatic resources, is known to be the leading cause of mangrove loss in the country (Garcia, et. al., 2013).
Banate Bay, the source of living of the people living in the coastal towns of Anilao, Banate, and Barotac Nuevo in Iloilo, is not only known for harboring tons of fishes but also a haven for mangroves (Overseas, 1998). Despite this fact, Iloilo has one of the largest percentages of mangrove areas being converted into aquaculture. In fact, as of 2011, it has 95% of mangrove to fishpond conversion percentage (Primavera, et. al., 2011). Although greater conservation and rehabilitation efforts have been in place (Samson & Rollon, 2008), it is expected that the mangrove ecosystem in the country will continue to degrade (Fortes, 2004). This is mainly due to planting of wrong species in the wrong areas (Primavera & Esteban, 2008).
Geovisualization is a helpful tool for the display of spatial information, and it provides a different perspective and insight into the datasets (Cartwright, 2004). 3D visualizations offer more realistic objects and users can comprehend patterns and relationships better than when presented in 2D or in still graphics (Laurini, 2017). Nowadays, it is widely used as a tool
for effective and efficient decision-making processes (Lange, 2005). This study uses four (4) various platforms to model land cover changes, particularly mangrove to aquaculture conversion of the study area, from 1973 to 2016 and to provide realistic 3D virtual environment allowing interaction and navigation of respondents. Also, results from the perception survey conducted can help future researchers on the proper selection of platform for different purposes and audiences of 3D visualization.
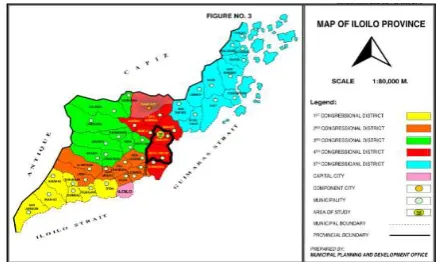
1.2 Study Area
Figure 1. Study area (Source: Anilao Municipal Planning and Development Office)
4th class municipality, is composed of 21 barangays with a total area of 7,538 hectares and a population of 28,684 as of 2015 census. On the other hand, Barotac Nuevo, a 2nd class municipality, has 29 barangays, a total land area of 9,449 hectares with a population of 54,146 (Provincial Government of Iloilo, 2017). The province highly depends on agriculture and aquaculture production. Rice, corn, fruit vegetables, banana, and pineapple being their crop products while bangus, mudcrab, prawn, tilapia, catfish, oyster, and seaweeds their aquaculture harvests(Provincial Government of Iloilo, 2017).
1.3 Objectives
This research aims to generate 3D visualizations of mangrove to aquaculture conversion and vice versa using Google Earth, ArcScene, Virtual Terrain Project (VTP), and Terragen platforms; Specifically, this paper intends to determine mangrove and aquaculture conversion in Anilao and Barotac Nuevo, Iloilo from 1973 to 2016 using Landsat images and assess the usability, effectiveness, and potential of various platforms used in the visualization through the conduct of a perception survey.
1.4 Scope and Limitations
This study is limited only to using Landsat images acquired for the years 1973, 1976, 2000, 2006, 2010, and 2016 Landsat images for the classification. This inconsistent temporal dataset is due to the very persistent cloud cover in the area. The trial version for the Terragen platform is used for the model generation; hence, limitations in the software functionality hindered the production of visualization outputs. Also, the 3D objects used were built-in models from the different platforms resulting to distinct appearances of each scenario. Google Earth is considered as a visualization platform in 3D despite it having only 2.5D terrain information and 2D KML files, since it enables users to navigate through an area using 3D views and perspectives. Also, the visualization scenario provided by Google Earth provided a baseline for the users in their
The summary of the Landsat scenes used along with their dates of acquisition and the images prior to processing is shown in Table 3. The 1973, 1976, and 2000 images were downloaded from Earth Explorer while the 2006, 2010, and 2016 images from the USGS Global Visualization Viewer.
Date Description SWIR 2, Panchromatic, Cirrus, Thermal Infrared 1, and Thermal Infrared 2)
Table 1. Summary of Landsat images acquired
The Digital Elevation Model (DEM) used for the 3D models sets, often producing higher accuracy than traditional methods (Mantero et. al., 2005).
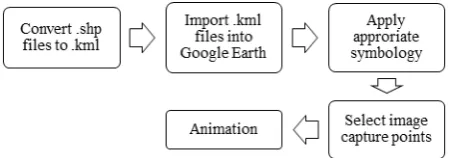
Figure 3. Detailed methodology for image processing
2.4 3D Visualization
2.4.1 Google Earth
The researchers selected Google Earth as one of the platforms for visualization since it is commonly used from geomatics practitioners to end-product users, due to its accessibility and affordability. This kind of visualization works by draping the classified images over the surface in Google Earth. It can be done through following steps described in Figure 4.
Figure 4. Methodology for Google Earth
2.4.2 ArcScene
ArcScene was also chosen as one of the platforms for visualization because of its spatial analysis capabilities. It is one of the platforms imbedded in a GIS software, ArcGIS. With this, handling of data sets became very easy and just needed a few adjustments to create a 3D scene. However, ArcScene is a proprietary software which requires a license to operate.
Figure 5. Methodology for ArcScene
To create a 3D visualization using ArcScene, mangrove, non-mangrove, and built-up shapefiles were first converted from polygon into points. Create Random Points tool was used multiple times to perform the conversion. These points were now imported to ArcScene together with the other features such as digital elevation model (DEM), fishpond boundaries, roads, and river. For each feature, appropriate symbology and base heights were applied.
After assigning these symbologies and base heights, attribute tables were edited. Start time and end time attributes were added for all features. This was utilized for the animation of the scenes. Then, scenes were rendered to come up with 30-second videos showing the conversions happened from 1973 to 2016. Four (4) 30-second videos were rendered and compiled into Windows Movie Maker for the final animation output.
2.4.3 Virtual Terrain Project (VTP)
Unlike ArcScene, VTP has no direct spatial analysis capabilities and is a free software. However, vector files such as .shp can be read by VTBuilder which is the pre-processing unit of VTP. Then conversions of these .shp files were first needed in order to view them into the Enviro, the viewer of VTP, in 3D. These files, in compatible formats, are needed to be saved in the specific folders generated by VTP upon installing the software.
Figure 6. Methodology for VTP
For the pre-processing stage, the DEM in .tiff format was converted to .bt format through VTBuilder and saved in Elevation folder. Shapefiles of trees and vegetation were imported to VTBuilder. Using Generate Vegetation tool, trees and grass were created as points within the bounds of the shapefiles. Podocarpus sp. model was used for mangrove trees, Araucaria heterophylla model for non-mangrove trees, and Pennisetum setaceum model for vegetation. Then, they were exported as .vf files and saved into the PlantData folder. Shapefiles of built-up (the ones used in ArcScene) were imported as structures. These were exported in .vtst format and saved in BuildingData folder. Lastly, the road was converted to .rmf format and saved into RoadData folder.
After all conversion, the parameters were now set into the Enviro. In addition, scenes were created to portray features that are visible per year. In order to render the specific scenes, camera angles were first selected. Images were captured and animated using Windows Movie Maker.
2.4.4 Terragen
The last platform that was used is Terragen. It has totally no support for spatial analysis and no database access since it does not support vector files. Also, it is not a free software however, there is a free trial version available. Terragen is commonly used in movies and is a great animator. Comparing all four (4) platforms, Terragen provides the most realistic and most aesthetically pleasing objects and scenes.
Figure 7. Methodology for Terragen
Since the researchers only used the free trial version, only three (3) objects at a time was allowed. Thus, it was decided to concentrate on the dynamics of mangroves and camera position were initially selected. Also, the fact that Terragen has no support for spatial analysis, importing shapefiles is not possible. The researchers needed to rasterize the mangrove shapefiles first. Then, rasterized files were then reclassified to have a 100 value for the specific target feature and 0 value for all other features.
2.5 3D Animation Assessment
In order to assess the visualizations made, a perception survey was done. After the design of survey instrument, the researchers selected respondents with different levels of expertise in spatial analysis, 3D visualization, and forestry, fisheries, and aquatic resources. Content of the questionnaire include rating of the different platforms used divided into three categories – technology and purpose, interaction and navigation, and information content.
Figure 8. Methodology for 3D animation assessment
During the actual perception survey, the final video outputs generated from the 4 platforms were viewed by the respondents. Also, respondents were able to explore the platforms used on their own. A survey form was prepared to investigate the effectiveness of the platforms using various indicators. Inputs from the development of the visualizations were tabulated, together with the effectiveness ratings, to assess usability and potential.
3. RESULTS AND DISCUSSION
3.1 Image Processing
3.1.1 Land Cover Maps
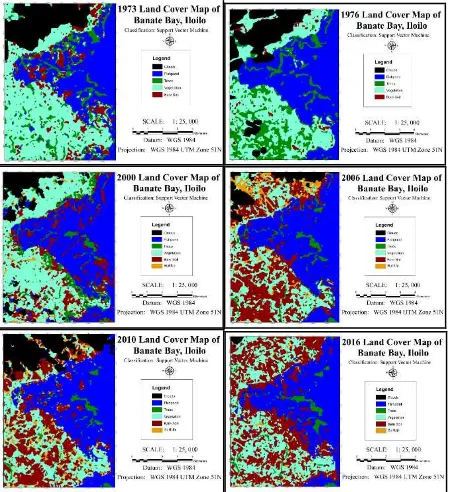
For the 1973 and 1976 images, there are only five (5) classes created because of the difficulty of differentiating built up and bare soil classes given the spatial resolution of the early Landsat images. Using ArcMap, land cover maps from the SVMs classification were created and are presented in Figure 9.
Figure 9. Land classification maps produced using SVMs (L-R: 1973, 1976, 2000, 2006, 2010, 2016)
3.1.2 Mangrove and Aquaculture Cover Change
Confusion matrices for the ground truth ROIs were created for a pixel-based accuracy assessment. It should be noted that the 100% overall accuracy for the 1973 image was due to the limitations of the data. Classification was relatively simpler than the other images mainly because there were only four (4) classes in the image and they are spectrally separable even though there were only four (4) bands in the image. In addition, the vegetation and the bare soil classes exhibit a very obvious distinction.
All images have attained acceptable values for overall accuracy and kappa coefficient, and the values are summarized in Table 2.
Year Overall Accuracy (%) Kappa Coeff.
1973 100.0000 1.0000
1976 81.6901 0.7550
2000 95.6989 0.9642
2006 91.5385 0.8942
2010 94.4079 0.9300
2016 96.2617 0.9531
Table 2. Overall accuracy and kappa coefficient for the classified images
Figure 10 summarizes the changes mangrove and aquaculture areas in the area from 1973 to 2016. Change detection analysis shows that the largest negative change in mangrove area happened from 2006 to 2010 with an annual rate of -8.56%, assuming a linear rate, parallel to a decrease of -1.21% annually in the same years. This is due to fishpond pixels classified as bare soil because of the draining of water for chemical removal. The highest increase in fishpond area occurred in 1973 to 1976 with an annual rate of 6.14%.
Figure 10. Change in mangrove and aquaculture area from 1973 to 2016
3.2 3D Visualization
Figure 11. 3D visualizations generated from four (4) platforms: Google Earth (Upper left), ArcScene (Upper right), VTP
(Lower left), Terragen (Lower right)
From these outputs, a perception survey was performed to assess the usability, effectiveness, and potential each platform in generating visualizations.
3.3 3D Animation Assessment
For the assessment, perception survey was done. There were 30 respondents which were categorized based on their perceived levels of expertise in spatial analysis, 3D visualization, and forestry/fishery/aquatic resources.
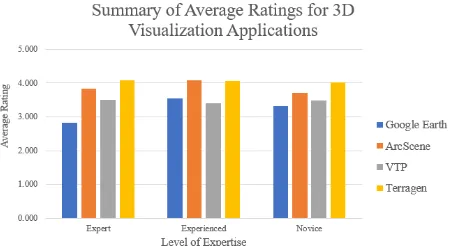
First is by categorizing the respondents based on their level of expertise in spatial analysis. The summary of the results of the survey is summarized in Figure 12. (TP – Technology and Purpose, IN – Interaction and Navigation, and IC – Information Content)
Figure 12. Average rating categorized by expertise in spatial analysis
As shown in the graph, Google Earth gave the least amount of information and the experts prefer ArcScene for visualizations focusing on spatial analysis. Re-categorizing the respondents, now based on their level of expertise in 3D visualization, the summary of the results of the survey is summarized in Figure 13.
Figure 13. Average rating categorized by expertise in 3D visualization
The same trend can be observed in which the information relayed by Google Earth and Terragen is the preferred visualization of 3D visualization experts. Finally, re-grouping the respondents according to their level of expertise in forestry, fishery, and aquatic resources, the summary of the results of the survey is summarized in Figure 14.
Figure 14. Average rating for forestry, fishery, and aquatic resources
For this application, Terragen is the preferred platform for 3D visualization involving forestry, fishery, and aquatic resources.
To assess the effectivity of the visualizations, the results of the perception survey were analyzed. The summary of the results of the perception survey for spatial analysis applications is presented in Figure15.
Figure 15. Effectiveness assessment for spatial analysis discipline
Based on the graph, the effective platform for the spatial analysis experts is ArcScene, Terragen for those with experience and the novices.
For the 3D visualization experts and novices, Terragen is the most preferred while those with experience rated almost the same for ArcScene and Terragen.
Figure 17. Effectiveness assessment for forestry, fishery, and aquatic resources discipline
From the forestry, fishery, and aquatic resources discipline, Terragen is the most effective platform for experts and the novices while ArcScene is the most effective platform for those with experience in this type of applications.
Aside from the actual perception survey, the researchers, as the developers of the visualization, also rated the different platforms to assess its usability.
To compare processing time among the platforms, a single machine was used by a single user in producing all visualization scenarios. A Windows 10 PC running on an Intel i5-4210U 1.70 GHz processor, with a 4GB memory and 2GB
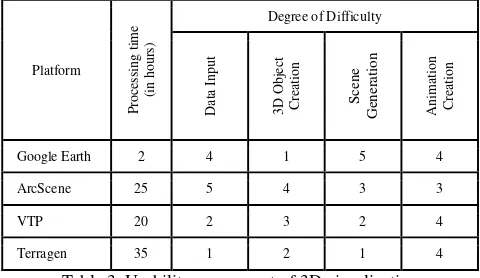
Table 3. Usability assessment of 3D visualization
From Table 3, Google Earth was identified as the easiest and fastest platform to use. However, it has very poor performance on generating 3D objects. ArcScene was rated 5 for pre-processing since almost no pre-pre-processing step was needed in order for ArcScene to read the input files. On the other hand, it took 20 hours to generate the 3D visualization using VTP. Though generally, it is difficult to produce, handling of the software was made easy since not all data were processed into only one software. All files were prepared using VTBuilder and 3D scenes were viewed with Enviro.
Lastly, visualization from Terragen was the most difficult to produce. It took the researchers 35 hours to generate the final output. There were many conversions that happened and generating 3D objects was done manually. Also, rendering of scenes were slow averaging 10 minutes per image.
The researchers then combined the usability and effectiveness of the various platforms in order to get their individual potential for different applications.
Table 4. Potential ratings for visualization of the four (4) platforms
Google Earth rated good for spatial analysis and forestry, fishery, and aquatic resources applications. However, it rated poor for 3D visualization. As expected, ArcScene rated very good for spatial analysis but good only for 3D visualization and forestry, fishery, and aquatic resources applications. Virtual Terrain Project rated good for all kinds of applications. Lastly, Terragen rated very good for 3D visualization and for forestry, fishery and aquatic resources applications. However, since Terragen has no spatial analysis support, it only rated good for spatial analysis applications. the results of the Support Vector Machine (SVM) Classification of Landsat images. From the results of the classification, it was observed that the largest negative change of mangrove areas happened from 2006 to 2010, with an annual rate of -8.56% On the other hand, the largest positive change for aquaculture area happened from 1973 to 1976 with a rate of 6.14% annually. For the 3D visualization, the results of the perception survey showed that ArcScene is preferred for spatial analysis while respondents favored Terragen for 3D visualization and for forestry, fishery, and aquatic resources applications, thereby concluding that people with different levels of expertise prefer different visualization platforms depending on their discipline.
ACKNOWLEDGEMENTS
This study would not be possible without the funding of the Department of Science and Technology (DOST), through its monitoring agency, the DOST-Philippine Council for Industry, Energy, and Emerging Technology Research and Development (DOST-PCIEERD).
The researchers would also like to acknowledge the following people and institutions for their significant contributions and participation to make this research possible. Without them, this study cannot be fulfilled within the given timeframe.
Special thanks to Dr. Ariel Blanco, local government of Anilao, Iloilo, especially to Ms. Emee Grace Miatapal, National Mapping and Resource Information Authority, Bureau of Fisheries and Aquatic Resources, and Dr. Rene Rollon of UP Institute of Environmental Science and Meteorology for providing us with necessary information and data for this study.
REFERENCES
ArcGIS for Desktop, 2016. Working with ArcGlobe and
ArcScene. Retrieved from http://desktop.
arcgis.com/en/arcmap/10.3/main/get-started/choosing-the-3d-display-environment.htm.
Bailey, J.E., Whitmeyer, S.J. and D.G. De Paor., 2012. Introduction: The application of Google Geo Tools to geoscience education and research. The Geological Society of America.
Brown, W.H. and A.F. Fischer, 1918. Philippine mangrove swamps. Department of Agriculture and Natural Resources. Bureau of Fishery Bulletin No.7.
Canada Centre for Remote Sensing., 2011. Fundamentals of Remote Sensing. pp.147 – 148.
Cartwright, W., S. Miller, and C. Pettit. "Geographical Visualization: Past, Present and Future Development." Journal of Spatial Science 49.1 (2004): 25-36. Web.
CivilFX, 2016. Top 10 Benefits of 3D Visualization. Retrieved from http://www.civilfx.com/benefits-3d-architectural-visualization/
Clasen, M. and H. C. Hege., 2005. Realistic Illumination of Vegetation in Real-Time Environments. Trends in Real-time Visualization and Participation, New Technologies for Landscape Architecture and Environmental Planning.
Daupan, S., 2016. Community Participation in Mangrove Forest Management in the Philippines: Management Strategies, Influences to Participation, and Socio-Economic and Environmental Impacts. PhD Dissertation, University of Michigan.
Ding, S. and Chen, L., 2010. Intelligent Optimization Methods for High - Dimensional Data Classification for Support Vector Machines. Intelligent Information Management. Wuhan, China
Duric U., Abolmasov, B., Pavlovic, R. and B. Trivic., 2011. Using ArcGIS for Landslide “Umka” 3D Visualization. The
Geology in Digital Age: 17th Meeting of the Association of European Geological Societies.
Fortes, M., 2004. National report on seagrass in the South China Sea - Philippines. Reversing environmental degradation trends in the South China Sea and Gulf of Thailand. UNEP/GEF South China Sea Project.
Garcia, K., Gevana, D., & Malabrigo, P., 2013, November. Philippines' Mangrove Ecosystem: Status, Threats, and Conservation. Mangrove Ecosystems of Asia.
Geman, S., Bienenstock, E., Doursat, R., 1992. Neutral networks and the bias/variance dilemma. Neural Computation 4 (1), 1 - 58.
Green, J., 2016. What Is 3D Visualization, Who Does It & Why
Do You Need It? Retrieved from
https://www.upwork.com/hiring/design/what-is-3d-visualization-who-does-it-why-do-you-need-it.
Guyon, I., Vapnik, V., Boser, B., Solla, S.A., 1992. Capacity control in linear classifiers for pattern recognition. In: First IAPR International Conference on Pattern Recognition. IEEE Computer Society Press, pp. 385-388.
Iloilo Provincial Government, 2017. Quick Facts. Retrieved from www.iloilo.gov.ph: http://www.iloilo.gov.ph/quick-facts
Lange, E., 2005. Issues and Questions for Research in Communicating with the Public through Visualizations. Distance Learning Administration Conference Proceedings.
Laurini, R., 2017. Geographic Knowledge Infrastructure: Applications to Territorial Intelligence and Smart Cities. ISTE Press.
Liu, X. and S. Shiotani., 2015. A virtual globe-based visualization and interactive framework for a small craft navigation assistance system in the near sea. Journal of Traffic and Transportation Engineering.
Malinverni, E.S., 2007. 3D Geoexploration of the Prealpi Giulie Nature Park. International Archives of Photogrammetry and Remote Sensing Volume XXXVI-4/W45, 2007.
Mantero, P., Moser, G., Serpico, S.B., 2005. Partially supervised classification of remote sensing images through SVM - based probability density estimation. IEEE Transactions on Geoscience and Remote Sensing 43 (3), 559-570.
Mei, G., Tipper, J. and N. Xu., 2013) 3D Geological Modeling and Visualization of Rock Masses Based on Google Earth: A Case Study. Cornell University Library. Retrieved from https://arxiv.org/abs/1301.3455.
Melana, E.E. and H.I. Gonzales., 1996. Field guide to the identification of some mangrove plant species in the Philippines. Ecosystems Research and Development Service, Department of Environment and Natural Resources Region 7, Banilad, Mandaue, Cebu City, Philippines. 29 p. + 8 p. appendices.
Montgomery, D.C., Peck, E.A., 1992. Introduction to Linear Regression Analysis, 2nd ed. Wiley, New York.
Mountrakis, G., Im, J., and Ogole, C., 2010. Support vector machines in remote sensing: A review. ISPRS Journal of Photogrammetry and Remote Sensing. New York, USA.
Planetside Software, 2016. Terragen in Film & TV. Retrieved from https://planetside.co.uk/terragen-in-film-and-tv/#.
Planetside Software, 2016. What is Terragen. Retrieved from http://planetside.co.uk/terragen-overview.
Primavera, J., & Esteban, J.M.A., 2008. A review of mangrove rehabilitation in the Philippines: successes, failures and future prospects. Wetlands Ecology and Management 16 (3): 173-253.
Primavera, J.H., Rollon R.N. & Samson M.S., 2011) The Pressing Challenges of Mangrove Rehabilitation: Pond Reversion and Coastal Protection.
Samson, M. S., & Rollon, R. N., 2008. Retrieved from Growth Performance of planted mangrove in the Philippines: revisiting forest management strategies. Ambio 37(4):234-240.
Schroth, O., 2010. From Information to Participation: Interactive Landscape Visualization as a Tool for Collaborative Planning. Bibliografische Information der Deutschen Nationalbibliothek.
Tupas, M.E., 2012. Sedimentation and land cover change modeling of Magat dam watershed area using remote sensing, geographic information system and cellular Automata-Markov analysis. MS Thesis, University of the Philippines – Diliman.
Turner, A.K., 1989. Three-Dimensional Modeling with Geoscientific Information Systems. Kluwer Academic Publishers.
VTP, 2017. Virtual Terrain Project. Retrieved from http://vterrain.org.
Warren-Kretzschmar, B. and S. Tiedtke. What Role Does Visualization Play in Communication with Citizens? – A Field Study from the Interactive Landscape Plan. In Trends in Real-Time Landscape Visualization and Participation, edited by E. Buhmann, 156–167. Heidelberg: Herbert Wichmann Verlag.