CARBON MANAGEMENT PROGRAM IN PAPUA REGION
(Program Pengelolaan Karbon di Region Papua)
Hendri1
1Faculty of Forestry in the State University of Papua Jl. Gunung Salju Amban,
Manokwari-Papua Barat
E-mail:[email protected]
Received September 8, 2014|Accepted June 3, 2015 Abstract
Indonesia is one of the countries with the largest tropical rainforest area, especially in Papua Island together with Papua New Guinea accounted the third largest tropical rainforests in the world, after the Amazon (336.7 million ha) and Congo (181.3 million ha). The total tropical rainforest area is 68.7 million ha contained Papua about 57% (39.2 million ha) and 43% (29.5 million ha) Papua New Guinea. Unfortunately, deforestation rates in the few decades increased from 1.39 million ha in the period 1985 – 1997 and 0.6 million ha in the period 2000 – 2005. The direct impact of rapid LULUCF (Land Use, Land Use Change & Forestry) changes since 1980`s has accumulated critical land by 29.0% of forest area in West Papua and 31.4% of forest area in Papua. Climate change affected in Papua region due to rapid amount GHG`s emissions into the atmosphere by increasing average temperature about 0.7oC, minimum temperature
(0.7oC) and maximum temperature (1.2oC) during period 1996 – 2005. Other effects of climate
change the decreased rainfall up to 26% per month in the last decade, 50% reduced total agriculture productivity, expanded malaria diseases, and increased extreme condition such as drought with intensity of forest fire detected in Sorong due to inter-annual climate variability events, such as the El-Niño event and flood due to the La-Niña event. However, it is difficult task to build mitigation and adaptation planning in the region or local scale due to the lack information, the lack human resources, and local topography and phenomena. In that case, so far, no study has been conducted in Papua region to build mitigation and adaptation planning for carbon management. Therefore, this study tries to promote a carbon management program for help local government to solve forest environmental problems consideration of climate change. Keywords: Climate Change, Mitigation and Adapasi, Carbon Mangement, Sorong-Papua Region
Abstrak
Indonesia merupakan salah satu negara dengan luas hutan hujan tropis terbesar, terutama di Pulau Papua bersama dengan Papua Nugini menyumbang hutan hujan tropis terbesar ketiga di dunia, setelah Amazon (336.700.000 ha) dan Kongo (181.300.000 ha). Luas total hutan hujan tropis adalah 68.700.000 ha yang terdapat Papua sekitar 57% (39.200.000 ha) dan 43% (29,5 juta ha) Papua Nugini. Sayangnya, laju deforestasi dalam beberapa dekade juga meningkat dari 1,39 juta ha pada periode 1985-1997 dan 0,6 juta ha pada periode 2000 - 2005. Dampak langsung dari perubahan LULUCF yang cepat sejak tahun 1980-an telah mengakibatkan lahan kritis yaitu 29,0% dari luas hutan di Papua Barat dan 31,4% dari kawasan hutan di Papua. Perubahan iklim di wilayah Papua juga dipengaruhi karena bertambahnya jumlah emisi GRK ke atmosfer dengan meningkatkan suhu rata-rata sekitar0,9oC, suhu minimum (0,7oC) dan suhu
maksimum (1,2oC) selama periode 1996-2005. Efek lain dari perubahan iklim yaitu
menurunnya curah hujan hingga 26% per bulan dalam satu dekade terakhir, penurunan 50% produktivitas pertanian total, penyebaran penyakit malaria, dan peningkatan kondisi ekstrim seperti kekeringan dengan intensitas kebakaran hutan yang terdeteksi di Sorong karena peristiwa variabilitas iklim antar-tahunan, akibat dampak El Niño dan banjir akibat peristiwa La Niña. Sejauh ini belum ada penelitian yang dilakukan di wilayah Papua untuk membangun perencanaan mitigasi dan adaptasi untuk pengelolaan karbon. Jadi, penelitian ini mencoba untuk
mempromosikan program pengelolaan karbon untuk membantu pemerintah daerah dalam mengatasi masalah kerusakan lingkungan hutan dan perubahan iklim.
Kata kunci: Perubahan Iklim, Adaptasi dan Mitigasi, Penelolaan Karbon, Region Sorong-Papua INTRODUCTION
Tropical rainforests play the important role as `eco-utilities` providing critical ecosystem services such as food (medicine), energy, water and climate security at global to regional and local scales. The other ecosystem services, such as religious, recreation and cultural heritage, biodiversity, hydrology, soil formation, nutrient cycling and primary production were mentioned by Millennium Ecosystem Assessment (2005) to practice sustainable forest management focusing the integration of ecological, social, and economic values for local communities who lived around the forest area. However, the ecosystem services are still hardly integrated into “national and local planning processes” aimed at addressing of the development challenges such as poverty alleviation, food security and recently issue for climate change responses, especially in developing countries. This is evident in the First and Second National Communication report of some developing countries to the United Nations Framework Convention on Climate Change (UNFCC).
The National Communication reports shown to very rapidly decrease of the tropical rainforest area due to deforestation that is cleared and permanently converted to another land use by anthropogenic and natural activities such as agriculture, estate, resettlement, expansion of industrial logging, plantation, infrastructure, pasture, shifting cultivation and forest fire (Sunderlin, 1999; Barr, 2000; IPCC, 2007). The lack of uniform definitions and the different methods, it is difficult to have reliable data on actual rates of deforestation. The annual deforestation rates were started during the 1970`s and 1980`s, estimation ranging from 6.1 to 14.2 million hectares (Grainger, 1993) and increased around 16 million hectares per year during the 1990s and the 2000`s (FAO, 1996). The latest estimated net loss of tropical rainforests in developing countries
during the past decade, 2000 – 2010 was 13.0 million (FAO, 2010) hectares per year. The deforestation rate at the average rate of 8.0 – 15.0 million hectares per year of tropical rainforests accounts for around 1.5 Gt C, equivalent to 17.0% of global carbon dioxide emissions (IAP, 2009) that would be released into the atmosphere in potentially dangerous positive feedback accelerating climate change. For undisturbed tropical rainforest area, the various carbon pools (plant biomass included aboveground biomass and belowground biomass, under-storey biomass, necromass, litter and soil) (Righelato and Spraklen, 2007) provide a natural carbon capture and storage function that sequestrated about 1.3 Gt C, equivalent to 15.0% of global carbon dioxide emissions annually.
Based on the Indonesian Second National Communication Report under the United Nations Framework Convention on Climate Change (UNFCCC), GHG’s emission inventory in 2009 from Land Use, Land Use Change and Forestry (LULUCF, IPCC (2007)) gave the main contribution up to 58% of the total emission of 1,244 Mt CO2. Therefore, the emission reduction
from the forestry sector has become a priority target of the Ministry of Forestry, Republic of Indonesia (MoF, RI).
However, it is difficult task to build mitigation and adaptation planning in the region or local scale, especially in Papua due to the lack information, the lack human resources, local topography and phenomena, the limited data, and the lack of methodologies to account source and sink of carbon. Therefore, this study presents some outcomes to build mitigation and adaptation planning for carbon management to solve forest environmental problems consideration of climate change in the local level.
Land Use, Land Use Change and Forestry (LULUCF) Contribution for Global CO2Emission
LULUCF is defined by IPCC term as a greenhouse gases (GHG`s) inventory from forestry sector that covers emissions and removals of GHG`s resulting from direct human-induced land use, land use change and forest activities such as forest deforestation and degradation. LULUCF contributed over 17.4% of the global CO2
equivalent emission from anthropogenic sources in 1990 and 2004 (IPCC 2007). The source emissions in LULUCF is the third largest contribution to the global GHG`s emissions, after the energy sector (25.9%) and industry (19.4%). However, LULUCF is a major contribution CO2 equivalent
emissions in developing countries such as Indonesia (58%) based on the Second National Communication report (MoE, 2009). In addition, the forestry sector has great potential in mitigating Climate Change.
Climate change can be identified from the change of average climate pattern, inter-annual climate variability and the distribution of extreme events such as storms, floods and droughts (IPCC, 2007). While, the increase of average temperature is the most easily recognized forms of climate change. The total temperature has increased by 0.76oC in the last century
(from 1850-1899 to 2001-2005) and estimated to continue increasing over this century, approximately 1.8oC to 4.0oC
(GEO-4, 2007; IPCC, 2007). The increase of average temperature is caused by greenhouse effect which thermal radiation increase from a planetary surface is absorbed by the increase of GHG`s emissions and is re-radiated to the surface. It means the thermal radiation cannot pass through the atmosphere and as a result temperature near surface become increasing that called global warming. Among the greenhouse gases, Carbon Dioxide is considered as the main contributor to the greenhouse effect compared to the other gases such as Halogen-Containing Gases, Methane and Nitrous Oxide (IPCC, 2007) with considering the global warming potential (GWP) as radiative forcing and
lifetime near 100 years for the time required to restore equilibrium that may be lost or deposited to sinks such as vegetation or other biological systems, soil, ocean and water bodies in the surface. Generally, CO2
equivalent is used to account the GHG`s emissions considering non-CO2 emissions
in LULUCF sector.
Inventory development of LULUCF becomes the main focus to estimate carbon stocks and GHG`s emissions under IPCC guidelines and Kyoto Protocol. Therefore, UNFCC invited the Intergovernmental Panel on Climate Change (IPCC) to develop Good Practice Guidance (GPG) for LULUCF. GPG LULUCF is prepared to elaborate methods, assessment of uncertainties, measure, monitor, report, definition of LULUCF included terms of deforestation and degradation, and practicable methodologies for local communities. In this case, GPG LULUCF will use to account CO2 emissions from
forest fire in Asia and the Pacific region. Papua Forest Environmental Problems
Indonesia is one of the countries with the largest tropical rainforest area, especially in Papua Island together with Papua New Guinea accounted the third largest tropical rainforests in the world, after the Amazon forest (336.7 million ha) and the Congo forest (181.3 million ha). The total tropical rainforest area is 68.7 million ha contained Papua about 57% (39.2 million ha) and 43% (29.5 million ha) Papua New Guinea. Unfortunately, deforestation rates in the few decades are also increased from 1.39 million ha in the period 1985 – 1997 and 0.6 million ha in the period 2000 – 2005. There is evidence that the increase of deforestation and degradation caused by increment consensus area from timber companies starting 3.7 million ha (1991) to 10.7 million ha (2007) in Figure 1 and also acceleration of oil palm plantation up to 2.3 million ha (2007). The other factors such as mining companies like PT Freeport (copper), BP Tangguh (oil) and others (charcoal, bauxite, lime, gold, silver) are estimated to contribute deforestation and degradation in Papua region. The direct impact of rapid LULUCF changes since
1980`s has accumulated critical land by 29.0% from forest area in West Papua and 31.4% from forest area in Papua (MoF, 2007).
Climate change is also affected in Papua region due to rapid amount GHG`s emissions into the atmosphere by increasing average temperature about 0.7oC, minimum
temperature (0.7oC) and maximum temperature (1.2oC) during period
1996-2005 (BMKG Manokwari, 2006). Another effects of climate change are decreased rainfall up to 26% per month in the last decade, 50% reduced total agriculture productivity (Manokwari Assessment Institute for Agricultural Technology, 2009), expanded malaria diseases, and increased extreme condition such as drought with intense of forest fire detected in Sorong due to inter-annual climate variability events, such as El-Niño event (Kiyono and Hastaniah, 2000; Cochrane, 2003) and flood due to La-Niña event (IRI, 2011).
Figure 1. Consensus area of timber companies in Papua
Thus, international scheme like Post-Kyoto Protocol, Reduction Emission from Deforestation and Degradation (REDD), and the other international scheme is needed to mitigate LULUCF activities and GHG`s emissions by payments for environmental services (PES) as compensation carbon price through reforestation (replanting in forest area) and afforestation (replanting in non-forest area) activities together capacity building to develop local communities and local carbon management planning.
The other strategic issues related to forest environmental problems are described in the below,
1. Development plans
It was still from Top to Down planning that it means from National to Local level without considering the data and information in the execution development program.
2. New autonomy city or region
The central government should be given an extra decision to allow the new autonomy Regency/ City, especially in Papua region to convert the forest area to the other land use activities.
3. Conservation city or region
The local and central government need to support legal policy for developing conservation city, especially in Papua region like Tambrauw, Raja Ampat and Teluk Wondama Regency.
4. Low contribution to sustainable forest management
The forest concession companies were only focusing for maximum benefit without considering technical issues related to sustainable forest management.
5. Lack of involvement of local community
The national and local development plans were rarely considered a benefit to the local communities. Therefore, the development program is low participation.
6. Lack of spatial planning
Papua region is still a lack of spatial planning in the regency/ city level. Thus, the data and information is not correctly to develop pattern and structure of spatial planning between the province and regency/city and overlapping forest and non-forest area. 7. Lack of forest management unit (KPH)
The Papua region needs to develop KPH for reducing conflict with participatory mapping of all stakeholders.
8. Investment licensing policy
One door policy is to reduce transaction cost and conflict of authority and sectoral ego in terms of natural resources management.
9. Log timber sale policy
To implement log export ban policy of out Papua (Pergub No 28 Tahun 2008)
for increasing utilization of the local timber industry and added value. Mitigation and Adaptation Tools to Assess Environmental Problems
To reduce the consequences of climate change, IPCC promotes two-pronged approach toward dealing with global warming; mitigation and adaptation. Mitigation is action to reduce greenhouse gases (GHGs) emission from the potential sector to support global warming. Adaptation refers to the ability of the system to adjust to climate change included variability and extreme weather conditions.
REDD scheme choices to mitigate GHG`s emissions from LULUCF activities considering National Action Plan (NAP) for climate change mitigation. This scheme is used after Bali Action Plan as a result of the Conference of the Parties (COP) 13 in Bali, Indonesia to find new mechanisms after Kyoto Protocol matures in 2012. In Kyoto Protocol through Clean Development Mechanism (CDM) scheme for developing countries, Indonesia is not fully achieve to register LULUCF sector caused by limitation data and the difficulties of methodologies. Otherwise, REDD is set more easily for farmer, companies and forest owners to sell forest carbon credits. Another reason, REDD is not only consider for deforestation, but also included forest degradation to enhance forest carbon stock, also referred to as forest regeneration and rehabilitation, negative degradation, negative emissions, carbon uptake, carbon removal or just removals that refers to sequestration of carbon from the atmosphere and storage in forest carbon pools (CIFOR, 2009).
From CDM supplier, India, China and Brazil are responsible about 63% of total volume for all projects in 2005 and changed the dominant composition to China (62%) and Indonesia (10%) in 2007 with carbon market ranging from€3 – 14/ t CO2
equiv. (Point Carbon, 2006; 2008). Indonesia CDM is mostly registering for energy sector especially in geothermal and hydropower. In that case, REDD is one solution to apply potential carbon sink from LULUCF activities with shared carbon
market about $10/ tC or less (Sathayeet al., 2005; Greig-Gran, 2006; Kindermannet al., 2006; Sohngen & Beach, 2006; Myers, 2007). The exception is found in Africa and Latin America which could be achieved about $ 183.5/ tC ($ 50.0/ tCO2 equiv.)
(Naucler et al., 2009).
The REDD buyers counted in the Forest Carbon Partnership Facility (FCPF) provide two purpose investment such as (1) to build a REDD capacity building in developing countries and (2) to test a program of performance-based incentive payments in pilot countries to set the stage for a larger system of positive incentives and financing flows in the future. To get opportunity REDD funding, Ministry of Forestry of the Republic of Indonesia through Indonesia Forest Climate Alliance (IFCA) is committed to piloting REDD, to build a national framework for long time implementation and to inform outstanding methodological issues. The stages process included an analysis of baseline data on carbon stocks in LULUCF sector, priorities for the key drivers of deforestation and degradation, the mechanisms of the carbon markets and managing REDD payments and the current legal and policy framework.
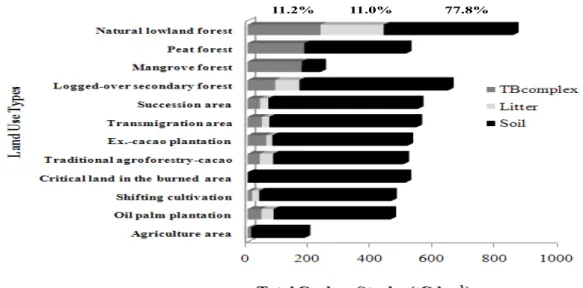
To set up baseline data on carbon stock in Papua, the complex land-use type of total carbon stock (Hendri et al., 2011) present in Figure 2. The maximum carbon stock of mineral soil in the natural lowland forest is 851.5 tC ha-1. While for the other
area, the carbon contents are 642.9 tC ha-1
in the logged-over secondary forest, 546.4 tC ha-1in the succession area, 541.8 tC ha-1
in the transmigration area, 512.7 tC ha-1 in
the ex. -cacao plantation, 500.2 tC ha-1 in
the traditional agroforestry-cacao, 490.3 tC ha-1 in the critical land of burned area, 458.1 tC ha-1 in the oil palm plantation,
460.4 tC ha-1 in the shifting cultivation, and 183.1 tC ha-1 in the paddy field area. The
total carbon content of organic matter soil in the natural mangrove forest is 233.6 tC ha-1 and 508.0 tC ha-1 in the natural peat forest.
77.8% 11.0%
11.2%
Figure 2. Total carbon stock from the various land-use type. Papua Carbon Management Program
To solve forest environmental problems and the other related issues, the low carbon program from Hiroshima University will introduce to mitigate and to adapt of climate change in Papua region as a carbon management program. The programs contain five areas of study as their major, i.e.:
URBAN SYSTEM DESIGN (USD)
KEYWORDS: sustainable compact city, behaviour modeling, urban planning
The USD group educates future leaders to be able to design low carbon city systems suitable for the country’s stage of development and to carry out policies to realize these systems, through interdisciplinary research on urban design, architecture, transportation, environment, and energy (Figure 3).
Land-use Ecosystem Air pollution Trans-portation emissionCO2 Socio-economic m p ac tA ss es sm en t M o d el
I
Urban Model Evaluation Model
I
ndicatorsA
siaE
nv.S
imulator Air Quality QOL Ecosystem SCEMPolicy Package
SCEM Indicators Improvement of SCEM based on feedbackPolicy-making based on feedback
WISE USE OF BIOMASS RESOURCES (WUBR)
KEYWORDS: biofuel, resource
management, ecosystem management,
ecologilal planning
The WUBR group educates future leaders to be able to design and carry out regional resource usage plans, through research on sustainable resource usage by means of biomass usage, genetic analysis, and the remote sensing technique (Figure 4).
Bio-ethanol Pellet stove
Pasoh Forest Reserve Logged forest Primary forest Oil palm plantation Rubber plantation
Land use changes 1a. Effect on CO2 absorption
1b. Emission from ecosystem
2. Scaling up technology for biomass monitoring
Flowering Fruiting Germinate Growing Pollinator Disperser Field Survey LiDAR Remote Sensing
3. Development of new energy
Poison injection
Street plant 4. Low carbon technology
Mowing Recyclable
garbage Food scraps
Agro forest Eco City Etc.
Figure 4. Wise-Use of Biomass Resources (HU, 2008)
ENVIRONMENTAL IMPACT
ASSESSMENT (EIA)
KEYWORDS: global and mesoscale
climate simulator, ion chromatography, disaster prevention
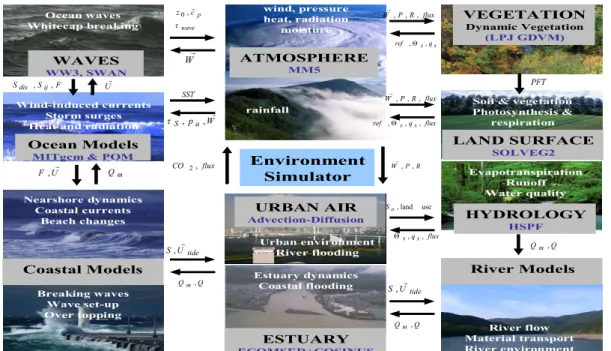
The EIA group educates future leaders to able to conduct environmental impact assessments and also to provide
measures to mitigate the impact through the development and operation of quick-and-easy water quality monitoring systems and numerical simulators, considering the interaction among climatological, oceanological, and hydrological processes (Figure 5). Ecology Dynamic Vegetation Runoff ESTUARY ECOMSED+COSINUS ATMOSPHERE MM5 Environment Simulator Vegetation VEGETATION Dynamic Vegetation (LPJ GDVM) HYDROLOGY HSPF LAND SURFACE SOLVEG2 Ocean Models
MITgcm & POM
WAVES
WW3, SWAN
Coastal Models River Models
URBAN AIR Advection-Diffusion W wave p c z , 0 SST W pa S , , F S Sdis , ij, U U F, Qm flux q ref ,s, s, Q Qm, Q Qm, tide U S, R P W, , flux CO 2, use land , o S flux R P W, , , s s q ref , , Q Qm, tide U S, PFT Ocean waves Whitecap breaking flux R P W, , , flux qs s, , Wind-induced currents Storm surges Heat and radiation
wind, pressure heat, radiation moisture Breaking waves Wave set-up Over topping rainfall Estuary dynamics Coastal flooding Nearshore dynamics Coastal currents Beach changes River flow Material transport River environment Evapotranspiration Runoff Water quality Urban environment River flooding
Soil & vegetation Photosynthesis &
respiration
POLICY AND INSTITUTIONAL DESIGN (PAID)
KEYWORDS: policy analysis tools,
environmental resource approach,
emission trading
The PAID group conducts research and education from the view point of social
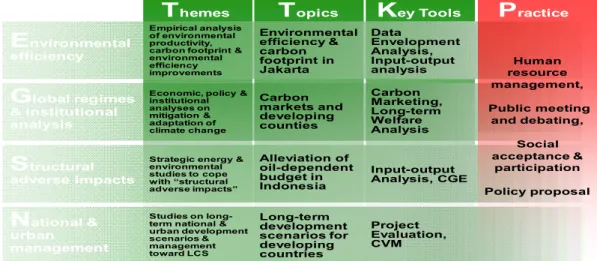
sciences, mainly by means of environmental economics, and develops future leaders to realize a low carbon society as a development process in developing countries and to lead in international negotiations on global climate change issues (Figure 6).
T
hemesT
opicsK
ey ToolsG
lobal regimes & institutional analysisS
tructural adverse impactsN
ational & urban managementE
nvironmental efficiency Empirical analysis of environmental productivity, carbon footprint & environmental efficiency improvements Economic, policy & institutional analyses on mitigation & adaptation of climate changeStrategic energy & environmental studies to cope with “structural adverse impacts”
Studies on long-term national & urban development scenarios & management toward LCS Environmental efficiency & carbon footprint in Jakarta Carbon markets and developing counties Alleviation of oil-dependent budget in Indonesia Long-term development scenarios for developing countries Data Envelopment Analysis, Input-output analysis Carbon Marketing, Long-term Welfare Analysis Input-output Analysis, CGE Project Evaluation, CVM Human resource management, Public meeting and debating, Social acceptance & participation Policy proposal
P
racticeFigure 6. Policy and Institutional Design System (HU, 2008).
DEVELOPMENT OF
ENVIRONMENTAL EDUCATION
(DEE)
KEYWORD: public understanding, basic education, education cooperation
The DEE group educates future leaders to be able to design and carry out
environmental education programs in Asian countries through the development of educational materials to promote environmental education and public awareness of the global environment
(Figure 7).
CONCLUSIONS
International scheme like Post-Kyoto Protocol, Reduction Emission from Deforestation and Degradation (REDD), and the another international scheme is needed to mitigate LULUCF activities and GHG`s emissions.
Carbon management program in Papua acquires the capacity of grasping problems and formulating strategic solutions at the national or local level through interdisciplinary and international perspectives through ability, grasp, analysis, evaluation, communication, and implementation to mitigate and to adapt of climate change.
REFERENCES
Barr, C.2000. A critical assessment of structural adjustment in Indonesia's forest and estate crop industries. CIFOR and WWFInternational, Macroeconomics program office, (manuscript) 52 p.
Bureau of Meteorology and Geophysics (BMG) Manokwari, 2007. Climate Report. Manokwari. 72 pp.
Cochrane M.A., 2003. Fire science for rainforest. Nature, Vol.421, 913-919. FAO, 2006. Global Forest Resources
Assessment 2005: Progress towards sustainable forest management.
Rome, Italy, 147 pp.
FAO:Global Forest Resources Assessment 2010. Rome, Italy, 378 pp.
GEO-4, 2007. Global Environmental
Outlook: Environment for
Development. United Nation Environment Programme, Malta, 572 pp.
Grainger, A., 1993. Controlling Tropical
Deforestation. Earthscan
Publications Ltd., London. 310 p. Greig-Gran, M., 2006. The Cost of
Avoiding Deforestation: Report Prepared for Stern Review of the Economics of Climate Change.
London, International Institute for Environment and Development. Hendri, Yamashita, T. Kuntoro, A.A. and
Lee, H.S., 2012. Degraded Tropical
Logged-over Secondary Forest Carbon Stock Measurements in Manokwari Regency, West Papua. Journal of Forestry Studies in China, Vol.13, No.2.
Hiroshima University, 2008. Global Environmental Leader Education Program for Designing Low Carbon Society.
IAP, 2009. IAP Statement on Tropical Forests and Climate Change. The Academy of Science for Developing Wolrd, 4 pp.
IPCC:Climate Change, 2007. The Physical Science Basic. Contribution of Working Groups I to the Fourth
Assessment Report of the
Intergovernmental Panel on Climate Change. Geneva, Switzerland. 1206 pp.
IPCC, 2007. Couplings Between Changes
in the Climate System and
Biogeochemistry. In: Climate Change 2007: The Physical Science Basis. Contribution of Working Group I to the Fourth Assessment Report of the Intergovernmental
Panel on Climate Change,
Cambridge University Press, Cambridge, United Kingdom and New York, NY, USA.
Kindermann, G.E., Obersteiner, M., Rametsteiner, E., and McCallcum, I., 2007. Predictiong the Deforestation – Trend Under Different Carbon Prices. Social Science Research Network Electronic Paper Collection. Kiyono, Y. and Hastaniah, 2000.
Phenological Observations at Bukit
Soeharto Education Forest.
Ecological Studies: Rainforest Ecosystem of East Borneo, El Nino, Drought, Fire and Human Impact, Springer, 140, 121-128.
Manokwari Assessment Institute for Agricultural Technology, 2009.
Annual Report 2009. Manokwari, Papua Barat. 210 pp.
Millennium Ecosystem Assessment, 2005.
Ecosystems and Human Well-being: Synthesis, Island Press, Washington, DC.
MoE, 2009. Indonesia Second National Communication under the United Nations Framework Convention on Climate Change (UNFCC). Jakarta, 48 pp.
MoF: Statictic of Forestry, Jakarta, 2007. Myers, E.C, 2007. Policies to Reduce
Emissions from Deforestation and Degradation (REDD) in Tropical Forests: An Examination of the issues facing the incorporation of REDD into market-based climate policies. Resources for Future, 83 pp, 2007.
Naucler, T. and Enkvist, P., 2009. Pathways to a low-carbon economy: Version 2 of the global greenhouse gas abatement cost curve. McKinsey and Company.
Point Carbon: Carbon 2006: Towards a Truly Carbon Market. Copenhagen, 60 pp.
Point Carbon: Carbon 2008: Towards a Truly Carbon Market. Copenhagen, 60 pp.
Sathaye, J., Makundi, W., Dale, L., and Chan, P.: GHG Mitigation Potential,
Costs and Benefits in Global Forest: A Dynamic Partial Equilibrium Approach. Lawrence Berkeley National Laboratory 52 pp, 2005. Sohngen, B. and Beach, R.H., 2006.
Avoided Deforestation as a
Greenhouse Gas Mitigation Tool. Economic Issues for Consideration: 40.
Sunderlin, W.D., 1999.Rates and causes of deforestation in Indonesia: Towards a resolution of the ambiguities. CIFOR Occasional Paper No. 9. 19 p.
Yamashita, T., Kim, K., Lee, H.S., and Haggag, M, 2007. Environment Simulator: Contribution to Coastal Engineering Problems (in Japanese), Annual Journal of Coastal Engineering, JSCE, 54, 1301-1305. Yamashita, T., 2011. Regional
Environment Simulator and Its Applications to Environmental Impact Assessment. Presented in ISWREP.