1
Effect of Proportion of Missing Data
on Application of Data Imputation in PMS
by
J. Farhan1, B. H. Setiadji1 and T. F. Fwa2
1Research Fellow and 2Professor
Department of Civil and Environmental Engineering National University of Singapore
10 Kent Ridge Crescent SINGAPORE 119260
Total Number of Words
Number of words in text: = 5221 words
Number of tables: 2 (2 x 250) = 500 words equivalent
Number of figures: 7 (7 x 250) = 1750 words equivalent
---
Total number of words = 7421 words equivalent
Corresponding author: Professor T. F. Fwa Department of Civil and Environmental Engineering National University of Singapore
10 Kent Ridge Crescent SINGAPORE 119260 Email: [email protected]
2 1
Effect of Proportion of Missing Data
2on Application of Data Imputation in PMS
34
J. Farhan, B. H. Setiadji and T. F. Fwa
5 6
7
Abstract 8
9
Missing data are commonly found in pavement condition/performance databases. A common
10
practice today is to apply statistical imputation methods to replace the missing data with
11
imputed values. It is thus important for pavement management decision makers to know the
12
uncertainty and errors involved in the use of datasets with imputed values in their analysis. An
13
equally important information of practical significance is the maximum allowable proportion
14
of missing data (i.e. level of data missingness in the pavement condition/performance records)
15
that will still produce results with acceptable magnitude of error or risk when using imputed
16
data. This paper proposes a procedure for determining such useful information. A numerical
17
example analyzing pavement roughness data is presented to demonstrate the procedure through
18
evaluating the error and reliability characteristics of imputed data. The roughness data of three
19
road sections were obtained from the LTPP database. From these data records, datasets with
20
different proportions of missing data were randomly generated to study the effect of level of
21
data missingness. The analysis shows that the errors of imputed data increased with the level
22
of data missingness, and their magnitudes are significantly affected by the effect of pavement
23
rehabilitation. On the application of data imputation in PMS, the study suggests that at 95%
24
confidence level, 25% of missing data appears to be a reasonable allowable maximum limit for
25
analyzing pavement roughness time series data not involving rehabilitation within the analysis
26
period. When pavement rehabilitation occurs within the analysis period, the maximum
27
proportion of imputed data should be limited to 15%.
3
Effect of Proportion of Missing Data
36
on Application of Data Imputation in PMS
37Engineering analysis and decision making in a pavement management system (PMS) are
data-42
driven processes heavily dependent on the quality and accuracy of the data records.
43
Unfortunately, in practice, the data records in most pavement management systems contain
44
missing data (1-3). Therefore, missing-data management is an important element in the
45
engineering analysis and decision making of a pavement management system. According to
46
an NCHRP Synthesis Report (4), 61% of the pavement agencies in USA included in a survey
47
used software routine to check for missing data.
48 49
Since pavement condition and performance data are time-specific information, re-collection of
50
missing past records through field survey is not possible nor meaningful. Under this situation,
51
the PMS engineer has the option to discard the records with missing data and proceed with the
52
remaining records. This is not always desirable as it means making engineering analysis with
53
a reduced data space, and ignoring some recorded data which could have important
54
implications to pavement maintenance or traffic operations. A procedure which is increasingly
55
being adopted today is to apply suitable data imputation techniques to fill up the incomplete
56
records with imputed values and perform engineering analysis without discarding those records
57
(4-6).
58 59
In the application of data imputation methods to manage missing data records in PMS, one
60
must be aware that the techniques are statistical in nature and uncertainties are involved in the
61
imputed data values. Knowing the likely magnitudes of the errors involved and the reliability
62
of the dataset containing imputed data would allow the engineers to make informed decisions
63
whether to discard the incomplete data records or to proceed with the full set of records made
64
complete with imputed data. Therefore, a relevant issue is to determine the upper limit of the
65
proportion of missing data at which filling up the incomplete data records with imputed data
66
would still provide an accurate representation of the pavement condition. This is the focus of
67
the present research. Using pavement roughness data from the Long-Term Pavement
68
Performance Program (LTPP) database, this study examines how different proportions of
69
missing data would affect the accuracy and reliability of imputed datasets.
70 71
SIGNIFICANCE OF STUDY 72
The theory and principle of statistical quality assurance, in regard to the imputation of missing
73
data, are well developed and has been applied by researchers and practitioners in a number of
74
field of studies, notably in the disciplines of medical studies and social sciences (7-10). The
75
issue of the upper limit threshold for the application of data imputation procedures has also
76
been addressed by researchers in those disciplines. For instance, Schafer (11) suggested using
77
statistical data imputation approaches in medical research only when not more than 5 percent
78
data is missing. On the other hand, in dealing with missing data in public health studies, Bennett
79
(12) recommended 20 percent missing data as the maximum threshold for the application of
80
data imputation procedures. However, in their studies of palliative and end-of-life care, Preston
81
et al. (13) recommended that high rates of attrition or missing data should not be seen as
82
indicative of poor design and that it is more important to design a clear statistical analysis plan
83
to account for missing data and attrition.
4 85
Little and Rubin (14) introduced the concept of missingness to highlight the importance of the
86
influence of the pattern of missing data on (i) the overall bias introduced, and (ii) the proportion
87
of missing data that is too high for creating a reasonable a “complete” dataset. For example,
88
in the case that a very high proportion of data (much higher than 20%) were "missing
89
completely at random", one could still re-create the dataset with imputed data and capture the
90
essential characteristics of the original data records. Schlomer et al. (15) concurred that the
91
pattern of data missingness is a major factor of consideration, but stressed that in determining
92
whether a certain amount of missingness is problematic, one must first determine if the
93
resultant imputed dataset has adequate statistical power to detect the effects of interest.
94 95
It is clear from past research in various disciplines on the applications of data imputation in
96
missing-data management that no simple guidelines can be set for the maximum allowable
97
proportion of missing data across the board covering all fields of studies. The effect of the
98
proportion of missing data on the quality of analysis using imputed datasets depends on the
99
nature and characteristics of the data, as well as the pattern of missing data; and statistical
100
analyses must be performed to provide a fuller assessment of the effect so that the decision
101
maker can make an informed decision on how to manage the missing data and the way the data
102
should be used.
103 104
To the knowledge of the authors, in the field of pavement management studies, in regard to the
105
use of imputed datasets in pavement management analysis, their impact on data quality and
106
reliability, and the possible bias introduced to the analysis have not been studied. No guidelines
107
are available concerning the data management procedure necessary to deal with datasets
108
containing different extents of missing data. As missing data are commonly encountered in
109
pavement management data records, the availability of the aforementioned information related
110
to the use of imputed data would have high practical significance. This paper attempts to
111
provide some information to partially bridge this knowledge gap by analyzing the effect of
112
missing data in pavement roughness records.
113 114
APPROACH AND METHODOLOGY OF STUDY 115
Scope of Study 116
The common types of pavement condition and performance data that are regularly collected in
117
a typical pavement management system include pavement distress data (such as cracks, ruts,
118
potholes, depressions, etc), roughness, friction, and structural condition data derived from
non-119
destructive falling-weight deflectometer testing. Since the nature and characteristics of each
120
of these types of data are quite different from one another, it is likely that they will be affected
121
by missing data differently. It would require a major research effort to examine the effects of
122
missing data on all types of pavement condition/performance data.
123
obtained, the magnitude of errors involved as the proportion of missing data increases, and the
5 Framework of Analysis
134 135
For the purpose of studying the error and reliability characteristics of imputed data, complete
136
records of pavement roughness data without any missing data were first obtained. These full
137
records of actual measured roughness data will serve as the base reference for assessing the
138
quality and reliability characteristics of datasets containing imputed data. The datasets
139
containing missing data are artificially generated randomly from the original complete data
140
records for the purpose of studying the effects of introducing imputed data.
141 142
The proposed analysis consists of the following steps:
143
(1) Selection of complete data records -- The Federal Highway Administration's (FHWA)
144
Long-Term Pavement Performance Program (LTPP) database (16) offers a convenient
145
source for the selection of pavement roughness data records for the present study. The
146
roughness data are reported in terms of the International Roughness Index (IRI).
147
(2) Creation of datasets having different levels of data missingness and different patterns of
148
missingness -- To study the effect of the level of data missingness (i.e. proportion of
149
missing data), at least six equally spaced levels of data missingness were first identified.
150
Next, for each specified level of data missingness, a random process was employed to
151
generate a dataset containing the correct number (say n number) of missing data by
152
randomly deleting n data points from the original complete data records. This random
153
deletion process is repeated another 9 times so as to produce a total of 10 randomly
154
generated datasets, each with a different patterns of missingness, for each of the 6 or
155
more levels of data missingness studied.
156
(3) Computation of imputed values for each dataset containing missing data -- For each of
157
the datasets containing missing data earlier generated in Step 2, apply a suitable data
158
imputation method to compute a data value for each of the missing data. At the end of
159
this step, all the datasets with missing data generated in Step 2 would be transformed into
160
datasets containing imputed data values. That is, there would be 10 datasets containing
161
imputed data for each level of data missingness. The technique of Multiple Imputation
162
(MI) was adopted for computing imputed data in this study. The imputed value for each
163
missing data in each of the 10 generated datasets is obtained as the mean value of 10
164
imputation runs. The concept and procedure of computation of the MI technique is
165
explained in the next section.
166
(4) Performing of error and reliability analysis – Using the original complete data records as
167
the base reference, the errors of the imputed data can be computed and analyzed. The
168
variation of the errors with the level of data missngness can be examined. The statistical
169
reliability of the imputed datasets at different levels of data missingness can also be
170
established by means of hypothesis testing.
171 172
Multiple Imputation (MI) Technique for Data Imputation 173
demonstrated in their earlier work (19) that the Multiple Imputation method out-performed the
178
conventional methods (such as the deletion method, and the substitution methods using mean,
179
interpolation, or regression) in handling missing pavement condition/performance data, and
6
distribution parameters, which are then used to estimate the missing data values. In the analysis
185
phase, each imputed value is analyzed together with the corresponding available ones using
186
statistical procedure to produce a new imputed value. This iterative process continues until the
187
imputed value changes very little from one iteration to the next. By repeating this procedure,
188
multiple imputations of the missing values are generated. Finally, on the pooling phase, the
189
integration of the multiple imputation results into a single set of result to produce overall 190
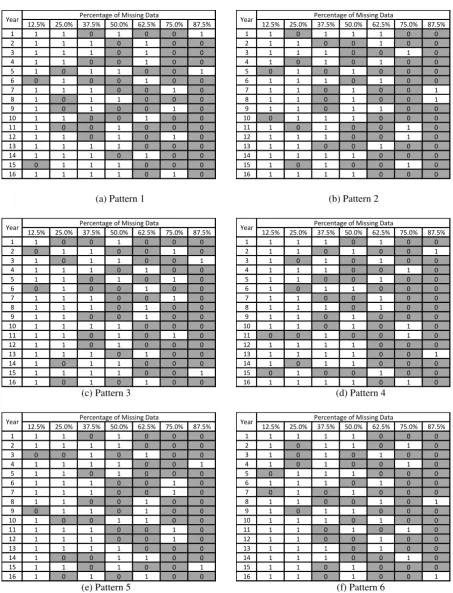
estimates and standard errors that reflect missing-data uncertainty. These combined standard
191
errors are useful for statistical significance testing and drawing of inferential conclusions.
192 193
The working of the Multiple Imputation method makes use of two main algorithms, namely
194
Expectation Maximization (EM) and Data Augmentation (DA). The procedure of data 195
imputation adopted in the study involves of the following steps: 196
Step I: Data Transformation – Firstly, it is required to transform the data to
197
approximately normal before imputation using a transformation functions, such as logit,
198
log or square root functions. After imputation, the data will be transformed back to
199
their original scale.
200
Step II: Imputation using EM – EM uses the maximum likelihood approach to perform
201
the imputation function in the “imputation and analysis phase” of the MI procedure. 202
This step will generate estimates of missing values for the data matrix with the
203
convergence criterion that the maximum relative parameter change in the value of any
204
parameter during the iterative process is less than 10-6.
205
Step III: Imputation using DA – With the initial parameter estimates from the EM
206
algorithm serving as the basis, the DA algorithm carries out multiple imputations as
207
explained earlier in the “imputation and analysis phase” of the MI procedure. The
208
commonly adopted practice of 10 imputations (14, 20) is applied in this study.
209
Step IV: Synthesis of Estimates – Average over the multiple estimates of the multiple
210
imputation analysis to obtain the final set of estimates (17).
211 212
ILLUSTRATIVE EXAMPLE: IMPUTATION OF ROUGHNESS DATA 213
214
IRI Records in LTPP Database 215
illustrative analysis of this study:
219
Road Section SHRP ID 28-1802 with 8 years of continuous measured annual IRI
220
(International Roughness Index) data;
221
Road Section SHRP ID 20-1005 with 10 years of continuous measured annual IRI data;
222
and
223
Road Section SHRP ID 25-1002 with 16 years of continuous measured annual IRI data.
224 225
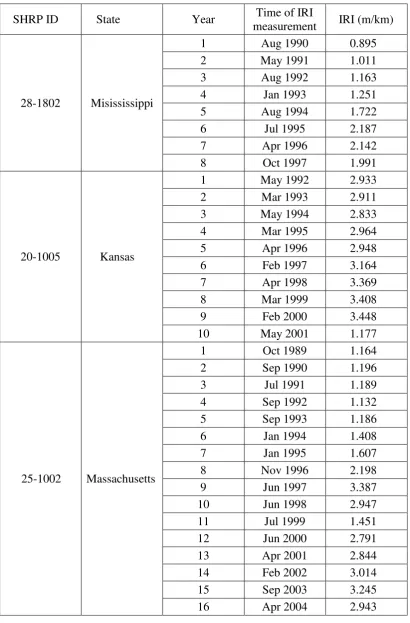
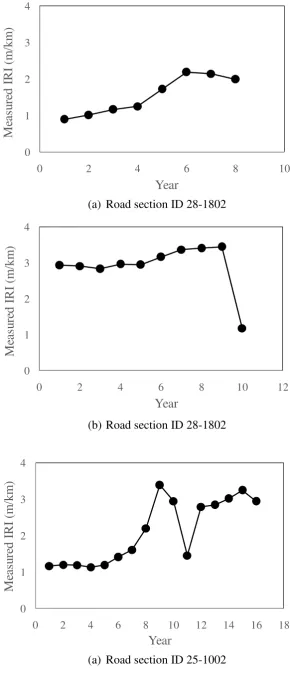
Table 1 records the measured IRI values and the corresponding times of measurements of the
226
IRI records of the three road sections. These IRI data are plotted in Figure 1. Although the
227
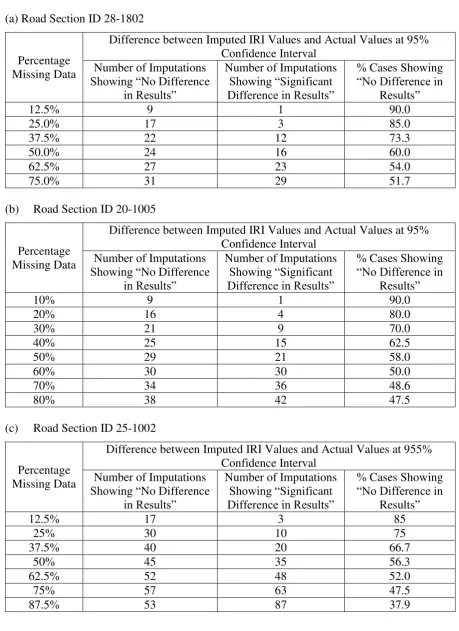
annual IRI measurements were not measured at time intervals of exactly 12 months, they can
7
be considered as time series data for the analysis and illustration purpose of the present example
229
to study the effects of missing data.
230 231
The three road sections have been selected because their pavement roughness variation trends
232
display very distinctly different patterns. Road Sections SHRP ID 28-1802 and ID 20-1005
233
both had roughness value gradually increased with time, except for the latter there was a sharp
234
drop in roughness value in the last year of the record. The roughness variations of Road Section
235
ID 25-1002 were characterized by two periods of gentle increases (from year 1 to 7, and from
236
Data Representation 240
241
Pavement roughness is expected to increase with the number of years of service due to the
242
impact of traffic loading. However, in the occasion of pavement re-surfacing or rehabilitation,
243
the roughness would be restored to a lower value. Such maintenance and rehabilitation (M&R)
244
activities are common in road operations, they occurred for all three road sections considered
245
in the present study. As indicated in the LTPP database, for Road Section SHRP ID 28-1802,
246
minor M&R (maintenance and rehabilitation) took place in years 7 and 8 and resulted in slight
247
decreases in the IRI value. For Road Section ID 20-1005, a minor and a major M&R were
248
performed in years 5 and 10 respectively. For Road Section SHRP ID 25-1002, the database
249
records indicated a major and a minor M&R in years 10 and 16 respectively.
250 251
In the data imputation analysis, this situation was handled by introducing an M&R dummy
252
variable. The dummy variable would be assigned a value of 1 if there was an M&R operation
253
in the year of interest, and 0 otherwise. For the Road Section ID 25-1002, it is noted from
254
Figure 1 that although the LTPP database indicated an M&R operation in year 11, a drop in the
255
IRI value started to occur in year 10. It is suspected that part of the M&R might have
256
commenced in year 10 and resulted in the fall of IRI.
257 258
Generation of Datasets with Missing Data 259
260
To study the effect of the proportion of missing data and determine the maximum allowable
261
proportion of missing data, datasets with proportions of missing data ranging from
262
approximately 10 to 90% were created for the three road sections studied. These datasets with
263
missing data were randomly generated from the respective original complete data records of
264
the three road sections. The levels of data missingness created for the three road sections
265
studied are as follows:
266
SHRP ID 28-1802: A total of 6 levels of data missingness was created. The percentages
267
of missing data created were 12.5%, 25%, 37.5%, 50%, 62.5% and 75%;
268
SHRP ID 20-1005: A total of 8 levels of data missingness was created. The percentages
269
of missing data created were 10%, 20%, 30%, 40%, 50%, 60%, 70% and 80%;
270
SHRP ID 25-1002: A total of 7 levels of data missingness was created. The percentages
271
of missing data created were 12.5%, 25%, 37.5%, 50%, 62.5%, 75% and 87.5%.
272 273
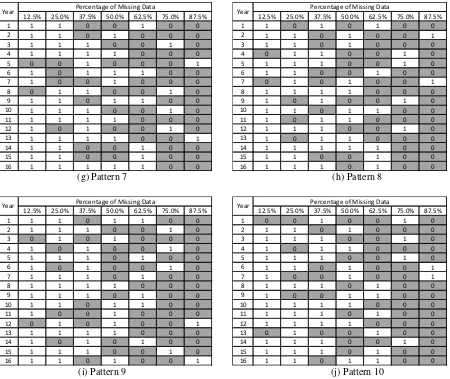
For each of the three road sections, at each level of data missingness, 10 different patterns of
274
missing data were randomly created. Figures 2, 3 and 4 show all the patterns of missing data
275
created for Road Sections SHRP ID 28-1802, SHRP ID 20-1005 and SHRP ID 25-1002
276
respectively.
8 278
Analysis of Imputation Results 279
corresponding actual data values of the original complete data records. As explained earlier,
284
for each road section roughness record analyzed, 10 patterns of missing data were created for
285
each level of data missingness (see Figures 2 to 4); and for each pattern of missing data for a
286
given level of missingness, 10 imputation runs were made using the MI technique. Hence,
287
there were 10 imputed values for each missing data form the 10 imputation runs, and the error
288
of each imputed roughness value is defined as its deviation from the actual roughness value of
289
the original complete data record.
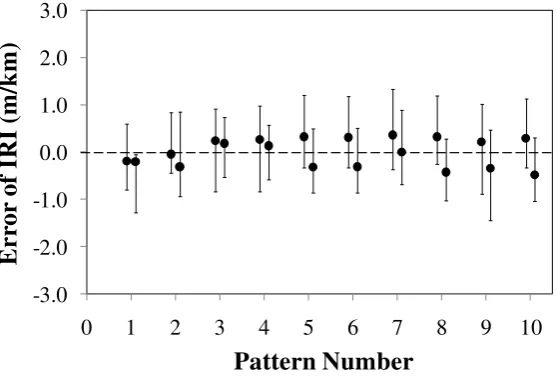
290 291
Figure 5 presents three examples of the mean and range of errors of the imputed values against
292
the levels of data missisngness (i.e. proportions of missing data) for the three road sections
293
studied. Figure 5(a) shows the results of imputation errors for the datasets of the level of data
294
missingness with 25% missing data for the roughness data of the Road Section SHRP ID
28-295
1802. At 25%, there were two missing data per dataset (i.e. two missing data per pattern of
296
missing data, see Figure 2). Hence, in Figure 5(a), there are two sets of error results for each
297
of the 10 patterns of missing patters. Similarly, in Figure 5(b) for the roughness data of Road
298
Section SHRP ID 20-1005, there are two sets of error results for each of the 10 patterns of
299
missing patters at the level of missing data of 20%. For the roughness data of Road Section
300
SHRP ID 25-1002, there are four sets of error results for each of the 10 patterns of missing
301
patters at the level of missing data of 25%.
302 303
From the three plots of the errors of the imputed data values shown in Figure 5, the following
304
comments can be made:
305
(1) For Road Section SHRP ID 28-1802, there are no clear trends of variation among the
306
errors for the 10 patterns. This is within expectation because the imputed data values
307
were generated through a random process.
308
(2) For Road Section SHRP ID 20-1005, large errors are found for one imputed mean value
309
each for patterns 1 and 6. These large errors occurred because the two patterns both
310
contain a missing data in year 10, the year with a sudden drop in roughness value. This
311
observation highlights that having missing data in regions of sharp changes in
312
roughness data would introduce large errors when data imputation is applied.
313
(3) For Road Section SHRP ID 25-1002, large errors occurred for one imputed mean value
314
each for patterns 1, 5, 6, 8 and 10. Each of these patterns has a missing value in either
315
year 9 or 10. These are the two years with a sharp fall of the roughness value. This
316
observation reinforces the earlier observation made in the preceding paragraph
317
concerning larger imputation errors associated with sharp changes in roughness data.
318 319
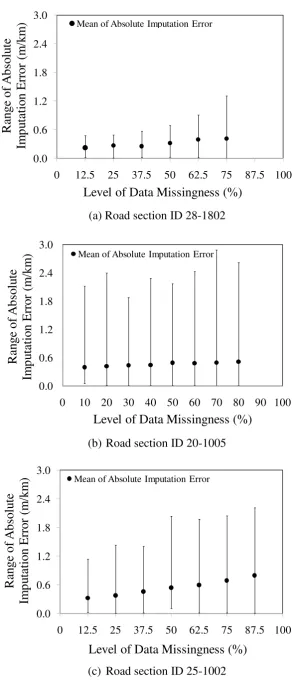
Another error characteristic of interest is how errors vary with the level of data missingness.
320
Figure 6 plots the mean and range of the absolute errors of imputed values against the levels of
321
data missisngness (i.e. proportions of missing data) for all the cases of the three road sections
322
studied. The following characteristics can be observed:
323
(1) For all three road sections, the magnitude of imputation errors increased with the level
324
of data missingness. Road Section SHRP ID 28-1802 which has no abrupt changes in
325
its roughness data, had the smallest mean imputation errors ranging from about 0.2 to
9
0.4 m/km; while the other two road sections containing abrupt changes in their
327
roughness data, had larger mean imputation errors ranging from about 0.3 to 0.7 m/km.
328
(2) The range of the errors was also found to increase with the level of data misisngness in
329
general. Among the three road sections examined, the two road sections with abrupt
330
changes in roughness data (i.e. SHRP ID 20-1005 and SHRP ID 25-1002) again
331
displayed significantly larger ranges of variation in the range of the values of imputation
332
The uncertainty involved in the imputation of missing values is reflected in the variations of
337
respectively, are depicted.
341 342
With the error characteristics presented in Figures 5 and 6, a statistical reliability analysis of
343
the imputation results can be performed. For the purpose of the present study, a hypothesis
344
testing was performed to compare the mean computed value for each missing data with the
345
corresponding actual data value of the original complete record. Since for each missing data,
346
there were 10 imputed values, the Student’s t-test (21) was employed for the test. The
347
hypothesis testing considers the following null and alternative hypothesis:
348
Null hypothesis (H0): The mean imputed value which is obtained from 10 imputation 349
analyses, µz, is no different from the actual data value µ0 from the original data record of 350
the given road section, i.e.
351
H0:
z
0 352Alternative hypothesis (H1): The mean imputed value which is obtained from 10 imputation 353
analyses, µz, is different from the actual data value µ0 from the original data record of the 354
given road section, i.e.
355
H1:
z
0 356For each data point in Figure 6, a hypothesis testing is performed for a given level of confidence
357
to determine if the imputed mean value is different from the actual value. For a confidence
358
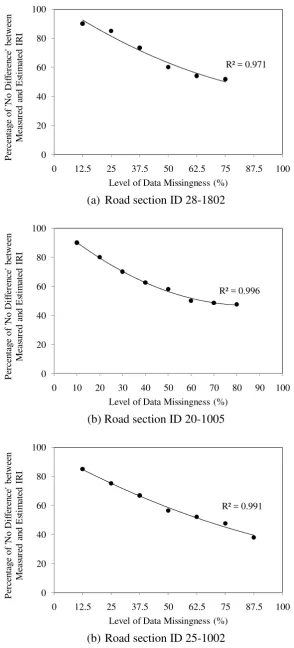
level of 95%, Table 2 presents the results of the hypothesis test for all the cases of the three
359
road sections studied. These results are plotted in Figure 7.
360 361
From the results in Table 2 and Figure 7, taking a permissible error of 20% (i.e. corresponding
362
to the case of 80% “no difference” in Table 2) in the multiple imputation process, the maximum
363
allowable percentage of missing data is 30.3% for Road Section 28-1802, 20% for Road
364
Section 20-1005, and 18.75% for Road Section 25-1002. Thus, it appears reasonable for
365
practical application to set 25% as the limit of the proportion of missing data when there are
366
no abrupt changes of roughness data (i.e. no pavement rehabilitation) in the data records, and
367
apply a limit of 15% when the data records involve abrupt changes in roughness data caused
368
by pavement rehabilitation.
369 370
Overall Comments
371 372
The error analysis presented in the preceding sections showed that imputation errors increased
373
with the level of data missingness, and that abrupt changes in the data of the roughness records
374
brought about by pavement resurfacing or rehabilitation would lead to increased errors in the
10
imputation results. As depicted in the plots of Figures 5 and 6, the increased errors due to
376
rising levels of data missingness are also associated with increased variances of the imputed
377
data. This implies that the reliability level of data imputation decreases as the level of data
378
missingness increases.
379 380
It was also observed that performing pavement rehabilitation within the analysis period,
381
resulting in an abrupt fall in the roughness value in the data record, had a significant negative
382
impact on the error magnitude and reliability of the imputed data. This can be expected because
383
the action of rehabilitation caused a discontinuity in the deterioration trend of the roughness
384
data. Based on the analysis presented, the following recommendations can be made regarding
385
the maximum proportion of missing data allowable in the application of data imputation in
386
pavement roughness analysis:
387
(1) Allowing up to 20% error in the multiple imputation analysis at a confidence level of
388
95%, 25% of missing data appears to be a reasonable allowable maximum limit for
389
analyzing pavement roughness time series data not having any pavement
390
rehabilitation within the analysis period. When pavement rehabilitation occurs within
391
the analysis period, the maximum proportion of imputed data should be limited to
392
15%.
393
(2) Alternatively, a pre-processing before data imputation analysis may be performed to
394
a roughness data record that contains pavement rehabilitation operations. This
pre-395
processing will break the original data record into one or more data records at the
396
year(s) of rehabilitation, so that each new sub-data record will contain roughness time
397
series data beginning after a year of construction/rehabilitation and ending before a
398
year of construction/rehabilitation. In this way, all new sub-data records will not
399
contain any rehabilitation within the analysis period, and the allowable maximum
400
proportion of missing data can be set as 25% for in the data imputation analysis for all
401
sub-data records.
402 403
CONCLUSIONS 404
405
This paper has presented a procedure to evaluate the effect of the level of data missingness on
406
the results of data imputation in pavement management analysis. A numerical example using
407
pavement roughness data was presented to illustrate the proposed procedure and analyze the
408
error and reliability characteristics of imputed data for three road sections. The roughness data
409
of the three road sections were obtained from the LTPP database. From these data records,
410
datasets with different proportions of missing data were randomly generated to study the effect
411
of the level of data missingness.
412 413
The analysis shows that the errors of imputed data increased with the level of data missingness,
414
and their magnitudes are significantly affected by the effect of pavement rehabilitation. For
415
the three road sections studied, the presence of rehabilitation within the period of the roughness
416
record analysed caused the mean imputation errors to increase from a range of 0.2 to 0.4 m/km
417
missing data for the application of data imputation in pavement roughness analysis. Allowing
421
up to 20% error in the multiple imputation analysis at a confidence level of 95%, the study
422
recommends 25% of missing data as a reasonable allowable maximum limit for analyzing
423
pavement roughness time series data not having any pavement rehabilitation within the analysis
11
period. When pavement rehabilitation occurs within the analysis period, the recommended
425
maximum proportion of imputed data is 15%.
426 427
The study also proposed performing of pre-processing of data record to eliminate the influence
428
of pavement rehabilitation. This is achieved by breaking the data record into sub-records, each
429
containing time series roughness data that begins from a year of rehabilitation and ends before
430
the next rehabilitation year. By so doing, the maximum allowable limit of 25% missing data
431
can be uniformly applied to the imputation analysis of all data records.
432 433
REFERENCES 434
435
1. Amado, V. and Bernhardt, K. L. S. Knowledge Discovery in Pavement Condition Data.
436
In the 81st Annual Meeting of the Transportation Research Board (TRB), Washington
437
D.C., 2002.
438
2. FHWA. LTPP Infopave. http://www.infopave.com. Accessed May 20, 2014.
439
3. Lindly, J. K., Bell, F. and Sharif U. Specifying Automated Pavement Condition Surveys.
440
Journal of the Transportation Research Forum, Vol. 44, No. 3, 2005, pp.19-32.1.
441
4. National Cooperative Highway Research Program (NCHRP). Quality Management of
442
Pavement Condition Data Collection. National Cooperative Highway Research Program
443
Synthesis Report No. 401, Transportation Research Board, Washington, D.C., 2009.
444
5. Amado, V. and Bernhardt, K. Expanding the use of pavement condition data through
445
knowledge discovery in databases. Proc. of the International Conference on Applications
446
of Advanced Technologies in Transportation Engineering, 2002, pp.394-401.
447
6. Bennett, C. R. Sectioning of road data for pavement. Proceedings of the 6th International
448
Conference on Managing Pavements, Queensland, Australia, 2004.
449
7. Cismondi F., Fialho A.S., Vieira S.M., Reti S.R., Sousa J.M. and Finkelstein S.N.
450
Missing data in medical databases: impute, delete or classify? Artificial Intelligence in
451
Medicine, 58(1), 2013, pp. 63-72.
452
8. Rubin D.B., Schenker N. Multiple imputation in health-care databases: an overview and
453
some applications. Statistics in Medicine, 10(4), 1991, pp. 585-598.
454
9. Saunders J. A., Howell N. M., Spitznagel E., Dori P., Proctor E. K. and Pescarino R.
455
Imputing Missing Data: A Comparison of Methods for Social Work Researchers. Social
456
Work Research 30(1), 2006.
457
10. King G., Honaker J., Joseph A. and Scheve K. Analyzing incomplete political science
458
data: An alternative algorithm for multiple imputation. American Political Science
459
Review, 95(1), 2001, pp. 49-69.
460
13. Preston N. J., Fayers P., Walters S. J., Pilling M., Grande G. E., Short V., Owen-Jones
461
E., Evans C. J., Benalia H., Higginson I. J. and Todd C. J., Recommendations for
462
managing missing data, attrition and response shift in palliative and end-of-life care
463
research. Palliative Medicine, 27(10), 2013, pp. 899-907.
464
14. Little, R.J.A and Rubin, D. B. Statistical analysis with missing data. John Wiley & Sons,
465
New York, 1987.
466
15. Schlomer G. L., Bauman S., and Card N. A., Best Practices for Missing Data
467
Management in Counseling Psychology. Journal of Counseling Psychology, 57(1), 2010,
468
pp. 1-10.
469
16. Long Term Pavement Performance (LTTP) Database. “LTTP DataPave Online.”
470
http://www.lttp-products.com/DataPave, Accessed on 3 June 2014.
471
17. Rubin, D.B. Multiple Imputation for Nonresponse in Survey, John Wiley & Sons, New
472
York, 1987.
473
18. Enders, C.K. Applied Missing Data Analysis. The Guilford Press, New York, 2010.
12
19. Farhan, J. and Fwa T. F. Augmented Stochastic Multiple Imputation Model for Airport
475
Pavement Missing Data Imputation. Transportation Research Record: Journal of the
476
Transportation Research Board, No. 2336, 2013, pp. 43-54.
477
20. Schafer, J.L. Analysis of Incomplete Multivariate Data, Chapman & Hall/CRC, Florida,
478
1997.
479
21. Hahn, G. and Shapiro, S. Statistical Models in Engineering. John Wiley & Sons Inc, New
480
York, NY, 1967.
13 List of Tables
484 485
Table No.
486
1 Observed IRI Values of Road Sections Studied
487
2 Results of Hypothesis Testing of the Difference between Imputed IRI Values of
488
Missing Data and Actual IRI Values
489 490 491 492
List of Figures 493
494
Figure No.
495
1 Measured IRI Data of Road Sections Studied
496
2 Patterns of Missing IRI Data Created for Road Section SHRP ID 28-1802
497
3 Patterns of Missing IRI Data Created for Road Section SHRP ID 20-1005
498
4 Patterns of Missing IRI Data Created for Road Section SHRP ID 25-1002
499
5 Mean Values and Ranges of Imputation Results for Road Section Studied
500
6 Mean Errors of Imputation Data against Level of Data Missingness
501
7 Effect of Proportion of Missing Data on Imputation Results
502
14 TABLE 1 Observed IRI Values of Road Sections Studied
SHRP ID State Year Time of IRI
measurement IRI (m/km)
28-1802 Misississippi
1 Aug 1990 0.895
2 May 1991 1.011
3 Aug 1992 1.163
4 Jan 1993 1.251
5 Aug 1994 1.722
6 Jul 1995 2.187
7 Apr 1996 2.142
8 Oct 1997 1.991
20-1005 Kansas
1 May 1992 2.933
2 Mar 1993 2.911
3 May 1994 2.833
4 Mar 1995 2.964
5 Apr 1996 2.948
6 Feb 1997 3.164
7 Apr 1998 3.369
8 Mar 1999 3.408
9 Feb 2000 3.448
10 May 2001 1.177
25-1002 Massachusetts
1 Oct 1989 1.164
2 Sep 1990 1.196
3 Jul 1991 1.189
4 Sep 1992 1.132
5 Sep 1993 1.186
6 Jan 1994 1.408
7 Jan 1995 1.607
8 Nov 1996 2.198
9 Jun 1997 3.387
10 Jun 1998 2.947
11 Jul 1999 1.451
12 Jun 2000 2.791
13 Apr 2001 2.844
14 Feb 2002 3.014
15 Sep 2003 3.245
15 TABEL 2 Results of Hypothesis Testing of the Difference between Imputed IRI Values of Missing Data and Actual IRI Values
(a) Road Section ID 28-1802
Percentage Missing Data
Difference between Imputed IRI Values and Actual Values at 95% Confidence Interval
Number of Imputations
Showing “No Difference
in Results”
Number of Imputations
Showing “Significant Difference in Results”
% Cases Showing
“No Difference in Results”
12.5% 9 1 90.0
25.0% 17 3 85.0
37.5% 22 12 73.3
50.0% 24 16 60.0
62.5% 27 23 54.0
75.0% 31 29 51.7
(b) Road Section ID 20-1005
Percentage Missing Data
Difference between Imputed IRI Values and Actual Values at 95% Confidence Interval
Number of Imputations
Showing “No Difference
in Results”
Number of Imputations
Showing “Significant Difference in Results”
% Cases Showing
“No Difference in Results”
10% 9 1 90.0
20% 16 4 80.0
30% 21 9 70.0
40% 25 15 62.5
50% 29 21 58.0
60% 30 30 50.0
70% 34 36 48.6
80% 38 42 47.5
(c) Road Section ID 25-1002
Percentage Missing Data
Difference between Imputed IRI Values and Actual Values at 955% Confidence Interval
Number of Imputations
Showing “No Difference
in Results”
Number of Imputations
Showing “Significant Difference in Results”
% Cases Showing
“No Difference in Results”
12.5% 17 3 85
25% 30 10 75
37.5% 40 20 66.7
50% 45 35 56.3
62.5% 52 48 52.0
75% 57 63 47.5
16
(a) Road section ID 28-1802
(b) Road section ID 28-1802
(a) Road section ID 25-1002
FIGURE 1 Measured IRI Data of Road Sections Studied
0 1 2 3 4
0 2 4 6 8 10
M
eas
u
re
d
I
R
I
(m
/k
m
)
Year
0 1 2 3 4
0 2 4 6 8 10 12
M
eas
u
re
d
I
R
I
(m
/k
m
)
Year
0 1 2 3 4
0 2 4 6 8 10 12 14 16 18
M
eas
u
re
d
I
R
I
(m
/k
m
)
17
Remarks: 0 = IRI missing data
FIGURE 2 Patterns of Missing IRI Data Created for Road Section SHRP ID 28-1802 12.5% 25.0% 37.5% 50.0% 62.5% 75.0%
1 1 1 0 1 0 0
Year Percentage of Missing Data
12.5% 25.0% 37.5% 50.0% 62.5% 75.0% 1 1 1 1.01 0 1 0
Year Percentage of Missing Data
12.5% 25.0% 37.5% 50.0% 62.5% 75.0%
1 1 0 1 0 1 0
Year Percentage of Missing Data
12.5% 25.0% 37.5% 50.0% 62.5% 75.0%
1 0 1 0 0 1 0
Year Percentage of Missing Data
12.5% 25.0% 37.5% 50.0% 62.5% 75.0%
1 1 1 0 1 0 0
Year Percentage of Missing Data
12.5% 25.0% 37.5% 50.0% 62.5% 75.0%
1 1 1 0 1 0 1
Year Percentage of Missing Data
12.5% 25.0% 37.5% 50.0% 62.5% 75.0%
1 1 1 1 0 1 0
Year Percentage of Missing Data
12.5% 25.0% 37.5% 50.0% 62.5% 75.0%
1 1 0 0 1 0 0
Year Percentage of Missing Data
12.5% 25.0% 37.5% 50.0% 62.5% 75.0%
1 1 1 1 0 0 1
18
FIGURE 3 Patterns of Missing IRI Data Created for Road Section SHRP ID 20-1005 10% 20% 30% 40% 50% 60% 70% 80%
Percentage of Missing Data Year
Percentage of Missing Data Year
Percentage of Missing Data Year
Percentage of Missing Data Year
Percentage of Missing Data Year
Percentage of Missing Data Year Year Percentage of Missing Data
10% 20% 30% 40% 50% 60% 70% 80%
Percentage of Missing Data Year
Percentage of Missing Data Year
19
(a) Pattern 1 (b) Pattern 2
(c) Pattern 3 (d) Pattern 4
(e) Pattern 5 (f) Pattern 6
FIGURE 4 Patterns of Missing IRI Data Created for Road Section SHRP ID 25-1002 (continued next page)
12.5% 25.0% 37.5% 50.0% 62.5% 75.0% 87.5%
1 1 1 0 1 0 0 1
Year Percentage of Missing Data
12.5% 25.0% 37.5% 50.0% 62.5% 75.0% 87.5%
1 1 0 1 1 1 0 0
Year Percentage of Missing Data
12.5% 25.0% 37.5% 50.0% 62.5% 75.0% 87.5%
1 1 0 0 1 0 0 0
Year Percentage of Missing Data
12.5% 25.0% 37.5% 50.0% 62.5% 75.0% 87.5%
1 1 1 1 0 1 0 0
Year Percentage of Missing Data
12.5% 25.0% 37.5% 50.0% 62.5% 75.0% 87.5%
1 1 1 0 1 0 0 0
Year Percentage of Missing Data
12.5% 25.0% 37.5% 50.0% 62.5% 75.0% 87.5%
1 1 1 1 1 0 0 0
20
(g) Pattern 7 (h) Pattern 8
(i) Pattern 9 (j) Pattern 10
FIGURE 4 Patterns of Missing IRI Data Created for Road Section SHRP ID 25-1002 (continuation)
12.5% 25.0% 37.5% 50.0% 62.5% 75.0% 87.5%
1 1 1 0 0 1 0 0
2 1 1 0 1 0 0 0
3 1 1 1 0 0 1 0
4 1 1 1 1 0 0 0
5 0 0 1 0 0 0 1
6 1 0 1 1 1 0 0
7 1 0 0 1 0 0 0
8 0 1 1 0 0 1 0
9 1 1 0 1 1 0 0
10 1 1 1 0 0 1 0
11 1 1 1 1 0 0 0
12 1 0 1 0 0 1 0
13 1 1 1 1 0 0 1
14 1 1 0 0 1 0 0
15 1 1 0 0 1 0 0
16 1 1 1 1 1 0 0
Year Percentage of Missing Data
12.5% 25.0% 37.5% 50.0% 62.5% 75.0% 87.5%
1 1 0 1 0 1 0 0
2 1 1 0 1 0 0 1
3 1 1 0 1 0 0 0
4 0 1 1 0 0 1 0
5 1 1 1 0 0 1 0
6 1 1 0 0 1 0 0
7 0 1 0 1 0 0 1
8 1 1 1 1 0 0 0
9 1 0 1 0 0 1 0
10 1 1 0 1 1 0 0
11 1 0 1 1 0 0 0
12 1 1 1 0 0 1 0
13 1 0 1 1 0 0 0
14 1 1 1 1 1 0 0
15 1 1 0 0 1 0 0
16 1 1 1 0 1 0 0
Year Percentage of Missing Data
12.5% 25.0% 37.5% 50.0% 62.5% 75.0% 87.5%
1 1 1 0 1 1 0 0
2 1 1 1 0 0 1 0
3 0 1 0 1 0 0 0
4 1 0 1 0 0 1 0
5 1 1 1 0 1 0 0
6 1 0 1 0 0 1 0
7 1 1 1 0 1 0 0
8 1 1 1 1 0 0 0
9 1 1 1 0 1 0 0
10 1 1 0 1 1 0 0
11 1 0 0 1 0 0 0
12 0 1 0 1 0 0 1
13 1 1 1 1 0 0 0
14 1 0 1 0 1 0 0
15 1 1 1 0 0 1 0
16 1 1 0 1 0 0 1
Year Percentage of Missing Data
12.5% 25.0% 37.5% 50.0% 62.5% 75.0% 87.5%
1 0 0 1 0 0 1 0
2 1 1 0 1 0 0 0
3 1 1 1 0 0 1 0
4 1 0 1 1 0 0 0
5 1 1 1 0 0 1 0
6 1 1 0 1 0 0 1
7 1 0 0 1 0 0 1
8 1 1 1 0 1 0 0
9 1 0 0 1 1 0 0
10 1 1 1 1 0 0 0
11 1 1 1 0 1 0 0
12 1 1 1 1 0 0 0
13 0 1 0 0 1 0 0
14 1 1 1 0 0 1 0
15 1 1 1 0 1 0 0
16 1 1 0 1 1 0 0
21
(a) 25% missing data for Road Section ID 28-1802
(b) 20% missing data for Road Section ID 20-1005
(c) 25% missing data for Road Section ID 25-1002
FIGURE 5 Mean and Ranges of Errors of Imputation Results for Road Sections Studied
-3.0 -2.0 -1.0 0.0 1.0 2.0 3.0
0 1 2 3 4 5 6 7 8 9 10
E
rr
o
r
o
f
IRI
(
m
/k
m
)
Pattern Number
-3.0 -2.0 -1.0 0.0 1.0 2.0 3.0
0 1 2 3 4 5 6 7 8 9 10
E
rr
o
r
o
f
IRI
(
m
/k
m
)
Pattern Number
-3.0 -2.0 -1.0 0.0 1.0 2.0 3.0
0 1 2 3 4 5 6 7 8 9 10
E
rr
o
r
o
f
IRI
(
m
/k
m
)
22
(a) Road section ID 28-1802
(b) Road section ID 20-1005
(c) Road section ID 25-1002
FIGURE 6 Mean Errors of Imputation Data against Level of Data Missingness
0.0
Level of Data Missingness (%) Mean of Absolute Imputation Error
0.0
Level of Data Missingness (%) Mean of Absolute Imputation Error
0.0
23
(a) Road section ID 28-1802
(b) Road section ID 20-1005
(b) Road section ID 25-1002
FIGURE 7 Effect of Proportion of Missing Data on Imputation Results R² = 0.971
Level of Data Missingness (%)
R² = 0.996
Level of Data Missingness (%)
R² = 0.991