251 (2000) 1–15
www.elsevier.nl / locate / jembe
Estimating digestion rate and the problem of individual
variability, exemplified by a scyphozoan jellyfish
* ˚
Ulf Bamstedt , Monica B. Martinussen
Department of Fisheries and Marine Biology, University of Bergen, High Technology Centre, N-5020 Bergen, Norway
Received 26 September 1999; received in revised form 15 February 2000; accepted 28 February 2000
Abstract
Short-term (h) and long-term (days) individual variability and the effects of momentary change in feeding intensity on digestion time were studied in the scyphomedusa Aurelia aurita as a basis for developing a method to experimentally measure the digestion rate with a high precision. Ten individual medusae showed only small, non-significant differences in average digestion time (range, 2.1–2.5 h at 108C) over a 9-day experiment, whereas variability within and between days and between individuals at a given occasion was high. When medusae were manually kept at a constant feeding intensity, stomach fullness showed high variability both between individuals and
21
within an individual over time. With a feeding intensity of, respectively, 1, 2, 4 and 8 prey h over a 5-h experimental period, stomach fullness of most individuals corresponded to a theoretical digestion time of 1–3 h, whereas single meals of the same size usually gave somewhat higher digestion time. Medusae subject to a switching from a low to a high feeding intensity tended to increase the variability, but most individuals showed a digestion time of 1–3 h. An opposite switching tended to increase the digestion time and its variability. It is concluded that the digestion time of A. aurita is randomly variable over time within given limits for a given food and environmental condition. This variability is non-synchronised in the population, causing high variability between individuals, and changes in the feeding intensity cause additional variability. However, the average digestion time of A. aurita in a physically and nutritionally stable environment is robust, and changes in the feeding intensity give predictable effects. The use of field collected data on stomach contents and laboratory determined digestion times is therefore an attractive method to calculate predation rate, but the inherent high variability in digestion time must be taken into consideration when designing the digestion experiments. Based on these findings a simple experimental method to determine the digestion time of aquatic animals is outlined and evaluated. The digestion time is simply given as the ratio between number of prey in stomach and total number of prey eaten, times the incubation time, assuming that the feeding intensity is constant. 2000 Elsevier Science B.V. All rights reserved.
*Corresponding author. Tel.:147-55-983-962; fax:147-55-983-950.
˚
E-mail address: [email protected] (U. Bamstedt)
Keywords: Jellyfish; Medusae; Digestion; Feeding; Nutrition
1. Introduction
Digestion is the physiological process that converts food matter to energy and material for activity, growth and reproduction of an organism. The amount of food in the digestive tract together with the rate of digestion thus define how much energy and material will be available for the organism per unit of time. In quantitative food-web studies, much information can therefore be gained by simply measuring stomach contents and digestion rate. The product of these two factors will give the predation rate, and this highlights the importance of correctly estimating the digestion rate in such studies. The pioneer work by Bajkov (1935) on gut contents of fish, introduced gut analysis as a quantitative tool to estimate ingestion rate of carnivorous animals. Mackas and Bohrer (1976) were the first to use analysis of gut contents of algal pigments in copepods as a method to estimate herbivorous ingestion rate. The gut fluorescence method has since been extensively used and is now one of the most common methods in field works on algal grazing. Similarly, predation by some invertebrate taxa like chaetognaths, siphonophores, ctenophores and several taxa of medusae, is today mostly estimated from the gut contents (e.g., Purcell, 1981a,b,c, 1982, 1984; Purcell and
˚
Kremer, 1983; Øresland, 1987, 1990; Falkenhaug, 1991; Martinussen and Bamstedt,
˚
1995, Matsakis and Conover, 1991; Bamstedt, 1998).
In the gut-content methods a correct estimate of the turnover rate of gut contents is essential and this is actually the most critical part in the method, since it has to be determined experimentally. In the gut-fluorescence method this is commonly done by transferring well-fed animals to starved condition and taking sub-samples over a time series. For predators with macroscopic prey, direct observations is the usual technique, where the time from ingestion to disappearance in the integument is recorded.
In field studies based on gut contents investigators usually do not allocate much of their total effort to properly define the digestion rate, and many workers just use values
˚
from the literature. Martinussen and Bamstedt (1999) showed a consistently high inter-and intra-specific variability in average digestion time of gelatinous zooplankton, in spite of using a technique where defined prey was placed in the stomach of the predator at a precise starting time. Such variability may be related to individual differences and / or changes over shorter or longer time. Variability might also be related to change in feeding intensity. It will be essential both for designing digestion experiments and for the evaluation of the results from them to know how robust the digestion rate is in a constant and variable food environment.
different momentary changes to new feeding intensities. The results will give guidelines in how to design and dimension digestion experiments and they also form a basis for a simple method to experimentally determine the digestion time, which is outlined here.
2. Material and methods
The scyphomedusa A. aurita was used as model organism because of its transparent body and ability to accept prey put directly into the stomach. Because of this, stomach content could be controlled without killing the animals and the ingestion rate could be precisely controlled through the frequency by which the animals were manually fed.
Medusae used to study the long-term (days) and short-term (h) individual variability
˚
in digestion time were collected with a hand-held net in Vagsbøpollen, a semi-enclosed small bay near Raunefjorden, western Norway (608139N, 58169E), in June 1995. Data on the size of the 10 medusae over the experiment are presented in Table 1. Prey zooplankton were collected with a 180-mm WP2-net in vertical hauls from ca. 30 m to the surface. The material was brought to the laboratory in a 30-l container with seawater
21 and stage V copepodids Calanus finmarchicus (average dry weight, 120mg individual ) sorted out with a wide-mouthed pipette within 1 h. New, recently collected prey material was used for each experimental day (days 1, 5 and 9, respectively). Medusae and prey were stored at 108C in a constant-temperature room prior to experiment. During each experimental day the digestion time of the medusae was measured at 3 times with 3 h between the measurements, starting the first experiment around 09.00 and the third one around 15.00. During these measurements medusae were kept on a cooling table (10628C) in 300-ml glass bowls, and three stage V copepodids C. finmarchicus were put into the manubrium of the medusae with a pipette. The stomach content was checked in a Wild M5 dissection microscope every 10 min in the beginning and every second minute when stomach content began to disappear, keeping the medusae continuously in
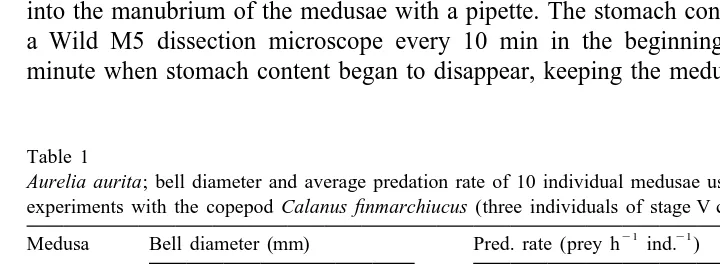
Table 1
Aurelia aurita; bell diameter and average predation rate of 10 individual medusae used in repeated digestion
a
experiments with the copepod Calanus finmarchiucus (three individuals of stage V copepodids) as prey 21 21
Medusa Bell diameter (mm) Pred. rate (prey h ind. )
Day 1 Day 5 Day 9 Days 2–4 Days 6–8
the bowls. Prey rejection only occurred a few times and then in connection with the mechanical feeding procedure. New prey was then added. We therefore never observed any lost prey in any of the experiments.
The digestion time was defined as the time of complete disintegration of prey with no solid remains. After the third measurement of an experimental day each individual
21 medusa was transferred to an aerated 10-l aquarium with 25 fresh C. finmarchicus l as food, and kept in a constant-temperature room at 108C and darkness until the next experiment. The average predation rate was calculated for the two periods between digestion experiments as the reduction in prey number per unit time (see Table 1). All medusae were healthy and active throughout the experiment and a thorough control after finished experiment indicated perfect condition of all 10 medusae.
Ephyrae originating from a laboratory stock of polyps, were reared on a diet of Artemia nauplii and natural zooplankton to small medusae in the size range 12–70 mm diameter and used in experiments where the ingestion rate was either constant or changed in a pre-defined manner (see Table 2). The medusae were used in the experiments when attaining an average diameter between 21 and 56 mm (Table 2). The medusae were kept individually in 300-ml glass bowls on a cooling table at 108C as described above. The remaining visible prey in the stomach of the medusae were counted under a stereomicroscope immediately before new prey were added, and without taking them away from the bowl. Remains in the stomach that could be identified as a prey was recorded as a present prey, even though it could be almost completely digested. One problem in displaying the results from such records then is that the continuous digestion is not reflected properly, and the plots give an impression of a discontinuous process. This will be most obvious during a low feeding intensity, when there will be few prey in the stomach, and where individual differences of only 61 prey in the stomach content may change the calculated digestion time to double or half. However, this has no implication for the precision in the experimental method described in the paper, where only end-point measurements are used.
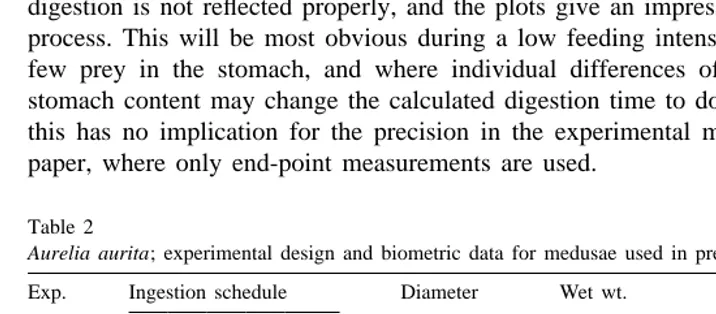
Table 2
a
Aurelia aurita; experimental design and biometric data for medusae used in predefined ingestion schedules
Exp. Ingestion schedule Diameter Wet wt. Dry wt. AFDW
Direct measurements of the digestion time of C. finmarchicus fed with 1, 2, 4 or 8 prey was done on separate medusae in the size range 16–51 mm diameter (n56 or 8 medusae per meal size), using the same technique as described above.
3. Results
3.1. Short- and long-term variability in digestion time of a single meal
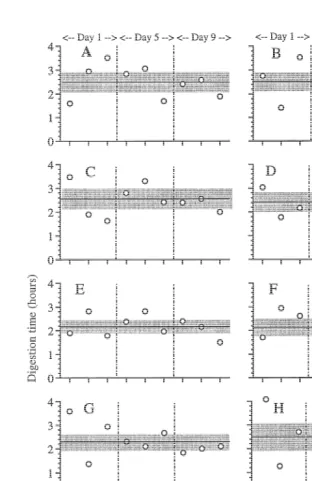
The specific test of the individual variability in digestion time showed that high variability was an inherent factor (Fig. 1). The medusa showed some variability in
21 feeding intensity between the experiments, ranging from 0.63 to 1.33 prey h as an average value for the two periods between experimental days (Table 1, average of the two last columns). The average digestion time for the 10 individuals over the 9-day experiment was less variable, ranging from 2.14 to 2.51 h, and with no significant difference between them (t-test, P.0.05). All medusae showed overlapping 95% confidence intervals, and high variability, both within the same day and between different days (Fig. 1), with a range in digestion time from 1.3 to 4.0 h. The total material showed no significant relationship between digestion time and time of the day (two-way ANOVA, P50.870) and average values were 2.42, 2.35 and 2.35 h for morning, noon and afternoon experiments, respectively. However, there was a significant difference between the different experimental days (two-way ANOVA, P50.028) and a significant interaction between day number and time of the day (P50.032). Average value for days 1, 5 and 9 was 2.51, 2.48 and 2.14 h, respectively. These differences were small and a post-hoc test (Sheffe’s test) did not reveal significant differences between any of the 3 days, although the difference between days 1 and 9 was close to the significance level of 0.05.
3.2. Digestion time of different sizes of meals
Direct measurements of the digestion time for the four groups of medusae that were given a single meal of 1, 2, 4 or 8 copepods showed overlapping ranges. With a 1-prey meal the digestion time ranged from 2.2 to 3.5 h (mean, 2.8 h, n56), whereas for a 2-prey meal digestion time ranged from 1.8 to 2.3 h (mean, 2.0 h, n56). A 4-prey meal was digested in 2.3–3.2 h (mean, 2.7 h, n58) and an 8-prey meal needed 2.1–4.2 h (mean, 3.1 h, n56) for complete digestion. A correlation analysis of the average values
2
did not reveal any significant effect of meal size (t-test on r , P.0.05).
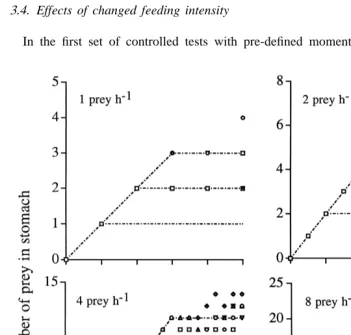
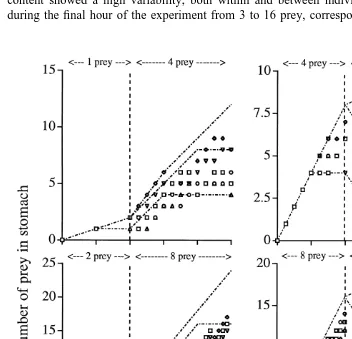
3.3. Variability during constant feeding
2 and 3 h (Fig. 2, upper left). With doubled feeding intensity the results indicated even larger individual variability and a stabilisation between 1 and 3 prey in the stomach, corresponding to digestion times of 0.5–1.5 h (Fig. 2, upper right). With a further
21
doubling in the feeding intensity (4 copepods h , lower left) the stomach stabilised between 10 and 14 prey, corresponding to digestion times from 2.5 to 3.5 h. With the
21
highest feeding intensity (8 copepods h , lower right) the stomach content showed individual variability after the first hour, ranging from 8 to 16 prey, and corresponding to a range in digestion time from 1 to 2 h.
3.4. Effects of changed feeding intensity
In the first set of controlled tests with pre-defined momentary changes in feeding
Fig. 2. Aurelia aurita; number of prey (stage V copepodids Calanus finmarchicus) remaining in the stomach 21
intensity (see Table 2), the switch to a new feeding intensity was defined to 2 h after the start of feeding and the total experimental time was 5 h. The stomach content of these medusae did not strictly follow a theoretical schedule and individual variability in stomach content was large (Fig. 3). With a switch from low to medium ingestion rate
21
(from 1 to 4 prey h ) stomach content of the five individuals showed a succession that could be explained by a variable digestion time within the limit 1 and 2 h (Fig. 3, upper left). With the opposite switch, prey number remained higher after the switch than
21
theoretically predicted (Fig. 3, upper right). With a switch from 2 to 8 prey h , stomach content showed a high variability, both within and between individuals, with a range during the final hour of the experiment from 3 to 16 prey, corresponding to a digestion
time of 0.5 to roughly 2.0 h (Fig. 3, lower left). Finally, with a switch from 8 to 2 prey
21
h , the variability was lower, with the stomach content during the final hour of the experiment ranging from 3 to 10 prey. The succession for some medusae were in fairly good agreement with the theoretically predicted one for a digestion time of 1–2 h (Fig. 3, lower right).
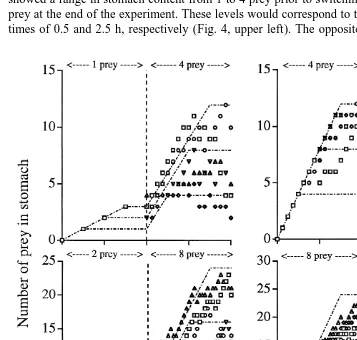
In the final experimental set, with a switched feeding intensity after 4 h and a total feeding time of 8 h, the observed stomach content showed very high individual
21 variability after the first initial hour (Fig. 4). The group switching from 1 to 4 prey h showed a range in stomach content from 1 to 4 prey prior to switching, and from 2 to 10 prey at the end of the experiment. These levels would correspond to theoretical digestion times of 0.5 and 2.5 h, respectively (Fig. 4, upper left). The opposite change in feeding
intensity (Fig. 4, upper right) gave less individual variability, but none of the five medusae followed the theoretical succession for a fixed digestion time. At the end of the experiment, individual stomach contents corresponded to a digestion time of 5–7 h. The
21
medusae that changed the feeding rate from 2 to 8 prey h , also gradually increased the stomach content, from 3 to 7 prey at the switching moment to 12–23 prey at the end of the experiment. The theoretical digestion time best describing this succession seemed to be between 1.5 and 3 h (Fig. 4, lower left). The final experiment, where the feeding
21
intensity switched from 8 to 2 prey h , gave clear evidences of high individual variability, and an inability to closely fit any underlying theoretical digestion time for most of the medusae (Fig. 4, lower right).
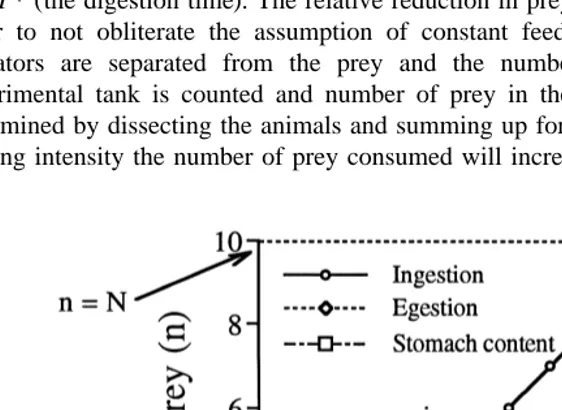
3.5. A simple experimental model to estimate digestion time
Fig. 5 gives the theoretical basis for a simple experimental method to estimate the digestion time of predators. The method assumes that the feeding intensity is constant throughout the experiment and that prey loss is solely an effect of predator consumption. A given number of predators and prey are kept together for a given time (T ), where T.T * (the digestion time). The relative reduction in prey abundance should be low, in order to not obliterate the assumption of constant feeding intensity. At time T the predators are separated from the prey and the number of prey remaining in the experimental tank is counted and number of prey in the stomach of the predators is determined by dissecting the animals and summing up for all predators. With a constant feeding intensity the number of prey consumed will increase linearly to N at the end of
the experiment. The number of prey in the stomach of the predators will increase in the same way until the digestion time (T *) is reached. From this point the ingestion will be balanced by the egestion, and there will be a steady state with a constant number of prey (N*) present in the stomach of the predators. Thus, if a constant feeding intensity holds true the digestion time can be easily estimated by using simple geometry:
N* /T *5N /T→T *5N*?T /N
The digestion rate will then be 1 /T *. The advantage of the method is that the digestion estimate is based on predators that are feeding, they can be left completely undisturbed and it is easy to get a good statistical basis for the estimate.
4. Discussion
4.1. Implications for designing digestion experiments
From the experiment on individual variability in digestion time there are several novelty results worthy of comment. First, variability in ingestion time seems to be inherent in each individual and neither related to any short- or long-term rhythm. Thus, time of the day and time spent in a given food environment do not seem to influence the digestion time of a defined meal. Second, variability between individuals at a given time also seems to be high, sometimes exceeding a factor of two. Third, average digestion time from multiple measurements over time on single individuals in a stable food environment seems to be very stable, with no significant differences between in-dividuals. All these facts have implications on how the experimental design should be defined to get a precise estimate of the digestion time of an organism. Thus, a good estimate of the digestion time of a given meal will be provided from experiments on a few individuals that are measured several times. Variability caused by difference in meal composition and meal size is not evaluated here, but must certainly be considered in studies where the food is of mixed or variable composition. Information on this topic is
˚
given for several gelatinous predators by Martinussen and Bamstedt (1999) and in references provided by these authors.
contents during incubations without food for the calculations (Kiørboe and Tisilius, 1987).
Our results from the experiments with constant feeding rate indicate that the digestion time actually can change both up and down over time in such situations, without any consistent pattern. This is thus in line with the first experiment, where it was shown a considerable random variability. The experimental implication of this then is that, even when estimating digestion time from continuously feeding animals, it is not sufficient to make single-point estimates.
The most interesting results are found in the experiments where feeding intensity was changed. Switching over from low to high feeding intensity usually gave stomach contents corresponding to realistic digestion times but the variability increased con-siderably. The opposite change, starting with high and ending with low feeding intensity, caused in a few cases an accumulation of prey in the stomach that corresponded to dramatically increased digestion times. This might be an effect similar to the one when measuring gut evacuation from non-feeding animals that have been pre-fed, where the evacuation rate is gradually reduced. The practical implication of this is that digestion experiments using animals that have decreased their feeding intensity prior to the measurements might cause a considerable positive bias. In the natural environment, food is usually patchily distributed. This will introduce high variability in the stomach content of collected animals. Using an experimentally determined digestion time from a homogeneous food environment will therefore generate bias in the ingestion estimates. This will be especially significant in situations where animals have recently left a dense patch of food (cf. Fig. 4, right panels).
4.2. Evaluating the experimental method
The present method of estimating digestion rate is synonymous to the one used by Peterson et al. (1990) and Irigoien et al. (1996), in which total production and gut contents of faecal pellets are used for the variables N and N*, respectively. A similar method was also used by Dagg and Walser (1987) and Pasternak (1994) in which chlorophyll in gut contents and faecal pellets were used for the variables N* and N, respectively. The present method has been used on the euphausiid Meganyctiphanes
˚
norvegica by Bamstedt and Karlson (1998), and they found an average digestion time of 2.15 h (n514, two outliers excluded) at 10–128C, a value in agreement with other published data for euphausiids.
Although our results show that there is a considerable variability in digestion time, even if the food composition is kept constant, and both over time and between individuals, they also show that integration over time and averaged for many individuals will give a rather robust estimate of the digestion time. Since our first experiment (Fig. 1) showed that individual differences were eliminated when averaging over time, it will be a matter of choice if the experiment is based on many replicates at a single time or fewer replicates repeatedly measured over time.
transferred to the incubation vessels, due to a gradual adaptation to the new environ-ment. If so, a prolonged incubation will reduce this bias by increasing the relative time under the new feeding intensity. If the feeding intensity is more or less randomly variable, use of a sufficiently high number of predators will be the way of eliminating this problem.
The number of predators is also important from another point of view. Suspension-feeding animals and predators taking small prey will always have many prey units (algal cells, microzooplankton, etc.) in their stomach when actively feeding, and hence, irrespective of the sampling time, stomach content will be non-zero and reflect the current feeding intensity. Nevertheless, such animals do show a considerable individual
˚ ¨
variability (cf. Bamstedt, 1988; Turner et al., 1993; but see also Paffenhofer, 1984), but this probably reflects a true individual variability in feeding intensity that can be compensated for by a large sample size. In contrast, animals taking larger prey often have a single prey unit or empty stomachs. For example Øresland (1987, 1990) recorded an average number of prey items in the guts of three chaetognath species in the ranges 0.06–0.28 (Sagitta elegans), 0.22–0.25 (S. setosa) and 0.10–0.26 (Eukrohnia hamata from Antarctic waters). Similarly Falkenhaug (1991) reported a range in mean gut contents of the Arctic form of S. elegans of 0.05–0.24 prey items. These animals also have a slow digestion, which at ambient polar temperatures may exceed 10 h (Øresland, 1990; Falkenhaug, 1991). Integrated over an extended period these animals may have a constant feeding intensity, but sampling will give many individuals with empty guts, irrespective of time. The slow digestion rate and low feeding intensity both necessitate a long incubation (T.T *) and a high number of experimental animals (N* and N sufficiently high for a good resolution in the equation).
The present method should be useful also for herbivorous zooplankton. A very simple method is then to incubate zooplankton in the algal suspension, analyse chlorophyll a in the food medium in the start and end of the experiment, and analyse the gut contents of chlorophyll a derivatives of the experimental animals in the end. The scaling of the experiment is then especially important, since the reduction in food must be significant, making a prolonged incubation or a high abundance of grazers necessary. The equation can be used to calculate the digestion time, where N* is the gut contents, expressed in chlorophyll a units and N is the reduction of food in terms of chlorophyll a, where algal growth over the incubation period has been compensated for. Alternatively, N may be estimated from the chlorophyll derivatives in the faecal pellets of the predator, as done by Dagg and Walser (1987) and Pasternak (1994), although this requires that the faecal pellets can be quantitatively recovered. When using the method based on chlorophyll a, the problem of pigment destruction has to be considered (cf. Conover et al., 1986; Head and Harris, 1996; Pasternak, 1994; Dagg et al., 1997).
5. Summary and recommendations
with the strongest effects occurring when changing from high to low feeding intensity. However, the variability in a stable environment is random, and integration over time shows only small individual differences in average digestion rate. A simple experimental method based on an assumption of constant feeding intensity can therefore be used to estimate the digestion rate from total ingestion, total stomach contents and duration of the experiment. In order to get reliable results from this method the experimental design should be optimised as follows:
• Animals with low digestion rate require long incubation time (.12 h).
• Animals with low predation rate require many individuals (.20 and preferably up to 50).
• Duration and number of prey and predators have to be adjusted in a way that makes the quantification of the reduction accurate, which is in turn a result of the method of analysis as well as errors related to sampling in the start and end of the experiment. • Duration and number of prey and predators have to be adjusted in a way that facilitates constant feeding intensity. In practice this means that prey number must not be reduced considerably over the experiment.
• Sound statistics require that several incubation tanks are run in parallel, since each tank is considered one sample unit (gives one estimate), irrespective of the number of predators included.
Acknowledgements
This paper is partly a result of research within a project on the ecological role of jellyfish, sponsored by the Norwegian Research Council, project no. 108084 / 122 [SS].
References
Bajkov, A.D., 1935. How to estimate the daily food consumption of fish under natural conditions. Trans. Am. Fish. Soc. 65, 288.
˚
Bamstedt, U., 1988. Ecological significance of individual variability in copepod bioenergetics. Hydrobiologia 167–168, 43–59.
˚
Bamstedt, U., 1998. Trophodynamics of Pleurobrachia pileus (Ctenophora, Cydippida) and ctenophore summer occurrence off the Norwegian north-west coast. Sarsia 83, 169–181.
˚
Bamstedt, U., Karlson, K., 1998. Euphausid predation on copepods in coastal waters of the Northeast Atlantic. Mar. Ecol. Prog. Ser. 172, 149–168.
Baars, M.A., Helling, G.R., 1985. Methodical problems in the measurement of phytoplankton ingestion by gut fluorescence. Hydrobiol. Bull. 19, 81–88.
Conover, R.J., Durvasula, R., Roy, S., Wang, R., 1986. Probable loss of chlorophyll-derived pigments during passage through the gut of zooplankton, and some consequences. Limnol. Oceanogr. 31, 878–887. Dagg, M.J., Walser, W.E., 1987. Ingestion, gut passage and egestion by the copepod Neocalanus plumchrus in
the laboratory and in the subarctic Pacific Ocean. Limnol. Oceanogr. 32, 178–188.
Falkenhaug, T., 1991. Prey composition and feeding rate of Sagitta elegans var. arctica (Chaetognatha) in the Barents Sea in summer. Polar Res. 10, 487–506.
Head, E.J.H., Harris, R., 1996. Chlorophyll destruction by Calanus spp. grazing on phytoplankton: kinetics, effects of ingestion rate and feeding history and a mechanistic interpretation. Mar. Ecol. Prog. Ser. 135, 223–235.
Irigoien, X., Castel, J., Gasparini, S., 1996. Gut clearance rate as predictor of food limitation situations. Application to estuarine copepods Acartia bifilosa and Eurytemora affinis. Mar. Ecol. Prog. Ser. 131, 159–163.
Kiørboe, T., Tisilius, P.T., 1987. Gut clearance and pigment destruction in a herbivorous copepod, Acartia tonsa, and the determination of in situ grazing rates. J. Plankton Res. 9, 525–534.
Mackas, D.L., Bohrer, R.N., 1976. Fluorescence analysis of zooplankton gut contents and an investigation of diel feeding patterns. J. Exp. Mar. Biol. Ecol. 25, 77–85.
˚
Martinussen, M.B., Bamstedt, U., 1995. Diet, estimated food ration and predator impact by the scyphozoan jellyfishes Aurelia aurita and Cyanea capillata. In: Skjoldal, H.R., Hopkins, C., Eirikstad, K.E., Leinaas, H.P. (Eds.), Ecology of Fjords and Coastal Waters, Elsevier, Amsterdam, pp. 127–145.
˚
Martinussen, M.B., Bamstedt, U., 1999. Nutritional ecology of gelatinous planktonic predators. Digestion rate in relation to type and amount of prey. J. Exp. Mar. Biol. Ecol. 232, 61–84.
Matsakis, S., Conover, R.J., 1991. Abundance and feeding of medusae and their potential impact as predators on other zooplankton in Bedford Basin (Nova Scotia Canada) during spring. Can. J. Fish. Aquat. Sci. 48, 1419–1430.
Øresland, V., 1987. Feeding of the chaetognaths Sagitta elegans and S. setosa at different seasons in Gullmarsfjorden Sweden. Mar. Ecol. Prog. Ser. 39, 69–79.
Øresland, V., 1990. Feeding and predation impact of the chaetognath Eukrohnia hamata in Gerlach Strait Antarctic Peninsula. Mar. Ecol. Prog. Ser. 63, 201–209.
¨
Paffenhofer, G.-A., 1984. Food ingestion by the marine planktonic copepod Paracalanus in relation to abundance and size distribution of food. Mar. Biol. 80, 323–333.
Pasternak, A.F., 1994. Gut fluorescence in herbivorous copepods: an attempt to justify the method. Hydrobiologia 292–293, 241–248.
Penry, D.L., Frost, B.W., 1990. Re-evaluation of the gut-fullness (gut fluorescence) method for inferring ingestion rates of suspension feeding copepods. Limnol. Oceanogr. 35, 1207–1214.
Peterson, W., Painting, S., Barlow, R., 1990. Feeding rates of Calanoides carinatus: a comparison of five methods including evaluation of the gut fluorescence method. Mar. Ecol. Prog. Ser. 63, 85–92. Purcell, J.E., 1981a. Dietary composition and diel feeding patterns of epipelagic siphonophores. Mar. Biol. 65,
83–90.
Purcell, J.E., 1981b. Feeding biology of Rhizophysa eysenhardti, a siphonophore predator of fish larvae. Limnol. Oceanogr. 26, 424–432.
Purcell, J.E., 1981c. Selective predation and caloric consumption by the siphonophore Rosacea cyinbiformis in nature. Mar. Biol. 63, 283–294.
Purcell, J.E., 1982. Feeding and growth of the siphonophore Muggiaea atlantica (Cunningham 1893). J. Exp. Mar. Biol. Ecol. 62, 39–54.
Purcell, J.E., 1984. Predation on fish larvae by Physalia physalis, the Portuguese man of war. Mar. Ecol. Prog. Ser. 19, 189–191.
Purcell, J.E., Kremer, P., 1983. Feeding and metabolism of the siphonophore Sphaeronectes gracilis. J. Plankton Res. 5, 95–106.