PHENOLOGICAL TRACKING OF AGRICULTURAL FEILDS INVESTIGATED BY
USING DUAL POLARIMETRY TANDEM-X IMAGES
S. Mirzaee a, *, M. Motagh b, H. Arefi a, A. Nooryazdan c
a University of Tehran, Dept. of Surveying and Geomatics Eng., Tehran, Iran - (saramirzaee, hossein.arefi)@ut.ac.ir b GFZ German Research Centre for Geosciences, Section of Remote Sensing, 14473, Potsdam, Germany - [email protected]
c Forest, Range and Watershed Management of Iran, Lorestan province - [email protected]
KEY WORDS: TanDEM-X, Interferometric Coherence, Phenological Change
ABSTRACT:
Remote sensing plays a key role in monitoring and assessing environmental changes. Because of its special imaging characteristics such as high-resolution, capabilities to obtain data in all weather conditions and sensitivity to geometrical and dielectric properties of the features, Synthetic Aperture Radar (SAR) technology has become a powerful technique to detect small scale changes related to earth surface.SAR images contain the information of both phase and intensity in different modes like single, dual and full polarimetric states which are important in order to extract information about various targets. In this study we investigate phenological changes in an agricultural region using high-resolution X-band SAR data. The case study is located in Doroud region of Lorestan province, west of Iran. The purpose is to investigate the ability of copolar and interferometric coherence extracted from TanDEM-X dual polarimetry (HH/VV) in bistatic StripMap mode for tracking the phenological changes of crops during growing season. The data include 11 images acquired between 12.06.2012 and 02.11.2012 and 6 images acquired between 30.05.2013 and 04.08.2013 in the CoSSC format. Results show that copolar coherence is almost able to follow phenological changes but interferometric coherence has a near constant behaviour with fluctuations mainly related to baseline variations.
* Corresponding author
1. INTRODUCTION
Agricultural monitoring is important as it is directly related to human food supply. In recent years much attention has been paid on monitoring phenological changes and classification of different crop types using remote sensing observations (Bouvet and Le Toan, 2009; Hoekman, 2003; Liu et al., 2013; Juan M. Lopez-Sanchez et al., 2011). Issues like recognizing growth behaviour, cultivation problems and crop yield estimation have been worked by different researchers (Dhar et al., 2009; Ferencz et al., 2004; Silleos et al., 2002). Among different sensor data, radar remote sensing with its reliable and frequent imaging capability all-weather functionality, sensitivity to target geometrical structure and orientation, has enhanced further our capabilities for agricultural monitoring.
Sabour et al.,( 2007) used dual polarization HH/VH time series of ENVISAT data for classification of crop types. Koppe et al., (2012) investigated the behaviour of X-band backscattering values over rice fields in different phenological states Zhao et al., (2014) discussed about the feasibility of C- and X-band polarimetric SAR images for crop harvest pattern recognition. Voormansik et al., (2013) investigated the capability of dual polarimetry TerraSAR-X (TSX) images for detecting grassland cutting practices.
In this research we evaluated polarimetric and interferometric coherence for monitoring phenological changes of different crop types. For this purpose we used TanDEM-X dual polarized (HH/VV) images in bistatic StripMap mode, provided by German aerospace centre (DLR). In order to study the agricultural fields, a classification was first done to distinguish different crop types, and then time series of coherence values
were plotted for each crop. Finally a comparison was done between copolar and interferometric coherences.
2. PHENOLOGICAL TRACKING 2.1 Data
The dataset includes 17 TDX StripMap images in bistatic and coherent dual polarimetry (HH/VV) mode. 11 images cover the time interval from Jun 12th to November 2nd 2012 while the other 6 images cover from May 30th to August 4th 2013. All images were acquired in a descending mode at 07:25 local time (02:55 UTC) with a scene centre incidence angle of 22º and in coregistered single look slant range complex (CoSSC) format. Average range and azimuth spacing are 0.9m and 2.4 m respectively. Acquisition intervals are not equal, most of them are 11 days separated but some of them have an interval of 22 to 33 days. Bistatic baselines are listed in Table 1.
2.2 Study area
Our test site is located in the north east of Doroud city in Lorestan province, Iran. It is located in a region with centre coordinate of 33°31'55.00"N, 49° 6'8.00"E. The area includes agricultural fields with different crop types, which are mostly cereals and beans, rice and alfalfa. Figure 1 shows the study area with the TDX image of July 26th 2012 overlapped on Google earth.
The International Archives of the Photogrammetry, Remote Sensing and Spatial Information Sciences, Volume XL-7/W3, 2015 36th International Symposium on Remote Sensing of Environment, 11–15 May 2015, Berlin, Germany
This contribution has been peer-reviewed.
Acquisition date Baseline (m) HOA (m)
06.12.2012 262.34 11.87 23.06.2012 260.98 11.94 15.07.2012 251.89 12.36 26.07.2012 243.09 12.82 06.08.2012 246.36 12.63 17.08.2012 234.48 13.28 28.08.2012 231.36 13.47 08.09.2012 226.51 13.75 11.10.2012 206.59 15.07 22.10.2012 191.92 16.23 02.11.2012 181.55 17.16 30.05.2013 104.61 29.74 21.06.2013 101.45 30.68 02.07.2013 102.79 30.30
13.07.2013 55.59 56.01
24.07.2013 50.39 61.75
04.08.2013 43.92 70.87
Table 1: Dataset acquisition with bistatic baselines and height of ambiguities
Figure 1: TSX amplitude image of July 26th 2012 over google earth image in Doroud and the subset area shown with RGB colour composite in Pauli basis over the agricultural fields.
2.3 Methodology
As different crop types have non-similar structure and phenological behaviour, a supervised classification with SVM classifier was first applied to separate crop classes. The classification was done for the two years by using polarimetric features of one satellite images (TSX). The procedure has been defined in the previous paper of Mirzaee et al., (2014). Then two types of coherence values were plotted for each class, which are copolar coherence with HH and VV channels of TSX, and interferometric coherence of HH and also VV of two satellites (TSX and TDX). The equation used for calculation of copolar coherence is as follows
2 VV 2 HH
VV HH HHVV
S S
S
S
(1)
Interferometric coherence is calculated with the same equation but instead of using HH and VV channels of one satellite, we use HH or VV channels of two satellites. Coherence values are averaged over each class and plotted through time.
3. RESULTS AND DISCUSSION
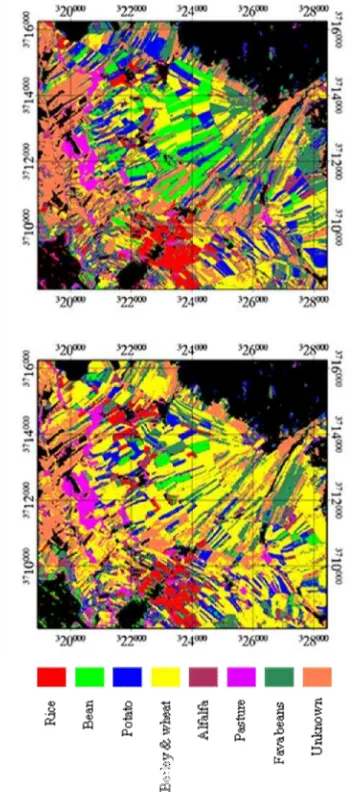
The overall accuracy obtained for classification was about 93% for 2012 and 90% for 2013. Classified map of each year is represented in Figure 2.
Figure 2: Classification map of the year 2012 (on the top) and 2013 (on the bottom)
As we can see from the results, the final classification map does not follow a specific pattern. The changes are due to alternating cultivation between crops. In this region farmers do not always cultivate a specific plant in order to save the quality of soil. So crop types like wheat, barley and beans are implanted alternatively in a field every 2 to 4 years. This is an important issue for the image preparation. Mapping crop types in an area through phenological changes requires acquiring dataset within The International Archives of the Photogrammetry, Remote Sensing and Spatial Information Sciences, Volume XL-7/W3, 2015
36th International Symposium on Remote Sensing of Environment, 11–15 May 2015, Berlin, Germany
This contribution has been peer-reviewed.
one agricultural season in order to not have any changes, in particular for the areas with diversity of crop cultivation.
Time series of copolar coherence is shown in Figure 3 and interferometric coherence is shown in Figure 4.
Figure 3: Copolar coherence time series for different crop types
Generally, the agricultural period divides into three main phenological stages: vegetative, reproductive and mature phase. At the vegetative phase crop height increases. The appearance of leaves and panicles occurs at the reproductive phase, and then at mature phase grains develop until harvesting.
The dataset includes almost all classes’ phenological cycle except of the cereals (barley and wheat) which includes only the mature phase. The winter type of cereals, are implanted in November and December. Therefore their main growth period begins at the late march when the crop height increases. Plants are ready to harvest at the late June, so the harvest begins at day of year 160.
The rice class has distinguished properties compared to other classes due to presence of water and double bounce scattering mechanism. As it is stated by other researchers (Choudhury and Parihar, 2007; Lopez-Sanchez and Ballester-Berman, 2010), due to the single scattering mechanism of the rough water surface, the coherence between copular channels has a value of about 0.6 at the beginning of the vegetative phase. Once the plants are emerged, the copolar coherence decreases to less than 0.4 until the end of reproductive phase (doy 240). The decrement of coherence is partly due to high differential attenuation of HH and VV and partly to random volume scattering (Lopez-Sanchez et al.,2011). In the maturation phase, plant water content and also differential attenuation decrease, so backscattering values of two polarimetric channels become close to each other and copolar coherence begins to increase until the time of harvest.
Beans are implanted at the late spring. This crop type needs regular irrigation and lots of water at the vegetative phase. At the beginning of the vegetative phase, leaves grow and crop height increases. This continues until 30 to 40 days after implantation (day of year 200). During this period the volume
scattering increases so it leads to a decreasing trend in copolar coherence.
Figure 4: Interferometric coherence time series for different crop types, HH coherence in the top and VV in the bottom
As flower buds emerge and flowers open, after a month, petals start to fall and dry and also pods develop until the end of season and harvest time. During this period copolar coherence gradually increases due to dry volume of plant.
Potato and cereals also have similar trends but with different values. As far as the dataset only covers the end of growing season for cereals, we can see the increasing trend of copolar coherence as a result of dry and dense volume of plants until the harvest time.
Alfalfa is grown and harvested repeatedly during the vegetative season. So this plant’s average curve does not have a clear trend and it is full of deviations.
The class which is named Fava beans actually consists of two classes. Fava beans are usually cultivated before wheat or barley to prepare and richen the soil. Its period of cultivation begins at late November and it is harvested until the end of May. After that the spring cereals cultivation begins. So an increasing trend related to the end of Fava beans class followed by a decrease and increase trend related to spring cereals are detected. About the interferometric coherences which were calculated for both channels and are depicted in Figure 4, the assumption was that it should follow the height changes of crops, in a way that by increasing the plant height and due to creation of a The International Archives of the Photogrammetry, Remote Sensing and Spatial Information Sciences, Volume XL-7/W3, 2015
36th International Symposium on Remote Sensing of Environment, 11–15 May 2015, Berlin, Germany
This contribution has been peer-reviewed.
volumetric layer of plants, the interferometric coherence should decrease. The most obvious behaviour in the results is that the interferometric coherence values highly depend on the baseline values, as the 2013 coherence values are all higher than 2012 values and their baselines are smaller.
Almost every class has a constant value over time except in the special occasions like the presence of water in the beginning of rice growth cycle, which results in lower values of interferometric coherence.
Among all the classes, pasture has the least coherence values that may be because of semi-moist properties of such lands. The last issue is that because of differential attenuation between two polarimetric channels and also moisture conditions, the interferometric coherence values of HH and VV have a slight difference and it has a random behaviour as it is not similar for all the classes.
4. CONCLUSION
In this research we investigated the behaviour of different copolar and interferometric coherence values over agricultural fields. Results showed that the copolar coherence between polarimetric channels of one satellite (TSX) can almost track the changes and it is able to distinguish different crop types through their special characteristics resulting different behaviours in time.
The interferometric coherence on the other hand, has almost constant behaviour through time for each class except when there is a special occasion like the presence of water in the beginning of rice plant growing cycle. Also the interferometric coherences of HH and VV channels have almost similar trends with slight differences which may be the result of differential attenuation and also plant moisture content.
ACKNOWLEDGEMENTS
The copyright of SAR data belongs to DLR (German Aerospace Center) and was provided under the research proposal XTI_LAND0505.
REFERENCES
Bouvet, a., Le Toan, T., 2009. Monitoring of the Rice Cropping System in the Mekong Delta Using ENVISAT/ASAR Dual Polarization Data. IEEE Trans. Geosci. Remote Sens. 47, 517–526. doi:10.1109/TGRS.2008.2007963
Choudhury, I., Parihar, J.S., 2007. ESTIMATION OF RICE GROWTH PARAMETER AND CROP PHENOLOGY WITH conjucative use of radarsat and envisat, in: Envisat Symp.
Dhar, T., Gray, D., Menges, C., 2009. Agricultural performance monitoring with polarimetric SAR and optical imagery. Proc. 4th Int. Work. Sci. Appl. SAR Polarim. Polarim. Interferom. 26–30.
Ferencz, C., Bognár, P., Lichtenberger, J., Hamar, D., Tarcsai†, G., Timár, G., Molnár, G., Pásztor, S., Steinbach, P., Székely, B., Ferencz, O.E., Ferencz-Árkos, I., 2004. Crop yield estimation by satellite remote sensing. Int. J. Remote Sens. doi:10.1080/01431160410001698870
Hoekman, D.H., 2003. A new polarimetric classification approach evaluated for agricultural crops, in: European Space Agency, (Special Publication) ESA SP. pp. 71–79. doi:10.1109/TGRS.2003.817795
Koppe, W., Gnyp, M.L., Hütt, C., Yao, Y., Miao, Y., Chen, X., Bareth, G., 2012. Rice monitoring with multi-temporal and dual-polarimetric terrasar-X data. Int. J. Appl. Earth Obs. Geoinf. 21, 568–576.
doi:10.1016/j.jag.2012.07.016
Liu, C., Shang, J., Vachon, P.W., McNairn, H., 2013. Multiyear Crop Monitoring Using Polarimetric RADARSAT-2 Data. IEEE Trans. Geosci. Remote Sens. 51, 2227–2240. doi:10.1109/TGRS.2012.2208649
Lopez-Sanchez, J., Ballester-Berman, J., 2010. An advanced electromagnetic model for rice fields at X-band: Development and interpretation of dual-pol TerraSAR-X images. EUSAR 2010 754–757.
Lopez-Sanchez, J.M., Ballester-Berman, J.D., Cloude, S.R., 2011. Monitoring and retrieving rice phenology by means of satellite SAR polarimetry at X-band. Int. Geosci. Remote Sens. Symp. 2741–2744. doi:10.1109/IGARSS.2011.6049781
Lopez-Sanchez, J.M., Ballester-Berman, J.D., Hajnsek, I., 2011. First results of rice monitoring practices in Spain by means of time series of TerraSAR-X dual-pol images, in: IEEE Journal of Selected Topics in Applied Earth Observations and Remote Sensing. pp. 412–422. doi:10.1109/JSTARS.2010.2047634
Mirzaee, S., Motagh, M., Arefi, H., Nooryazdan, M., 2014. Classification of agricultural fields using time series of dual polarimetry TerraSAR-X images. ISPRS - Int. Arch. Photogramm. Remote Sens. Spat. Inf. Sci. XL-2/W3, 191–196. doi:10.5194/isprsarchives-XL-2-W3-191-2014
Sabour, S.M.T., Lohmann, P., Soergel, U., 2007. Monitoring agricultural activities using ASAR ENVISAT data, in: European Space Agency, (Special Publication) ESA SP.
Silleos, N., Perakis, K., Petsanis, G., 2002. Assessment of crop damage using space remote sensing and GIS. Int. J. Remote Sens. doi:10.1080/01431160110040026
Voormansik, K., Jagdhuber, T., Olesk, A., Hajnsek, I., Papathanassiou, K.P., 2013. Towards a detection of grassland cutting practices with dual polarimetric TerraSAR-X data. Int. J. Remote Sens. 34, 8081–8103. doi:10.1080/01431161.2013.829593
Zhao, L., Yang, J., Li, P., Zhang, L., 2014. Characteristics Analysis and Classification of Crop Harvest Patterns by Exploiting High-Frequency MultiPolarization SAR Data. IEEE J. Sel. Top. Appl. Earth Obs. Remote Sens. 1–1. doi:10.1109/JSTARS.2014.2308273
The International Archives of the Photogrammetry, Remote Sensing and Spatial Information Sciences, Volume XL-7/W3, 2015 36th International Symposium on Remote Sensing of Environment, 11–15 May 2015, Berlin, Germany
This contribution has been peer-reviewed.