Leaching of nitrogen in Swedish agriculture — a historical perspective
M. Hoffmann
a,∗, H. Johnsson
a, A. Gustafson
a, A. Grimvall
baDepartment of Soil Sciences, Division of Water Quality Management, Swedish University of Agricultural Sciences,
P.O. Box 7072, SE-750 07 Uppsala, Sweden
bDepartment of Mathematics, Division of Statistics, Linköping University, SE-581 83 Linköping, Sweden
Received 26 April 1999; received in revised form 5 January 2000; accepted 15 March 2000
Abstract
There is a need to examine long-term changes in nitrogen leaching from arable soils. The purpose of this study was to analyse variations in specific leaching rates (kg ha−1per year) and gross load (Mg per year) of N from arable land to watercourses in Sweden from a historical perspective. The start of the study was set to 1865 because information on crop distribution, yield and livestock has been compiled yearly since then. The SOIL/SOILN model was used to calculate nitrogen leaching. Calculations were done for cereals, grass and bare fallow for three different soil types in nine agricultural regions covering a range of climatic conditions. Results indicate that both specific leaching rates and gross load of nitrogen in the middle of 19th century were approximately the same as they are today for the whole of south and central Sweden. Three main explanations for this were (1) large areas of bare fallow typical for the farming practice at the time; (2) enhanced mineralisation from newly cultivated land; and (3) low yield . From 1865, i.e. the start of the calculations, N leaching rates decreased and were at their lowest around 1930. During the same period, gross load was also at its lowest despite the fact that the acreage of arable land was at its most extensive. After 1930, average leaching increased by 60% and gross load by 30%, both reaching a peak in the mid-1970s to be followed by a declining trend. The greatest increase in leaching was in regions where the increase in animal density was largest and these regions were also those where the natural conditions for leaching such as mild winters and coarse-textured soils were found. Extensive draining projects occurred during the period of investigation, in particular an intensive exploitation of lakes and wetlands. This caused a substantial drop in nitrogen retention and the probable increase in net load to the sea might thus have been more affected by this decrease in retention than the actual increase in gross load. © 2000 Elsevier Science B.V. All rights reserved.
Keywords:Agricultural land; Gross load; Long-term modeling; Nitrogen leaching; Sweden
1. Introduction
Modern agriculture is normally supported by a high input of N fertilisers, and numerous studies have demonstrated that losses of N from arable land to
∗Corresponding author. Tel.:+46-8-787-54-44; fax:+46-8-24-81-19.
E-mail address:[email protected] (M. Hoffmann)
water can be substantial. In Sweden, average leaching root zone of N is estimated to be 22 kg N ha−1per year (Johnsson and Hoffmann, 1998). Long-term average measured N concentration in drainage waters varies from 4 to 23 mg l−1 (Johansson et al., 1999). Nitrate concentration in groundwater is less of a concern in Sweden compared to many other countries because of low population density, and because about half the drinking water is supplied from surface waters such
as lakes, where nitrate concentrations generally are low. However, locally in agricultural areas in southern Sweden, nitrate in groundwater is a concern and it is estimated that about 100 000 people have private wells with nitrate concentrations well above 50 mg l−1 (Thoms and Joelsson, 1982). For these reasons, the fo-cus in Sweden is mostly on agricultural N load to the Baltic Sea instead of nitrate pollution of groundwater. Water quality data from major European rivers, such as the Rhine and the Daugava, indicate that a major increase in riverine loads of N coincided with the in-creased use of commercial fertilisers during the first decades of the post-war period (Tsirkunov et al., 1992; Grimvall et al., 2000). However, the relationship be-tween N input to agriculture and export of N from land to sea is complex. Firstly, the turnover of N in soil involves a variety of different processes operating on a wide range of time-scales. Secondly, long-term changes in riverine loads of N may, at least in part, be due to drainage of agricultural land, ditching of wetlands and other measures that influence the reten-tion of N during transport from field to river mouth. Thirdly, the classic experiments at Rothamsted indi-cate that, due to a less efficient N uptake in crops, losses of this element from arable land to water were already considerable in the 19th century (Lawes et al., 1881). Another reason for taking a historic view of N leaching from arable land is that most of the arable land in Sweden is situated within the catchment of the Baltic Sea. The Baltic is often considered to have been in a more healthy condition in the first half of the 20th century. Since agriculture today is considered to be the largest single source of N outlet to the Baltic Sea, it is important to study change in N load from agriculture over a longer time perspective. This will increase overall understanding of the causes of dete-riorating water quality in the Baltic Sea.
Hence, there is a great need for a closer examination of long-term changes in the leaching of N from arable soils. No systematic study of this has previously been done for Swedish conditions.
Only a few monitoring data are available before the 1970s. Sondén (1912) was one of the first researchers in Sweden to compile water quality analyses for a large number of lakes and rivers, but without pointing out any particular source such as agriculture. Arrhe-nius (1954) investigated nitrate concentrations in dug wells and suggested that there was an influence of
nitrate originating from arable land. One of the first measurements of nitrate leaching from arable land was conducted in 1949/1950 by Wiklander and Wall-gren (1960), who estimated nitrate leaching of 4 kg
NO3–N ha−1 with 123 mm discharge on a clay soil
in central Sweden. Wiklander and Wallgren (1970) collected 358 samples of drainage water throughout Sweden in 1965 and concluded from their own cal-culations that minimum and maximum N leaching
varied between 4 and 8 kg ha−1 on average for the
whole country, and between 8 and 17 kg ha−1 in the county of Skåne, south of Sweden. From these few and scattered measurements, it is difficult to draw any conclusions concerning N leaching in the past. The current systematic monitoring programmes were started at the beginning of the 1970s.
For the purpose of this study, past N leaching was estimated by combining agricultural statistics with a process-oriented model of the turnover of N in arable soils. An internationally unique collection of agricul-tural statistics, going as far back as 1865, makes Swe-den an excellent case for such a study. Data regarding land use, fertiliser application, livestock density, crop distribution and crop yields were used as model inputs together with soil characteristics and climate data. N losses from the root zone of arable land were then es-timated using the SOIL/SOILN model (Jansson and Halldin, 1979; Johnsson et al., 1987) of the vertical transport of water and N through profiles of arable soils.
2. Materials and methods
2.1. Calculation of leaching estimates
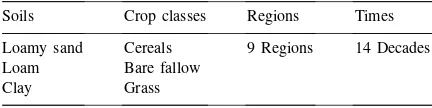
Leaching estimates were calculated for three dif-ferent soil types, nine difdif-ferent leaching regions, three crops and 14 decades (Table 1). The different
Table 1
Calculations were made for each combination of these factors used as a framework for the calculations
Soils Crop classes Regions Times
Loamy sand Cereals 9 Regions 14 Decades Loam Bare fallow
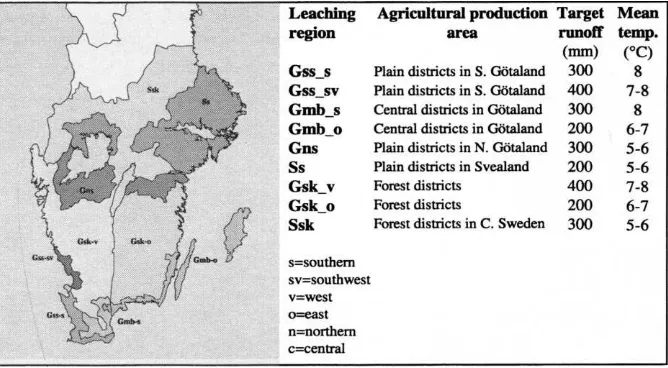
Fig. 1. Leaching regions for which calculations were done. The regions were separated by differences in discharge of water and annual temperature.
regions (Fig. 1) were characterised by differences in annual precipitation (600–1000 mm) and discharge
(200–400 mm), annual mean temperature (6–8◦C)
and crop management. More detailed information concerning the leaching regions is given in Johnsson and Hoffmann (1998). A 10-year weather period was used for each regional calculation; this was consid-ered to represent a ‘normal’ climate reasonably well. The same weather period was used for calculations for all decades. Three crops dominated the use of arable land during the period investigated. For each combination in the matrix, the leaching estimate was calculated by averaging a simulation over the 10-year period using the same management practices (crop and fertilisation) every year (Hoffmann and Johnsson, 1999). No consideration was taken of crop rotation. Since the acreage of sugar beets (Beta vulgaris), pota-toes (Solanum tuberosum) and oil plants was small, the most common preceding crop in the rotation was the one which did not have a strong carry-over effect of N to the following crop in rotation. The two most common patterns of cultivation are cereals with ce-reals as the preceding crop, and grass with grass as the preceding crop. Therefore, it was assumed that there was no significant effect from the preceding crop on the actual leaching rate. Since the acreage of ploughed grass and that of under-sown grass in cereals were equal, this under- and overestimation of
leaching were considered to have compensated for each other in this study.
Dates for sowing and harvesting, i.e. times for the start and end of plant uptake of N, in the different regions were the same as those used in the study by Johnsson and Hoffmann (1998). Fertiliser N was ap-plied according to normal practice at the time of sow-ing, and it was assumed that all manure was applied during spring operations. In addition, it was assumed that the amount of manure produced and fertiliser N used was evenly distributed to all arable land in each region.
and manure was calculated as for cereals. The N fixa-tion of clover varied from 29 to 48 kg N ha−1per year in the different regions.
2.2. Input data
A complete description of the method and parameter settings is given in Johnsson and Hoffmann (1998). Input data and parameter settings that are unique for this study are described below and in accompanying tables and figures.
2.2.1. Harvest export of N
Total plant uptake was calculated based on yield data obtained from official statistics. Average yield of grain for each decade was calculated using data on ac-tual yields (BiSOS-N, 1865–1905; SOS, 1915–1955; Statistics Sweden, 1965–1995). Since yields for spe-cific years deviate a lot, average yields for 3 years in the middle of each decade were used.
The amount of N exported with harvested products depends not only on yield but also on the N content in the product. It was assumed that the N concentra-tion was different from today. Hansson (1912) com-piled data on N content in most agricultural products. These data were used for the period 1865–1925. Data for current N content was collected from Haak (1993, manuscript) and the Swedish Board of Agriculture (1997). The change in N concentration between 1925 and 1995 was assumed to roughly correspond to the use of fertiliser N.
Fig. 2. Change in animal density in animal units per ha for the whole of Sweden and in some counties. One animal unit is one cow. 10 fattening pigs. three sows and 100 laying hens. Sweden is third line from the bottom.
2.2.2. Input of N from manure
Until 1920–1930 manure was almost exclusively used to fertilise the soil. The estimate of the amount of manure produced between 1927 and 1992 was based on a previous study (Statistics Sweden, 1995). The amount of manure produced per animal unit for 1927 was calculated from data obtained from Statistics Swe-den (1995). The amount of manure for each decade from 1925 back to 1865 was calculated by extrapo-lating the number of animal units using countywide statistics (Fig. 2) for livestock (BiSOS-N, 1865–1905; SOS, 1915–1955). Not only did the number of animal units change but so also did the N content in manure. A correlation between milk production and N content in manure from dairy cows was used to estimate change in N content in manure. It was roughly assumed that for every 1000 kg increase in yearly milk production, N in manure increased by 20 kg (Steineck, 1997, per-sonal communication). Data for yearly milk produc-tion per cow were obtained from Statistics Sweden (1959). Most of the manure came from cows and the N content in manure from other animals was assumed to have changed similarly.
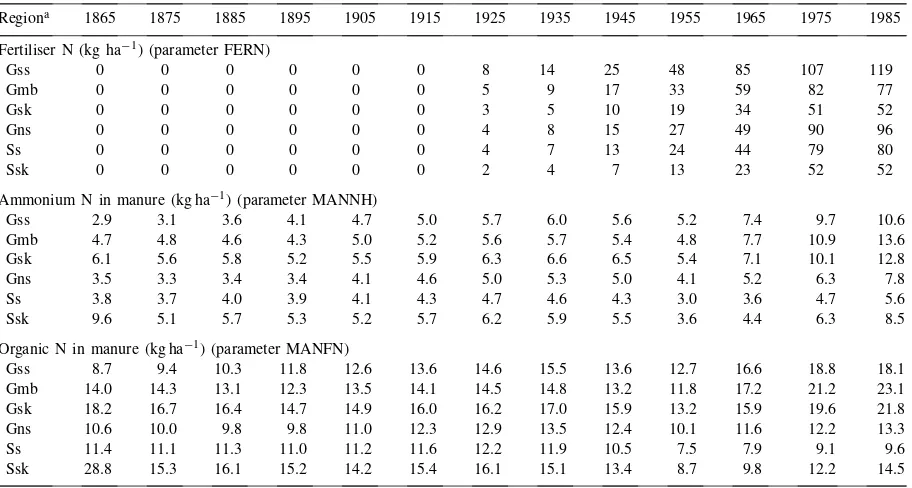
Table 2
Input of N by fertiliser and manure for the different regions in Sweden
Regiona 1865 1875 1885 1895 1905 1915 1925 1935 1945 1955 1965 1975 1985
Fertiliser N (kg ha−1) (parameter FERN)
Gss 0 0 0 0 0 0 8 14 25 48 85 107 119
Gmb 0 0 0 0 0 0 5 9 17 33 59 82 77
Gsk 0 0 0 0 0 0 3 5 10 19 34 51 52
Gns 0 0 0 0 0 0 4 8 15 27 49 90 96
Ss 0 0 0 0 0 0 4 7 13 24 44 79 80
Ssk 0 0 0 0 0 0 2 4 7 13 23 52 52
Ammonium N in manure (kg ha−1) (parameter MANNH)
Gss 2.9 3.1 3.6 4.1 4.7 5.0 5.7 6.0 5.6 5.2 7.4 9.7 10.6
Gmb 4.7 4.8 4.6 4.3 5.0 5.2 5.6 5.7 5.4 4.8 7.7 10.9 13.6
Gsk 6.1 5.6 5.8 5.2 5.5 5.9 6.3 6.6 6.5 5.4 7.1 10.1 12.8
Gns 3.5 3.3 3.4 3.4 4.1 4.6 5.0 5.3 5.0 4.1 5.2 6.3 7.8
Ss 3.8 3.7 4.0 3.9 4.1 4.3 4.7 4.6 4.3 3.0 3.6 4.7 5.6
Ssk 9.6 5.1 5.7 5.3 5.2 5.7 6.2 5.9 5.5 3.6 4.4 6.3 8.5
Organic N in manure (kg ha−1) (parameter MANFN)
Gss 8.7 9.4 10.3 11.8 12.6 13.6 14.6 15.5 13.6 12.7 16.6 18.8 18.1
Gmb 14.0 14.3 13.1 12.3 13.5 14.1 14.5 14.8 13.2 11.8 17.2 21.2 23.1
Gsk 18.2 16.7 16.4 14.7 14.9 16.0 16.2 17.0 15.9 13.2 15.9 19.6 21.8
Gns 10.6 10.0 9.8 9.8 11.0 12.3 12.9 13.5 12.4 10.1 11.6 12.2 13.3
Ss 11.4 11.1 11.3 11.0 11.2 11.6 12.2 11.9 10.5 7.5 7.9 9.1 9.6
Ssk 28.8 15.3 16.1 15.2 14.2 15.4 16.1 15.1 13.4 8.7 9.8 12.2 14.5
aThe abbreviations in the column are for each of the regions which are illustrated in Fig. 1.
1865 and 1945 was assumed to be the same as in 1951 (45%). Ammonia emissions between 1951 and 1994 were assumed to decrease linearly from 45 to 35%.
The relation between organic N and ammonium N in manure changed during the period of this investiga-tion. The fraction of ammonium N in manure in 1865 was assumed to be 25%, which is typical for farmyard manure. The present average content of ammonium N was set at 40%. Input of N from manure is accounted for in Table 2.
2.2.3. Input from fertiliser N
Data on the usage of fertiliser N was collected from sales statistics (Statistics Sweden, 1995). County data were available from 1965; before 1965 only aggre-gated data for the whole country existed. When deriv-ing countywide values on fertiliser use in the decades before 1965, it was assumed that the inter-county re-lationship was the same as for 1965. The use in the counties was then adjusted to reflect the change in sales for the whole country. To obtain fertiliser use for production areas the 20 counties were aggregated to six production areas. This was done by weighting
fertiliser use in each county by that county’s acreage of arable land (Table 2).
2.2.4. Soil organic N and mineralisation rate Assumptions concerning the amount of organic N in the soil profile and the mineralisation rate are decisive to the result of the calculated leaching estimates.
denitri-Fig. 3. Change over time in total area of arable land and in area of bare fallow. grass and arable crops in Sweden.
fication and harvest export. A decline of up to 35%, which is common, represents a loss of 3–4 Mg N ha−1. In this study, SOM was assumed to decline by 35% in the first 30 years after ploughing. This is in accor-dance with the findings from a Swedish field experi-ment where decline in organic carbon was measured (Persson, 1978). The decline in soil organic N was as-sumed to be proportional to the decline in soil organic carbon by assuming a constant C/N ratio of 10. The bulk density of the soil was assumed to be 10% less in
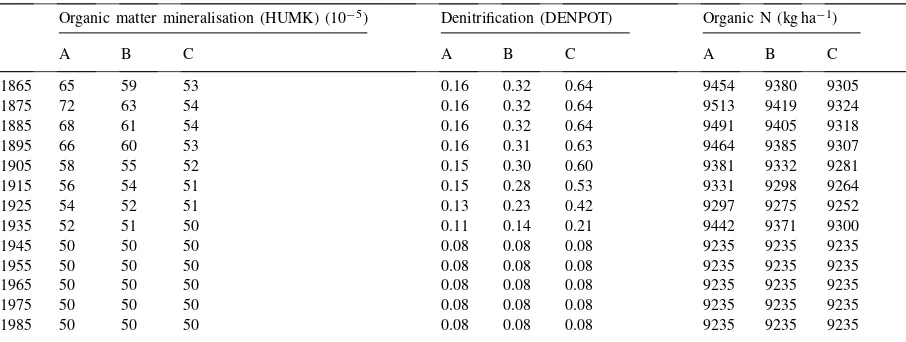
Table 3
Parameter values of soil organic matter mineralisation rate constant. potential denitrification and content of organic N (0–100 cm soil depth) in the parameter settingsa
Organic matter mineralisation (HUMK) (10−5) Denitrification (DENPOT) Organic N (kg ha−1)
A B C A B C A B C
1865 65 59 53 0.16 0.32 0.64 9454 9380 9305
1875 72 63 54 0.16 0.32 0.64 9513 9419 9324
1885 68 61 54 0.16 0.32 0.64 9491 9405 9318
1895 66 60 53 0.16 0.31 0.63 9464 9385 9307
1905 58 55 52 0.15 0.30 0.60 9381 9332 9281
1915 56 54 51 0.15 0.28 0.53 9331 9298 9264
1925 54 52 51 0.13 0.23 0.42 9297 9275 9252
1935 52 51 50 0.11 0.14 0.21 9442 9371 9300
1945 50 50 50 0.08 0.08 0.08 9235 9235 9235
1955 50 50 50 0.08 0.08 0.08 9235 9235 9235
1965 50 50 50 0.08 0.08 0.08 9235 9235 9235
1975 50 50 50 0.08 0.08 0.08 9235 9235 9235
1985 50 50 50 0.08 0.08 0.08 9235 9235 9235
aA. B and C is a sensitivity analysis where (A) is ‘High’: the entire increase in arable land originated from ploughing up of old
grassland and a low denitrification rate was assumed; (B) is ‘Normal’: 60% of the increase in arable land originated from ploughing up of old grassland and a ‘normal’ denitrification rate was assumed; and (C) is ‘Low’: 20% of the increase in arable land originated from ploughing up of old grassland and a high denitrification rate was assumed.
increase in arable land originated from grassland it was possible to keep a running tally of how large a part of the newly cultivated arable land was at a certain phase of the SOM decline. Land that had been arable for more than 30 years was treated as if the decline had terminated and a steady state had been reached. The 1930s were the last decade when a larger content of organic N and higher mineralisation rate, due to re-cent cultivation, were applied. From a previous study (Mattsson, 1995), it was estimated that the average content of SOM today is roughly 45 g kg−1in the top-soil of arable land in Sweden; an estimation that was used in a previous study by Johnsson and Hoffmann (1998). This amount of SOM was used from 1940 on-wards. Similarly, the parameter values describing the mineralisation rate from 1940 onwards were also the same as in Johnsson and Hoffmann (1998).
2.2.5. Denitrification
Denitrification is the most uncertain sink of N in this study. Since nitrate in the soil profile can be subject to both denitrification and leaching a large denitrification will decrease the amount of N available for leaching. It is obvious that the drainage status of the arable soils has gradually improved during the period investigated (LBS, 1950) resulting in dryer soils. Denitrification was, therefore, assumed to be higher in 1865 compared to the present (Table 3). The denitrification rate was assumed to decline gradually during the period when
Table 4
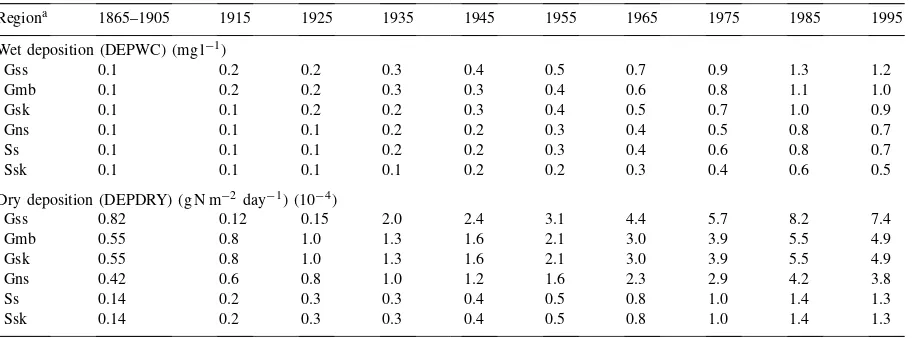
Used values of wet and dry deposition for each decade and each region in Sweden
Regiona 1865–1905 1915 1925 1935 1945 1955 1965 1975 1985 1995
Wet deposition (DEPWC) (mg l−1)
Gss 0.1 0.2 0.2 0.3 0.4 0.5 0.7 0.9 1.3 1.2
Gmb 0.1 0.2 0.2 0.3 0.3 0.4 0.6 0.8 1.1 1.0
Gsk 0.1 0.1 0.2 0.2 0.3 0.4 0.5 0.7 1.0 0.9
Gns 0.1 0.1 0.1 0.2 0.2 0.3 0.4 0.5 0.8 0.7
Ss 0.1 0.1 0.1 0.2 0.2 0.3 0.4 0.6 0.8 0.7
Ssk 0.1 0.1 0.1 0.1 0.2 0.2 0.3 0.4 0.6 0.5
Dry deposition (DEPDRY) (g N m−2 day−1) (10−4)
Gss 0.82 0.12 0.15 2.0 2.4 3.1 4.4 5.7 8.2 7.4
Gmb 0.55 0.8 1.0 1.3 1.6 2.1 3.0 3.9 5.5 4.9
Gsk 0.55 0.8 1.0 1.3 1.6 2.1 3.0 3.9 5.5 4.9
Gns 0.42 0.6 0.8 1.0 1.2 1.6 2.3 2.9 4.2 3.8
Ss 0.14 0.2 0.3 0.3 0.4 0.5 0.8 1.0 1.4 1.3
Ssk 0.14 0.2 0.3 0.3 0.4 0.5 0.8 1.0 1.4 1.3
aThe abbreviations in the column are for each of the regions which are illustrated in Fig. 1.
intensive drainage work was undertaken. The decline was assumed to be proportional to the intensity in drainage activities on agricultural land and the end of enhanced denitrification was set to 1940.
2.2.6. Sensitivity analysis
To illustrate the uncertainty in the assumptions con-cerning denitrification and mineralisation, calculations were conducted for three different assumed situations (Table 3).
1. ‘High’: the entire increase in arable land originated from ploughing up of old grassland and a low den-itrification rate was assumed.
2. ‘Normal’: 60% of the increase in arable land orig-inated from ploughing up of old grassland and a ‘normal’ denitrification rate was assumed. 3. ‘Low’: 20% of the increase in arable land
origi-nated from ploughing up of old grassland and a high denitrification rate was assumed.
This approach results in an interval between highest and lowest leaching rates in which it is likely that the actual leaching rate occurred.
from 1865 until 1900 was assumed to be the same con-sidering that the change in ammonia emissions due to a change in the way manure was handled was relatively
small and NOx emissions from internal-combustion
engines were still very low.
2.3. Calculation of average leaching and gross load
Eighty-one leaching estimates were calculated for each decade (three crops, three soils and nine regions). Average leaching rates for each of the nine regions were calculated by (1) weighting the leaching esti-mates according to the distribution (percentage) of area of each of the three soil types for each crop class. The same soil distribution was used as in previous study (Johnsson and Hoffmann, 1998); (2) multiplying average leaching rates for each of the crops by acreage of each crop; and (3) summing up the three gross loads from each crop and dividing by total acreage of arable land in each region. Average leaching for the whole country was calculated as the sum of gross load in each region divided by the total acreage of arable land.
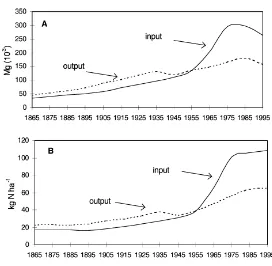
Fig. 4. Input of N from both manure and fertiliser N and output as yield in tonnes (A) and expressed as per hectare of utilised arable land (B).
2.4. Calculation of reduced N retention in lakes
An estimate of the effect of draining lakes on N re-tention was also done. This was calculated by estimat-ing the area of drained lakes and assignestimat-ing a retention to this lake area. The average N retention used in this estimate was 104 kg N ha−1 of lake area as reported in a study by Arheimer et al. (1997). Since retention is dependent on nitrate concentration, it was adjusted to change in simulated average concentrations in dis-charge from arable land, assuming that retention is proportional to concentration if all other factors are unchanged.
3. Results
3.1. N flows to and from arable land
the input of N with manure and commercial fertilis-ers was invariably smaller than the output with the harvest. To some extent, this deficit was reduced by atmospheric deposition and N fixation. However, even in the 1950s, N deposition only accounted for 30% of the deposition occurring in southern Sweden in 1985 (Swedish Environmental Protection Agency, 1997). Furthermore, the acreage of annual legumes grown in the 19th century was small (BiSOS-N, 1865–1905). Thus, only a minor fraction of the difference between output and input of N can be accounted for by deposi-tion and fixadeposi-tion. If all N fluxes are considered the N deficit would have been significantly reduced as clover (Trifoliumspp.) in grassland became more prevalent towards the end of the 19th century. Nevertheless, the information available strongly indicates that 19th cen-tury Swedish agriculture was characterised by a net removal of N from arable land. This was particularly true for areas where cultivation of new land (Fig. 3) enabled a considerable exploitation of organic N that previously had accumulated in the soil.
In the 1950s, increased use of commercial N fer-tilisers created an entirely new N balance in Swedish agriculture. Within less than a decade, the input of N surpassed the output with the harvest, and in the mid-1970s this difference between input and output was at its largest. During the past two decades yet an-other trend could be discerned; the harvest of N as a sum for all crops continues to increase in spite of the
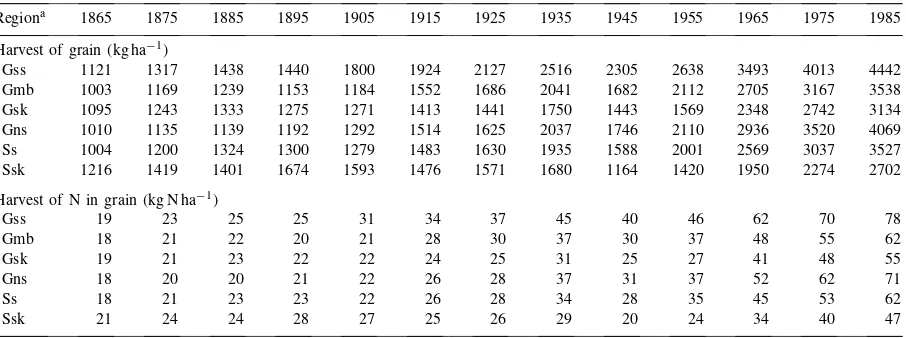
Table 5
Harvests of grain and of N in grain in kg ha−1 as average of spring and winter cereals in Sweden
Regiona 1865 1875 1885 1895 1905 1915 1925 1935 1945 1955 1965 1975 1985
Harvest of grain (kg ha−1)
Gss 1121 1317 1438 1440 1800 1924 2127 2516 2305 2638 3493 4013 4442
Gmb 1003 1169 1239 1153 1184 1552 1686 2041 1682 2112 2705 3167 3538
Gsk 1095 1243 1333 1275 1271 1413 1441 1750 1443 1569 2348 2742 3134
Gns 1010 1135 1139 1192 1292 1514 1625 2037 1746 2110 2936 3520 4069
Ss 1004 1200 1324 1300 1279 1483 1630 1935 1588 2001 2569 3037 3527
Ssk 1216 1419 1401 1674 1593 1476 1571 1680 1164 1420 1950 2274 2702
Harvest of N in grain (kg N ha−1)
Gss 19 23 25 25 31 34 37 45 40 46 62 70 78
Gmb 18 21 22 20 21 28 30 37 30 37 48 55 62
Gsk 19 21 23 22 22 24 25 31 25 27 41 48 55
Gns 18 20 20 21 22 26 28 37 31 37 52 62 71
Ss 18 21 23 23 22 26 28 34 28 35 45 53 62
Ssk 21 24 24 28 27 25 26 29 20 24 34 40 47
aThe abbreviations in the column are for each of the regions which are illustrated in Fig. 1.
fact that the fertilisation level is practically unchanged. This is partly because of increasing yields due to im-provement in management practices, and partly be-cause of a smaller area of set-aside.
The trends in N input and output just described refer to the average situation in Sweden. In specific areas, the temporal changes in N balance were even more pronounced. In particular, it is worth noticing that the relatively uniform distribution of livestock that prevailed until about 1940 has since been replaced by more specialised farming resulting in more pro-nounced regional differences. Animal density has de-creased in central Sweden and inde-creased in southern-most Sweden (Fig. 2).
3.2. Leaching estimates
3.2.1. Cereals
that have passed since the 1860s, both N input and N uptake efficiency have exhibited almost unbroken upward trends. The model calculations showed that, until the 1920s, the increase in uptake efficiency was larger than the increase in fertilisation rate and, conse-quently, the leaching of N decreased. This period was followed by an approximately 50-year-long period of increased fertilisation and leaching, and it was not un-til the 1970s that the upward trend in N leaching was curbed.
3.2.2. Bare fallow and grass
Several experimental studies have demonstrated that bare fallow causes substantial loss of N from the root zone (Addiscott, 1988; Turtola, 1993; Gustafson, 1996). This has two major explanations. First, the amount of water infiltrating the soil increases when the vegetation is removed. Secondly, the plant uptake of N is negligible if the soil is bare. The model calcu-lations in the current study indicated that the annual N leaching from bare fallow was on average about 50 kg ha−1per year (data not shown). If weeds were prevalent this may have been an overestimate.
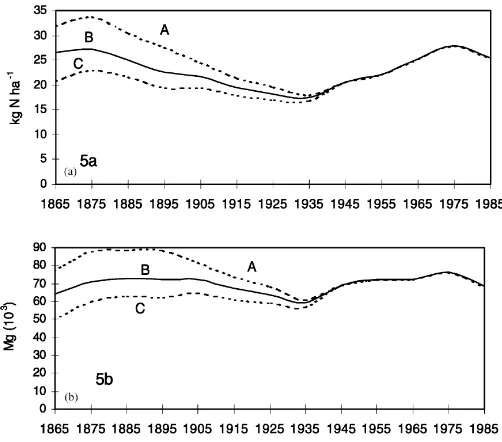
How-Fig. 5. Leaching (a) and gross load (b) for three assumptions of mineralisation and denitrification rates. (A) ‘High’: the entire increase in arable land originated from ploughing up of old grassland and a low denitrification rate was assumed; (B) ‘Normal’: 60% of the increase in arable land originated from ploughing up of old grassland and a ‘normal’ denitrification rate was assumed; and (C) ‘Low’: 20% of the increase in arable land originated from ploughing up of old grassland and a high denitrification rate was assumed.
ever, the model calculations did not take into account that, in the past, manure was often spread on bare fallow and that cultivation for weed control tillage enhances mineralisation and leaching processes.
Calculated leaching rates for grassland ranged from 1 to 11 kg ha−1 per year depending on soil type and leaching region. The area-weighted average leaching of N was 5 kg ha−1per year.
3.3. Gross N load and average leaching
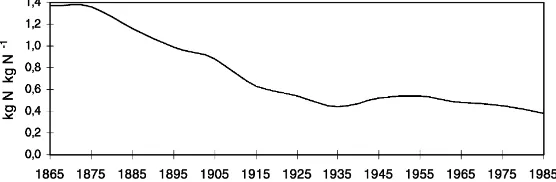
esti-Fig. 6. Calculated N leaching expressed in kg of leached N per harvested kg of N in foodstuff and fodder per ha of arable land in Sweden.
mates from cereals were at their lowest because the utilisation of N had increased.
From the 1930s until 1970, leaching rates from ce-reals increased by two-thirds; the load from bare fal-low ceased whereas leaching from grassland remained unchanged.
The net effect of this was an increase in average N leaching rates from arable land of 60% (Fig. 5a), while the increase in gross load was only 30% (Fig. 5b). One explanation for the smaller increase in gross load compared to the increase in average leaching rates was the decrease in area of arable land. Fig. 3 shows that practically the entire decrease in arable land was due to reduced acreage of grassland. Since leaching rates from grassland were very low the effect on load was small. Furthermore, the decrease in arable land was largest in the forest regions Gsk and Ssk, which had low leaching rates. Leaching has increased since the 1930s in all regions except the forest regions (Gsk and Ssk). The largest increase in leaching rates occurred in the two most southerly regions Gss and Gmb. These regions also witnessed the biggest increase in animal density and input of N from manure (Fig. 2). Gross load has decreased somewhat in the two forested areas Gsk and Ssk.
To evaluate how much the change in acreage of arable land and change in crop distribution affected the change in gross load to watercourses, the leaching rate estimates for 1865 were applied to all decades. The result was that the change in load to watercourses followed the development in acreage of arable land, i.e. gross load to watercourses increased from 1865 to a maximum in about 1920–1930 when the acreage of arable land was largest, and decreased thereafter. This shows that, since change in leaching for bare fallow was small, the decrease in leaching rates from cereals had a large influence on calculated gross load to
watercourses. Thus, the leaching estimates for cereals were critical for the final calculation of gross load to watercourses via leaching.
Leaching rates can, besides being expressed in ab-solute values, also be expressed in terms of efficiency. Relating leaching rates to yields showed that ‘leach-ing efficiency’ has decreased dur‘leach-ing the period inves-tigated since yields have increased more than leaching (Fig. 6). Production of a certain amount of food causes less leaching today compared to in the 19th century. Efficiency of N application by manure and fertiliser was expressed as leached amount of N per applied kg of N. It has decreased in about the same magnitude as leached amount of N per kg of N harvested in the field. This illustrates the difficulty of making a sim-ple connection between input of N and leaching for moderate inputs of N since the significance of miner-alisation for leaching is not taken into account in such a comparison.
4. Discussion
Fig. 7. Number of drained lakes for each year in Sweden and an estimation of lost retention of N leached from arable land resulting.
the leaching of N from agricultural land in the Nether-lands increased by 300–400% from 1950 to 1990. It is generally recognised that super-optimal fertilisation rates can dramatically increase losses of N from the root zone of arable land. This is most likely one of the main causes of the large post-war increase in the Netherlands, and may explain the large difference in the increased loss of N compared to this study.
There is a strong correlation between specific N leaching rates, gross load, retention of N and net load to the sea. Gross load is all the specific leaching rates for different regions summarised for the whole coun-try. Part of this gross load of N is retained in lakes and rivers and net load is the amount of N that reaches the sea via river mouths. Even though N leaching rates and gross load are estimated in this study to be in the same order of magnitude today as in the middle of the 19th century, it does not mean that net load to the sea is in the same order of magnitude. Current average re-tention of N lost from arable land has been estimated at approximately 40% (Arheimer et al., 1997). In other words, 40% of the N leached from arable land is lost in rivers and lakes mainly by denitrification, and 60% reaches surrounding seas via river mouths. During the second half of 19th century and first half of 20th cen-tury, lakes and wetlands were extensively drained to gain arable land (Fig. 7). About 2500 lakes situated close to arable land were drained (Swedish Meteoro-logical and HydroMeteoro-logical Institute, 1995). Since these
lakes were recipients of discharge water from nearby arable land, it is reasonable to assume that they had a significant role as N-sinks. An estimate of the decline in retention indicates that approximately 30 000 Mg of N may previously have been lost in these lakes (Fig. 7). The calculation indicates that a probable increase in net load of N, i.e. the difference between gross load from all arable land and total retention in lakes and wa-terways, for the period as a whole was more affected by change in retention than by a change in gross load of N from arable land.
It is also important to note that these different phe-nomena, all leading to increase in net load occurred at different times. The draining of lakes and wetlands, which has led to less retention capacity for N in the landscape was mainly done at the end of the 19th century and in the first decades of the 20th century. However, the increase in gross load, which is the other factor of importance for the net load occurred mainly in the post war period. This indicates that most of the increase in gross load occurred at a time when most of the drainage was completed, and consequently, retention capacity lost.
be noted that this does not influence the process of nitrate leaching to groundwater.
Model calculations in general and large-scale model calculations in particular are impaired by uncertain-ties. The result depends on the accuracy of assump-tions made. However, regardless of the exact outcome of the model calculations, none of the three explana-tory factors for high historical N leaching rates are particularly controversial and are more likely to be significant than other factors indicating low leaching rates.
Long-term studies on N leaching raise the question of what type of model tool should be used. Since essential assumptions were made concerning impor-tant soil processes such as N turnover from newly cultivated land, the model chosen must describe the significance of such processes for leaching. The SOIL/SOILN model and many other deterministic models have that capability. A more simple empir-ical model generating N leaching estimates model would probably not have been sufficient since such models’ capability to calculate leaching estimates is built on modern field experiments on leaching, and consequently, may not be valid for totally different input/output conditions of N.
Perhaps the largest constraint in this type of appli-cation is not in the different models capability to de-scribe soil processes, but in the large uncertainties of input data, especially assumptions of gas losses (den-itrification) from the soil and mineralisation rate. This is why these two key factors for leaching were chosen to illustrate uncertainty in the sensitivity analysis.
5. Conclusions
The significance of this study for future N man-agement is mainly two factors. First, since leaching seemed to be extensive even a 100 years before com-mercial fertiliser was used on a large scale, the results emphasise the important role of turnover of soil or-ganic matter for N leaching. This indicates that even if commercial fertiliser is not used at super-optimal rates, measures must be directed to the management of mineralisation of SOM such as use of cover crops and timing of soil tillage in autumn. Second, the study underlines the fact that wetlands are an important mea-sure in decreasing agricultural N load to the sea, and
that large areas of wetlands are required to achieve a substantial reduction in the N load.
Acknowledgements
Funding for this study was provided for by Swedish Water Management Research Program (VASTRA), which is gratefully acknowledged. Staffan Steineck (SLU) and Stig Karlsson (JTI-Swedish Institute of Agricultural Engineering) gave valuable comments on questions concerning manure and ammonia emis-sions. Lennart Mattsson, (SLU) and Lars Hagblad, (Statistics Sweden) were equally helpful with their comments concerning N in crops and yields, respec-tively. Lennart de Maré and Sven Erik Karlsson at the Swedish Board of Agriculture contributed with data concerning draining activities.
References
Addiscott, T.M., 1988. Long-term leakage of nitrate from bare unmanured soil. Soil Use Manage. 4, 91–95.
Arheimer, B., Brandt, M., Grahn, G., Roos, E., Sjöö, A., 1997. Modellerad retention, källfördelning och kvävetransport för södra Sverige. Sveriges Meteorologiska och Hydrologiska Institut (SMHI) RH Nr 13 (in Swedish with English Summary). Arrhenius, O., 1954. Den kemiska denudationen i Sverige. Socker,
8, 147–166 (in Swedish).
BiSOS-N, 1865-1905. Bidrag till Sveriges Officiella Statistik, serie N, Jordbruk och Boskapsskötsel, Hushållningssällskapens berättelser (in Swedish).
Boers, P.C.M., Boogard, H.L., Hoogeveen, J., Kroes, J.G., Noij, I.G.A.M., Roest, C.W.J., Ruijgh, E.F.W., Vermulst, J.A.P.H., 1997. Huidige en toekomstige belasting van het oppervlaktewater met stikstof en fosfaat vanuit de landbouw. DLO-Staring Centrum SC-DLO. SC-DLO rapport 532 (in Dutch with English Summary).
Grimvall, A., Stålnacke, P., Tonderski, A., 2000. Time scales of nutrient losses from land to sea — a European perspective. Ecol. Eng., in press.
Gustafson, A., 1983. Leaching of nitrate from arable land into groundwater in Sweden. Environ. Geol. 5 (2), 65–71. Gustafson, A., 1996. Utsläpp från olika källor. Bidrag från olika
källor — jordbruk. In: Kväve och fosfor i mark och vatten — en ödesfråga inför 2000 talet. K. Skogs-o Lantbr. akad. Tidskr. 135 (3) 47–59 (in Swedish).
Hansson, N., 1912. Handbok i utfodringslära. C.E. Fritzes Bokförlag. Stockholm (in Swedish).
Hoffmann, M., Johnsson, H., 1999. A method for assessing generalised nitrogen leaching estimates for agricultural land. Environ. Model. Assess. 4, 35–44.
Jansson, P.-E., Halldin, S., 1979. Model for annual water and energy flow in a layered soil. In: Halldin, S. (Ed.), Comparison of Forest Water and Energy Exchange Models. International Society for Ecological Modelling, Copenhagen, pp. 145–163. Jenny, H., 1980. The soil resource — origin and behaviour. Ecol.
Stud. 37.
Johansson, G., Kyllmar, K., Johnsson, H., 1999. Observationsfält på åkermark. Ekohydrologi 49. Swedish University of Agricultural Sciences (in Swedish with English Abstract). Johnsson, H., Bergström, L., Jansson, P.E., Paustian, K., 1987.
Simulated nitrogen dynamics and losses in a layered agricultural soil. Agric. Ecosyst. Environ. 18, 333–356.
Johnsson, H., Hoffmann, M., 1998. Nitrogen leaching from agricultural land in Sweden. Standard rates and gross loads in 1985 and 1994. Ambio 27, 481–488.
Lawes, J.B., Gilbert, J.H., Warrington, R., 1881. On the amount and composition of rain and drainage waters collected at Rothamsted. J. R. Agric. Soc. Engl., Ser. 2, 17, pp. 241–279 and 311–350.
Lawes, J.B., Gilbert, J.H., Warrington, R., 1881. On the amount and composition of rain and drainage waters collected at Rothamsted. J. R. Agric. Soc. England, Ser. 2. 18, 1–71. LBS, 1950. Kungliga lantbruksstyrelsens berättelse för 1948 (in
Swedish).
Mattsson, L., 1995. Markbördighet och jordart i svensk åkermark. Naturvårdsverket (SNV). Rapport 4533 (in Swedish with English Abstract).
Persson, J., 1978. Kulturåtgärdernas inverkan på markorganismerna — markvård eller markförstöring. Skogs. och Lantbruksakad. Tidskrift. 117 (in Swedish).
Schröder, H., 1985. Nitrogen losses from Danish agriculture — trends and consequences. Agric. Ecosyst. Environ. 14, 279–289. Sjöström, A., 1922. Huvuddragen av det svenska jordbrukets utveckling 1871–1919. Statens Offentliga Utredningar: 1922:41, Stockholm (in Swedish).
Sondén, K., 1912. Anteckningar rörande svenska vattendrag. Kungl. Boktryckeriet Norstedt & Söner, Stockholm (in Swedish).
SOS, 1915-1955. Sveriges officiella statistik, Jordbruk och boskapsskötsel (in Swedish).
Statistics Sweden, 1959. Historisk Statistik för Sverige II, Väderlek, lantmäteri, jordbruk, skogsbruk, fiske tom. 1955 (in Swedish with English Summary).
Statistics Sweden, 1965–1995. Jordbruksstatistisk årsbok (in Swedish with English Summary).
Statistics Sweden, 1995. Handelsgödsel, stallgödsel och kalk i jordbruket. Kväve, fosfor, kalium och CaO i långa regionala tidsserier. Na 30 SM 9503 (in Swedish with English Summary). Swedish Board of Agriculture, 1997 Stallgödsel — Näring i
Kretslopp. STANK 2.1 (in Swedish).
Swedish Environmental Protection Agency, 1997. Källor till kväveutsläpp. Naturvårdsverket (SNV). Rapport 4736 (in Swedish).
Swedish Meteorological and Hydrological Institute, 1995. Sänkta och torrlagda sjöar. Sveriges Meteorologiska och Hydrologiska Institut (SMHI), Hydrologi Nr 62 (in Swedish).
Thoms, C., Joelsson, A., 1982. Nitrat i grundvattentäkter i Sverige. Naturvårdsverket (SNV). PM 1598 (in Swedish).
Tsirkunov, V.V., Nikanorov, A.M., Laznik, M.M., Dongwei, Z., 1992. Analysis of long-term and seasonal river water quality changes in Latvia. Water Res. 26, 1203–1216.
Turtola, E., 1993. Phosphorus and nitrogen leaching during set-aside. In: Elonen, P., Pitkänen, J. (Eds.), Proceeding of NJF seminar on Soil Tillage and Environment, Jokioinen, Finland, 8–10 June 1993. NJF utredning/Rapport Nr. 88.
Whitmore, A.P., Bradbury, N.J., Johnson, P.A., 1992. Potential contribution of ploughed grassland to nitrate leaching. Agric. Ecosyst. Environ. 39, 221–233.
Wiklander L., Wallgren, G., 1960. Utlakning av näringsämnen ur dränerad jord. Grundförbättring 13, 71–77 (in Swedish). Wiklander L., Wallgren, G., 1970. Utlakning av näringsämnen.