www.elsevier.comrlocateratmos
Case studies of spectral atmospheric transmittance
in the ultraviolet and visible regions in
Athens, Greece
I. Total transmittance
H.D. Kambezidis
a,), A.D. Adamopoulos
a, D. Zevgolis
b,1a
Atmospheric Research Team, Institute of EnÕironmental Research and Sustainable DeÕelopment,
National ObserÕatory of Athens, P.O. Box 20048, GR-11810 Athens, Greece
b
Department of Physics, UniÕersity of Patras, GR-26500 Patras, Greece
Received 6 August 1999; accepted 16 March 2000
Abstract
This work accounts for an investigation about the diurnal variation of total spectral transmit-tance of solar irradiance under dominant wind conditions as case studies. Such a work is carried out in Athens for the first time. The spectral transmittance values estimated were derived using
Ž .
ground-based spectral measurements of beam irradiance in the range 310–575 nm UV and VIS . The data were recorded by a system consisting of an automatic solar tracker and a spectrometer. All data were recorded under clear-sky conditions in the city center of Athens and the spectral total atmospheric transmittance was estimated towards zenith to avoid optical mass effects. The comparison reveals that the total atmospheric transmittance is higher under the influence of strong Etesian compared to sea-breeze conditions. The influence of low-pressure systems also plays a depollution role in the basin. Various features of diurnal variation are discussed with respect to emission sources, topographic peculiarities and wind pattern.q2000 Elsevier Science B.V. All
rights reserved.
Keywords: Spectral solar beam irradiance; Total atmospheric transmittance
)Corresponding author. Tel.:q30-1-3490119; fax:q30-1-3490140.
Ž . Ž .
E-mail addresses: [email protected] H.D. Kambezidis , [email protected] D. Zevgolis .
1
Tel.:q30-61-997475; fax:q30-61-997911.
0169-8095r00r$ - see front matterq2000 Elsevier Science B.V. All rights reserved.
Ž .
1. Introduction
Ž
Solar irradiance is attenuated during its passage through the atmosphere Iqbal, 1983;
.
Goody and Yung, 1989 . The major extinction processes are the molecular absorption
Ž .
and scattering Rayleigh , absorption by ozone, nitrogen oxides, water vapor and sulfur
Ž .
dioxide, as well as absorption and scattering by aerosols Mie scattering . In addition to these, a variety of chemical species are also responsible for absorbing solar irradiance in
Ž .
the UV and VIS spectral regions Jacobson, 1999 .
Ž .
The radiative-transfer codes, e.g. MODTRAN Berk et al., 1989 and SMARTS2
ŽGueymard, 1995 , can model atmospheric properties of the various atmospheric con-.
stituents based on standard atmospheric conditions. However, the air composition exhibits large temporal and spatial variations in urban areas like Athens. This may cause substantial differences between modeled and real data. Therefore, knowledge of the real
Ž .
atmospheric optical properties is important for i estimating the impact of a polluted
Ž .
atmosphere on weather and climatic change, ii studying air pollution and energy
Ž .
exchange, iii correcting satellite images for the atmospheric effect in the visible
Ž .
spectral range especially over polluted regions, and iv simulating spectral solar
irradiance. The latter is, in turn, helpful in the design of photovoltaics, window glazing
for energy-efficient buildings, calculation of heatingrcooling loads in architecture and
Ž .
the design of flat-plate collectors. Moreover, the selected spectral range UVrVIS is
Ž . Ž
suitable for i estimating atmospheric constituents like O and NO , Kambezidis et al.,3 2
. Ž .
1996, 1997a, 1998a , ii studying part of the solar erythemal UV band and its effect on
Ž .
biological tissues Lorente et al., 1994; Repapis et al., 1998; Papayannis et al., 1998 and
Ž .iii assessing the reduction of part of the photosynthetically active radiation PAR , thatŽ .
Ž
is the radiation required by plants for the photosynthesis process Blackburn and Proctor,
.
1983 .
2. Topography and local climatology
Athens is a city of about 4 million people located in a basin of 450-km2 area. It is
surrounded by high mountains on three sides and the sea on the south. Its topographic characteristics together with Mediterranean climatological conditions and intense pollu-tant emissions often make air quality as bad as that of Los Angeles, and other cities
ˇ
ŽCvitas et al., 1985; Mantis et al., 1992 . Thus, under favorable meteorological condi-.
Ž .
tions Lalas et al., 1982; Katsoulis, 1988; Adamopoulos et al., 1996a,b,c , the concentra-tion of air pollutants may exceed the air quality standards of the European Union and the
Ž .
World Health Organization EARTH, 1998 . Sea breeze and calms are weather condi-tions that cause the so-called ‘‘nephos’’, a brownish photochemical cloud that is visible by the residents. Athens basin has two openings at the SW and NE edges, so that the predominant winds and consequently the aeration of the basin are accomplished in the NE–SW direction.
Ž .
Ž .
with high levels of air pollution Lalas et al., 1983; Gusten et al., 1988; Ziomas, 1998 ;
¨
Ž .
and b the northerly ‘‘Etesian’’ winds generated under the influence of the anticyclone of Azores and the low-pressure system of India often extended to Cyprus. These winds of high speed and persistence are characteristic summer winds in the eastern part of the
Ž .
Mediterranean having a cleansing effect on the atmosphere Gagaoudaki, 1979 .
3. Data collection
In the warm period of 1997 the beam component of spectral solar irradiance was recorded during some cloudless days with a sampling rate of 30 min. The measuring site was on the roof of the Department of Electrical Engineering, National Technical
Ž .
University in the city center of Athens ws37.978N, ls23.728E . The measurements
Ž .
were performed using a passive pyrheliometric scanner PPS . In general, a pyrheliome-ter is a solar radiation instrument that records the direct component of the solar radiation. The term ‘‘passive’’ indicates that no energy from PPS is required for recording solar radiation. The term ‘‘scanner’’ implies that PPS performs spectral measurements. A detailed description of this system is given in Kambezidis et al.
Ž1996 . In brief, solar radiation enters through two concentric lenses and is guided by.
Ž
two optical fibers to two different diffraction gratings one in the UV and VIS spectral regions and the other in the VIS–NIR regions; the latter was not in use during this
.
study . A CCD sensor is then used to imprint the two spectral regions one at a time; the
Ž .
individual spectral values in mV are then converted from analog to digital form by an
Ž y2.
ArD converter and further into solar radiation units W m . To achieve accuracy in
the measurements, PPS was calibrated against a halogen spectral prototype lamp. In addition, another very important point was to keep the diffraction-grating unit in a
Ž .
constant-temperature environment Kambezidis et al., 1996 . A number of applications
Ž .
using PPS are involved with the estimation of: i the spectral total atmospheric
Ž .
transmittance and total optical thickness; ii the individual spectral atmospheric
trans-Ž .
mittances due to different atmospheric constituents; iii the total O and NO columns;3 2
Ž .
and v the aerosol influences on climatic changes and other properties of the
atmo-Ž . Ž
sphere e.g. albedo, effect on visibility etc , Adamopoulos et al., 1998a,b,c,d;
Kam-.
bezidis et al., 1996, 1997a,b, 1998a,b,1999 .
4. Total spectral transmittance retrieval
Ž . Ž .
The total spectral atmospheric transmittance t l, z in the sun-sensor direction ,
considering single scattering can be derived from:
t l,u
Ž
z.
sHŽ
l,uz.
rHoŽ .
l D.Ž .
1Ž . y2 Ž
where H l,uz stands for the measured calibrated irradiance in W m function of
. Ž .
Table 1
Selected dates and flow characteristics
Ž .
Date Times of measurements LST Prevailing flow
20th May 1997 0800–1800 hours except Pure sea breeze with speeds y1
at 1030 and 1100 less than 2.8 m s 5th September 1997 0730–1800 Pure Etesians with speeds
y1
less than 6.8 m s
1st July 1997 0730–1800 Competition between Etesians and
y1
Ž .
sea breeze speeds less than 5.1 m s
y1
11th July 1997 0730–1800 Southerly flow with speeds less than 5.5 m s
Ž . Ž
Gueymard 1995 , and D is the correction factor for the sun–earth distance Kambezidis
.
et al., 1997a .
X
Ž . Ž .
The total spectral optical thickness, d l, towards zenith is obtained from:
X
d
Ž .
l s1rmln 1rt lŽ .
Ž .
2 where m is the pressure-corrected atmospheric optical mass calculated via the formulaŽ .
given by Gueymard 1995 . The total spectral atmospheric transmittance function
Ž . X
towards zenith ,t, is derived via the following equation:
X X
t
Ž .
l sexp ydŽ .
l .Ž .
3Thus, the atmospheric transmittance function is corrected for optical mass effects to enable us to compare values obtained under various solar altitudes.
5. Results and discussion
Based on the method presented above, spectral total atmospheric transmittance curves
Ž .
were derived during some distinct days case studies under different wind conditions.
Ž
Wind data were taken from the inventory of the National Observatory of Athens NOA,
.
1997 . This is located at a distance of 2 km from the measuring place with no barriers in between and same climatic features. Table 1 gives a list of the clear-sky days selected and the prevailing flow.
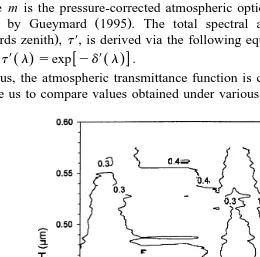
Fig. 1 presents the total spectral atmospheric transmittance during the 20th of May 1997. On that day, the synoptic wind flow was very weak and favored the development of a sea-breeze circulation in the Athens basin. Under such circumstances a brownish
ˇ
Ž
photochemical cloud is very likely to occur Cvitas et al., 1985; Lalas et al., 1983, 1987;
.
Gusten et al., 1988; Katsoulis, 1988; Suppan et al., 1998 . The reduction in visibility
¨
Ž .
was severe and the air quality was degraded. The contour lines Fig. 1 show steep gradients indicating rapid changes in the atmosphere. An intense maximum of air pollution appears around 0900 hours, while a second one shows up at 1300. The former is associated with traffic circulation since it is only observed in the VIS. The spectral
range 366–406 is an atmospheric window for O , while NO3 2 that exhibits great
absorption in this spectral range, is released by the exhaust pipes of vehicles at a percentage around 70%. In addition, the morning peak is also associated with the appearance of temperature inversions; the mixing-layer height reaches approximately the
altitude of the summits of the highest mountains during the mornings of the warm period
Ž .
of the year when the synoptic flow is absent or weak Kambezidis et al., 1995 . Other
Ž
works confirm this morning peak in air pollution as well Kambezidis et al., 1995;
.
EARTH, 1998 . The midday peak coincides with intensification of the local sea breeze. Secondary photochemical pollutants are then produced. Unlike the morning peak, the midday peak is observed throughout the considered spectral range. From an analysis of air-pollution measurements performed by a network of ground-based stations belonging to the Ministry of Environment, it turns out that secondary pollutant, such as ozone,
Ž .
peak at 1300 EARTH, 1998 . Afterwards, air pollution turns out to drop because of the air-pollutant transport to the northern suburbs of Athens via the sea-breeze mechanism.
ŽKlemm et al., 1998; Suppan et al., 1998 ..
The diurnal changes are largely attributed to NO mainly over 350 nm and particulate2
matter throughout the considered spectral range. Especially over 530 nm, the higher values of transmittance observed after 1000 hours indicate that there is a substantial load of marine aerosols present in the atmosphere as a result of sea-breeze circulation. This conclusion is supported by the fact that marine aerosols possess fair attenuation
Ž .
coefficients in the range 500–575 nm Vaxelaire et al., 1991 . The role of marine
Ž
aerosols in atmospheric chemistry was found to be significant for Athens Eleftheriadis
.
et al., 1998 .
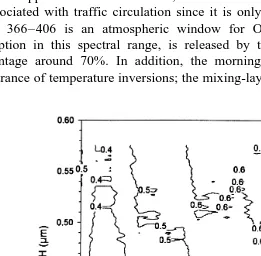
Much higher values of atmospheric transmittance are obtained during the 5th of
Ž .
September 1997, a pure Etesian day, Fig. 2 compared to those calculated during the
pure sea-breeze day. The day was characterized by the dominance of relatively strong
northerly Etesian winds with speed varying in the range 4.5–6.8 m sy1. The higher
values of total atmospheric transmittance observed are consistent with the results of
Ž
other studies Kambezidis et al., 1998c; Ziomas, 1998; Suppan et al., 1998; Svensson
.
and Klemm, 1998 . The apparent effect of the Etesians on air pollution is also in line with simultaneous visibility observations. A morning maximum of air pollution is observed in this case as well. After this morning peak, the Etesians sweep the air pollutants seawards thus cleansing the atmosphere over the basin. This is clear from Fig. 2 showing continually improving transmittances in the rest of the day. After 1700, they reach the value of 0.8 above 500 nm. The results are in accordance with the high visibility observed and the low levels of air-pollutant concentrations recorded by
Ž .
EARTH 1998 on that day.
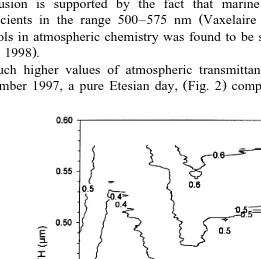
During the 1st of July 1997, a high-pressure system was centered over Italy and the day was characterized by the competition between Etesian and sea-breeze flows. As a
Ž .
result, the transmittance contours Fig. 3 have characteristics of both wind regimes
ŽFigs. 1 and 2 . The values obtained lie in between those observed during pure-sea-breeze.
Ž .
and pure-Etesian day as expected Suppan et al., 1998 . Concerning the diurnal variation of the total transmittance, the morning maximum in air pollution mainly due to traffic circulation is still observed but it is of longer duration in this case. The midday peak is not well pronounced, although it seems to exist. After 1500, the atmosphere becomes
Ž .
cleaner higher transmittances as also observed in both former cases.
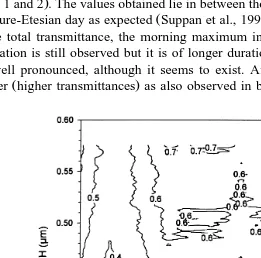
During the 11th of July 1997, the predominant wind direction was from the southern sector. However, this had nothing to do with sea breeze. This wind flow was generated by the influence of a low-pressure system located north of Greece. The calculated total
Ž . Ž
transmittances Fig. 4 are much greater than those under the sea-breeze circulation Fig.
. Ž
1 in the whole spectral range, although both winds are southerly in origin Katsoulis,
. Ž .
1988 . In addition, the total transmittance values Fig. 4 are comparable to those
Ž .
obtained during the pure-Etesian day Fig. 2 especially on the top of the spectral range. The morning peak in air pollution appears at 0830 and it is in line with the rush hour of the city. The 1300 peak is still observed but it is less intense than that during the sea-breeze day. Another rigorous maximum in air pollution shows up at 1600 in the VIS range. This might be due to chemical processes and transport phenomena. Kambezidis et
Ž .
al. 1998d have shown the formation of an O reservoir at an altitude of 1200 m a.g.l.3
over the basin at the end of the day. Nevertheless, the absence of pollutant-concentra-tion-profile measurements does not allow any approach. However, this may be due to a delayed appearance of secondary photochemical pollutants, together with dust and marine-particle accumulation.
6. Concluding remarks
The total atmospheric transmittance exhibits higher values with increasing
wave-Ž .
length 310–575 nm varying in the range 0.1 to 0.8 depending upon the wind
conditions and measurement-performance time. In the warm period of the year, the highest values of total atmospheric transmittance are observed under the influence of strong northerly Etesian winds while the lowest values appear during fully developed sea-breeze circulation throughout the spectral range. An intense peak in air pollution
Žlow total transmittance is found in the morning under all wind conditions. In addition,.
sea breeze favors the appearance of a midday minimum in total atmospheric transmit-tance while this is absent during strong Etesians. The influence of low-pressure systems seems to play a depollution role in the basin.
References
Adamopoulos, A.D., Kambezidis, H.D., Sipsas, A.B., 1996a. Meteorological factors that influence O3
concentration in the Athens basin. Fresenius Environ. Bull. 5, 37–42.
Adamopoulos, A.D., Kambezidis, H.D., Sipsas, A.B., 1996b. Meteorological factors that influence SO2
concentration in the Athens basin. Fresenius Environ. Bull. 5, 270–275.
Adamopoulos, A.D., Kambezidis, H.D., Sipsas, A.B., 1996c. Meteorological factors that influence CO concentration in the Athens basin. Fresenius Environ. Bull. 5, 351–356.
Adamopoulos, A.D., Kambezidis, H.D., Zevgolis, D., 1998a. Validation of Wien’s displacement law under cloudy sky. Fresenius Environ. Bull. 7, 515–522.
Adamopoulos, A.D., Kambezidis, H.D., Zevgolis, D., Topalis, F.B., Djepa, V., 1998b. A comparison of atmospheric optical spectral properties during summer days in Athens. Fresenius Environ. Bull. 7, 717–725.
Adamopoulos, A.D., Kambezidis, H.D., Zevgolis, D., Topalis, F.B., Djepa, V., 1998c. Aerosol optical
Ž .
Proc. EuroSun98 2nd ISES Europe Solar Congress, 14–17 September, Portoroz, Slovenia. The Franklin Company Consultants, Birmingham, UK, pp. I.1.1.1–7.
Adamopoulos, A.D., Kambezidis, H.D., Zevgolis, D., Topalis, F.B., Djepa, V., 1998d. Variability of total
Ž .
optical thickness over Athens, Greece. In: Goetzberger, A., Krainer, A. Eds. , Proc. EuroSun98 2nd ISES Europe Solar Congress, 14–17 September, Portoroz, Slovenia. The Franklin Company Consultants, Birmingham, UK, pp. I.1.2. 1–7.
Berk, A., Bernstein, L.S., Robertson, D.C., 1989. MODTRAN, A Moderate Resolution Model for LOWTRAN
Ž .
7, GL-TR-89-0122, Geophysics Laboratory AFSC .
Blackburn, W.J., Proctor, J.T.A., 1983. Estimating photosynthetically active radiation from measured solar irradiance. Sol. Energy 31, 233–234.
ˇ
Cvitas, T., Gusten, H., Heinrich, G., Klasinc, L., Lalas, D., Petrakis, M., 1985. Chracteristics of air pollution¨
during the summer in Athens, Greece. Staub-Reinhalt. Luft 45, 297–301.
EARTH, 1998. The atmospheric pollution in Athens — 1997. Bulletin of the Ministry of Environment,
Ž .
Physical Planning and Public Works in Greek .
Eleftheriadis, K., Balis, D., Ziomas, I.C., Colbeck, I., Manalis, N., 1998. Atmospheric aerosol and gaseous species in Athens, Greece. Atmos. Environ. 32, 2183–2191.
Gagaoudaki, H., 1979. Surface wind as a climatological factor affecting transportation and dispersion of
Ž .
pollutants in Athens area. In: National Meteorological Service vol. 7, Athens in Greek .
Goody, R.M., Yung, Y.L., 1989. Atmospheric Radiation, Theoretical Basis. 2nd edn. Oxford Univ. Press.
Ž .
Gueymard, C., 1995. Simple model of the atmospheric radiative transfer of sunshine SMARTS2 : algorithms w
and performance assessment. FSEC-PF-270-95, Florida Solar Energy Center, Florida. Available online x
from ftp:rralpha.fsec.ucf.edurpublicrsmarts2r.
ˇ
Gusten, H., Heinrich, G., Cvitas, T., Klasinc, L., Ruscic, B., Lalas, D., Petrakis, M., 1988. Photochemical¨
formation and transport of Ozone in Athens, Greece. Atmos. Environ. 22, 1855–1861. Iqbal, M., 1983. An Introduction to Solar Radiation. Academic Press.
Jacobson, M.Z., 1999. Isolating nitrated and aromatic aerosols and nitrated aromatic gases as sources of ultraviolet light absorption. J. Geophys. Res. 104, 3527–3542.
Kambezidis, H.D., Tulleken, R., Amanatidis, G.T., Paliatsos, A.G., Asimakopoulos, D.N., 1995. Statistical evaluation of selected air pollutants in Athens, Greece. Environmetrics 6, 349–361.
Kambezidis, H.D., Sakellariou, N.K., Topalis, F.B., Kanellias, A.A., Petrova, V.D., 1996. Air pollution monitoring with a passive pyrheliometric scanner. Fresenius Environ. Bull. 5, 631–636.
Kambezidis, H.D., Petrova, V.D., Adamopoulos, A.D., 1997a. Radiative transfer: I. Atmospheric transmission monitoring with modeling and ground-based multispectral measurements. Appl. Opt. 36, 6976–6982. Kambezidis, H.D., Petrova, V.D., Adamopoulos, A.D., 1997b. Radiative transfer: II. Impact of meteorological
variables and surface albedo on atmospheric optical properties retrieved from ground-based multispectral measurements. Appl. Opt. 36, 6983–6988.
Kambezidis, H.D., Adamopoulos, A.D., Djepa, V., Zevgolis, D., Topalis, F.B., 1998a. A radiative model based on multispectral solar direct radiation measurements. In: Pepper, D.W., Brebbia, C.A., Zannetti, P.
ŽEds. , Proc. Envirosoft98 7th International Conf. on Development and Application of Computer Tech-.
niques to Environmental Studies, 10–12 November, Las Vegas, Nevada, USA. WITPRESS, Boston, pp. 89–98.
Kambezidis, H.D., Adamopoulos, A.D., Sakellariou, N., Topalis, F.B., Kanellias, A.A., Petrova, V.D., Zevgolis, D., 1998b. Atmospheric chemistry and climate changes monitoring by a simple passive system. Fresenius Environ. Bull. 7, 20–26.
Kambezidis, H.D., Katevatis, E.M., Petrakis, M., Lykoudis, S., Asimakopoulos, D.N., 1998c. Estimation of the Linke and Unsworth-Monteith turbidity factors in the visible spectrum: application for Athens, Greece. Sol. Energy 62, 39–50.
Kambezidis, H.D., Weidauer, D., Melas, D., Ulbricht, M., 1998d. Air quality in the Athens basin during sea breeze and non-sea breeze days using laser-remote-sensing technique. Atmos. Environ. 32, 2173–2182. Kambezidis, H.D., Adamopoulos, A.D., Zevgolis, D., 1999. A comparison of spectral total atmospheric
transmission between summer and winter in Athens, Greece. In: ISES 1999 Solar World Congress, Jerusalem 4–9 July, Israel.
Klemm, O., Ziomas, I.C., Balis, D., Suppan, P., Slemr, J., Romero, R., Vyras, L., 1998. A summer air-pollution study in Athens, Greece. Atmos. Environ. 32, 2071–2087.
Lalas, D.P., Veirs, V.R., Karras, G., Kallos, G., 1982. An analysis of the SO concentration levels in Athens,2
Greece. Atmos. Environ. 16, 531–544.
Lalas, D.P., Asimakopoulos, D.N., Deligiorgi, D.G., Helmis, C.G., 1983. Sea-breeze circulation and photo-chemical pollution in Athens, Greece. Atmos. Environ. 17, 1621–1632.
Lalas, D.P., Tombrou-Tsella, M., Petrakis, M., Asimakopoulos, D.N., Helmis, C.G., 1987. An experimental study of the horizontal and vertical distribution of ozone over Athens. Atmos. Environ. 21, 2681–2693. Lorente, J., Redano, A., de Cabo, X., 1994. Influence of urban aerosol on spectral solar irradiance. J. Appl.
Meteorol. 33, 406–415.
Mantis, H.T., Repapis, C.C., Zerefos, C.S., Ziomas, J.C., 1992. Assessment of the potential for photochemical air pollution in Athens: a comparison of emissions and air-pollutant levels in Athens with those in Los Angeles. J. Appl. Meteorol. 31, 1467–1476.
Ž .
National Observatory of Athens NOA , Climatological Bulletin, 1997.
Papayannis, A., Balis, D., Bais, A., Van Der Bergh, H., Calpini, B., Durieux, E., Fiorani, L., Jaquet, L., Ziomas, I., Zerefos, C.S., 1998. Role of urban and suburban aerosols on solar UV radiation over Athens, Greece. Atmos. Environ. 32, 2193–2201.
Repapis, C.C., Mantis, H.T., Paliatsos, A.G., Philandras, C.M., Bais, A.F., Meleti, C., 1998. Case study of UV-B modification during episodes of urban air pollution. Atmos. Environ. 32, 2203–2208.
Suppan, P., Fabian, P., Vyras, L., Gryning, S.E., 1998. The behaviour of ozone and peroxyacetyl nitrate concentrations for different wind regimes during the MEDCAPHOT-TRACE campaign in the greater Athens area of Athens, Greece. Atmos. Environ. 32, 2089–2102.
Svensson, G., Klemm, O., 1998. Aircraft measurements and model simulations of the air quality in Athens, Greece. Atmos. Environ. 32, 2269–2289.
Vaxelaire, P., Leveau, J., Menguy, G., Baldy, S., 1991. Ground-level spectral distribution of solar direct-nor-mal irradiance and marine aerosol attenuation coefficients at Reunion Island. Sol. Energy 47, 189–196. Ziomas, I.C., 1998. The Mediterranean campaign of photochemical tracers — transport and chemical
Ž .