DETERMINING STAND PARAMETERS FROM UAS-BASED POINT CLOUDS
V. Yilmaz a, C. Serifoglu a, O. Gungor a
a KTU, Engineering Faculty, 61080, Ortahisar, Trabzon, Turkey - (volkanyilmaz.jdz,cigdemserifoglu,ogungor)@ktu.edu.tr
Commission I, WG I/4
KEY WORDS: Tree Detection, Stand Parameters, Unmanned Aerial System, Canopy Height Model, Forest, MATLAB
ABSTRACT:
In Turkey, forest management plans are produced by terrestrial surveying techniques for 10 or 20 year periods, which can be considered quite long to maintain the sustainability of forests. For a successful forest management plan, it is necessary to collect accurate information about the stand parameters and store them in dynamic and robust databases. The position, number, height and closure of trees are among the most important stand parameters required for a forest management plan. Determining the position of each single tree is challenging in such an area consisting of too many interlocking trees. Hence, in this study, an object-based tree detection methodology has been developed in MATLAB programming language to determine the position of each tree top in a highly closed area. The developed algorithm uses the Canopy Height Model (CHM), which is computed from the Digital Terrain Model (DTM) and Digital Surface Model (DSM) generated by using the point cloud extracted from the images taken from a UAS (Unmanned Aerial System). The heights of trees have been determined by using the CHM. The closure of the trees has been determined with the written MATLAB script. The results show that the developed tree detection methodology detected more than 70% of the trees successfully. It can also be concluded that the stand parameters may be determined by using the UAS-based point clouds depending on the characteristics of the study area. In addition, determination of the stand parameters by using point clouds reduces the time needed to produce forest management plans.
1. INTRODUCTION
Forests have a huge importance not only to mankind but also to all life forms that live in forests. Pumping out oxygen and absorbing carbon dioxide, serving numerous species as a home, fighting global warming and flooding, blocking wind, cleaning up soil and air are just some of the benefits of forests (URL-1). The continuity of the service provided by forests depends heavily on the proper use of them. Wrong and unnecessary use of forests leads to erosion, environmental pollution and extinction of
natural life (Çil, 2014).
According to the statistics of the General Directorate of Forestry, forests cover 22 million hectares area (approximately 28% of the whole country) in Turkey by 2015 (URL-2). Majority of the forests are subjugated by the state and managed by the General Directorate of Forestry. In Turkey, forest management plans are produced for 10 or 20 year periods to maintain the sustainability of forests (Türkiye Orman Varlığı, 2014). The first step of producing a forest management plan is to collect inventory information, which is basically the collection of the digital and attribute information relating to the forest. The collected information is then used to make decisions regarding the management of the forest. The more robust inventory collection, the more efficient forest management (Alkan, 2013). Terrestrial measurements have been conducted to determine the boundary of a stand and specify the tree stock. Since terrestrial measurements allow the collection of accurate and comprehensive information relating to the forest characteristics, they are used as the main source of information in inventory collection. However, collecting the inventory information by means of terrestrial measurements is an expensive and time consuming process
(Hyyppä et al., 2000; Lu et al., 2004; Günlü, 2012). Besides, a
huge amount of labour force is needed, especially in large-scaled areas. As known, it is necessary to collect inventory information regularly to monitor the actual status of the stands. However, regular renewal of terrestrial measurements may not always be
possible due to its high amount of time and labour force need. Hence, using remote sensing technologies is a reasonable approach for inventory collection (Lu et al., 2004; Stellingwerf and Hussin, 1997; Pouliot et al., 2002). The use of remote sensing techniques makes it possible to obtain accurate and robust inventory information in a short span of time.
For a successful forest management plan, it is necessary to collect accurate information about the stands (stand parameters) and
store them in dynamic and robust databases (Yılmaz et al., 2015). The location, number, height and closure of trees are among the most important stand parameters required for a forest management plan. Height of a tree is the vertical distance between the highest and lowest points of a tree. Canopy closure is the proportion of the ground area covered by the vertical projection of the tree crowns (URL-3) i.e. canopy closure increases as the trees get closer to each other. A closure ratio between 11% and 40% indicates sparse density; whereas a closure ratio between 41% and 70% indicates normal density. A closure ratio higher than 71% presents a high density (Özen and
Türk, 2014).
Examination of the studies in the literature reveals that the majority of the studies about the stand parameter estimation have been conducted using LiDAR data. The reason for this is that LiDAR data results in multiple returns. However, the acquisition and processing of LiDAR data is not always affordable due to its
high costs (Díaz-Varela et al., 2015). Another drawback of LiDAR technology is that the signal decreases as the acquisition range increases (Ismail et al., 2005). As a result of this, the acquired data may not be of quality as expected. Hence, using a point cloud generated with the aerial photos taken from a UAS would be a reasonable approach to reconstruct trees in 3D. With the use of UASs, it is possible to obtain very dense point clouds thanks to low-altitude flights. Hence, in this study, a UAS-based point cloud was used to determine the stand parameters in the study area.
The International Archives of the Photogrammetry, Remote Sensing and Spatial Information Sciences, Volume XLI-B1, 2016 XXIII ISPRS Congress, 12–19 July 2016, Prague, Czech Republic
This contribution has been peer-reviewed.
2. APPLICATION 2.1 Study Area
Study area (see Figure 1) is a small part of Karadeniz Technical
University campus in the city of Trabzon (41° 0’ N, 39° 43’ E), which is located on the northeast coast of Turkey. Study area includes various interlocking trees. As seen in Figure 1, the trees in the study area were planted regularly.
Figure 1. Study area
2.2 Point Cloud Generation
Before flight was conducted for the acquisition of the aerial photos to be used for point cloud generation, 11 ground control points (GCP) had been established throughout the entire campus. Since the distribution of GCPs directly effects the geometric accuracy, extra attention was paid to distribute the GCPs evenly over the entire campus. 3D positions of the GCPs were determined by RTK (Real Time Kinematik) GPS measurement technique. Then, the aerial photos of the whole campus were taken by the RICOH GR DIGITAL IV digital camera mounted on the GateWing X100 UAS. The GateWing X100 UAS and RICOH GR DIGITAL IV digital camera can be seen in Figure 2. Along 8 lines, 167 photos were taken over the whole campus from 190 m altitude. The aerial photos were then processed and a very dense (57 points per square meter, 313 million points in total) point cloud was generated by using the Agisoft PhotoScan Professional software.
Figure 2. GateWing X100 UAS (URL-4) (a) and RICOH GR DIGITAL IV digital camera (URL-5) (b)
2.3 DSM, DTM and CHM Generation
Very high-resolution DTM (15 cm), DSM (15 cm) and orthophoto (7 cm) of the campus were produced from the generated point cloud. It should be noted that a DSM represents all the features on the ground; whereas a DTM represents only the ground surface without the features on it (Haala and Brenner,
1999; Jedlička, 2009). CHM, which is calculated by subtracting
the DTM from DSM (Pitkänen et al., 2004; Hyyppä et al., 2004), is very useful for detection of trees and has been used in various
studies in the literature (Leckie et al., 2003; Popescu et al., 2003;
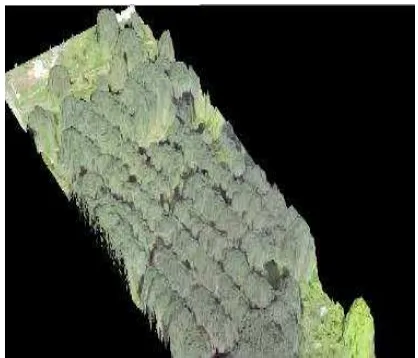
Pitkänen et al., 2004; St-Onge and Vepakomma, 2004). Since a CHM presents a good representation of tree crowns, CHM (15 cm spatial resolution) of the study area was calculated and shown in Figure 3.
Figure 3. Orthophoto of the study area draped over the CHM
2.4 Determination of the Positions of Trees
The methodology used in this study uses CHM to find the top of each tree. Except some abnormal situations, top of a tree is considered to be at the centre of the tree crown, whether it is a coniferous or a deciduous tree. A leaning tree is a good example of an abnormal tree. The top of a leaning tree may not be at the centre of tree. The canopy closure is the main factor that affects the detection accuracy of tree tops. In cases where the trees are not close to each other, the trees can spread their branches freely. In this case, it is relatively easier to detect tree tops. However, if trees are interlocking, they cannot spread their branches freely and their tops gets closer to each other, which makes the detection of tree tops more challenging. This situation is illustrated in Figure 4.
Figure 4. Not interlocking tree crowns (a), interlocking tree crowns (b). � is the distance between two tree stems. As seen in the figure, the distance between tree tops is smaller when tree crowns are interlocking.
DTM production involves ground filtering of point clouds. Hence, there may be some filtering errors i.e. some ground points may be removed or some non-ground points may not be removed. This, of course, effects the vertical accuracy of the produced DTM. Hence, in the produced CHM, the elevation values lower than 2 m were set to 0 to minimize the errors due to ground filtering. If this is not done, then these erroneous elevation values The International Archives of the Photogrammetry, Remote Sensing and Spatial Information Sciences, Volume XLI-B1, 2016
XXIII ISPRS Congress, 12–19 July 2016, Prague, Czech Republic
This contribution has been peer-reviewed.
are likely to be considered as tree tops, which leads to the incorrect detection of tree tops. In order to find the possible tree tops, local maximums of the CHM were calculated using a sliding search window. The size of the window is defined as the crown diameter of the smallest tree ( � �) in study area. Hence, the user should specify the � � value by manually measuring it in pixels. This is the first parameter that should be defined by the user. � � value was measured on the orthophoto of the study area as 35 pixels. Local maximums of the CHM were calculated by using the sliding search window, whose size was 35x35.
A second threshold � was specified to find all pixels in the vicinity of possible tree tops. This threshold can be specified as the average of the crown diameters of the smallest and largest trees, which were measured as 35 and 63 pixels, respectively. Hence, � threshold was calculated as 49 pixels. Then, all pixels whose distances to the tree tops are smaller than 49 pixels were chosen. The pixels belong to a single tree were merged to form an object. In this way, all tree crowns were converted into objects. The areas of all objects were then calculated. The objects whose areas are smaller than a predefined threshold were removed. As a final step, the centroid of each object was calculated to find the tree tops. All these implementations were done in MATLAB environment.
2.5 Crown Closure Map Generation
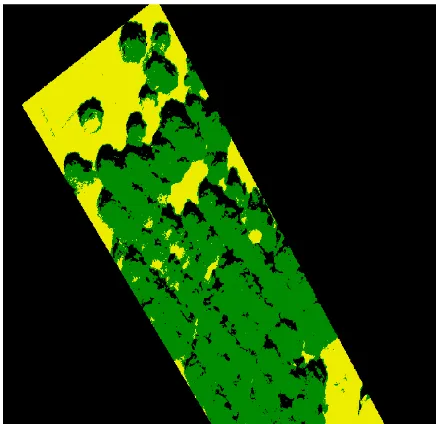
As a first step, the very high-resolution orthophoto of the study area was classified by using the Support Vector Machines (SVM) classification algorithm to classify the forested areas. The reason for using the SVM classifier was that it was proven to be one of the best classifiers and has been used in various studies in the literature. The classified image is given in Figure 5.
Figure 5. Classified image (green, yellow and black colours represent the tree, ground and shadow classes, respectively)
The classified image was used as a base to generate the crown closure map. To do this, a sliding window was employed in MATLAB environment. For each window position, the closure ratio was calculated by the ratio between the forest and non-forest areas in the window. Closure ratio between 11% and 40% presents sparse density; whereas a closure ratio between 41% and 70% indicates normal density. Closure ratio higher than 71% presents a high density. Hence, the closure map was generated and coloured with respect to calculated closure ratios.
3. RESULTS 3.1 Tree Detection Results
Tree detection accuracy was done by measuring the positions of the trees in study area. The positions of all tree stems were measured by using a Total Station device. The detected tree tops were then compared with those found by measuring the tree stems. Tree detection results can be seen in Figure 6. In the figure, green stars represent the detected tree tops; whereas red stars represent the trees that could not be detected with the used methodology. Yellow stars indicate the tree tops which were found by measuring the tree stems.
Figure 6. Detected and non-detected trees
As seen in Figure 6, there are 94 trees (yellow stars) in study area. 26 trees (red stars) were not be detected with the followed methodology, which means that 68 trees (72.3% of the trees) were detected correctly. However, the methodology detected 85 tree tops, which means that 17 tree tops were found redundantly. As seen in Figure 6, these erroneous tree tops generally situated close to the boundaries of trees. This was mainly due to the fact that the ground filtering algorithm used to filter the point cloud failed to remove some of the points in the vicinity of the trees.
3.2 Crown Closure Map
Generated crown closure map can be seen in Figure 7. It should be noted that the generated crown closure map is consistent with the orthophoto and classified images.
Figure 7. Crown closure map
The International Archives of the Photogrammetry, Remote Sensing and Spatial Information Sciences, Volume XLI-B1, 2016 XXIII ISPRS Congress, 12–19 July 2016, Prague, Czech Republic
This contribution has been peer-reviewed.
4. CONCLUSIONS
In this study, inventory information such as crown closure, and number and height of trees was collected by using the point cloud extracted from the aerial images taken from a UAS. It was concluded that the followed methodology achieved to detect interlocking trees with an accuracy higher than 70%. This methodology is expected to work better in such areas in which the trees are not interlocking. Followed methodology detects tree tops from canopy height model. Hence, ground filtering algorithm, which is used to filter the point cloud, should separate the ground and non-ground points with a high accuracy. Otherwise, produced DTM would be inaccurate, which directly effects the vertical accuracy of the produced CHM. The methodology used in this study has a good potential to detect tree tops. Another important conclusion drawn from this study is that UAS-based point clouds may be used as an alternative for LiDAR point clouds to collect inventory information required for production of forest management plans.
REFERENCES
Alkan, O., 2013. Meşcere Bazli Orman Envanterinde Optimal
Örnekleme Tasarimi; Sinop-Ayancik Orman İşletme Şefliğinde
Bir Uygulama Çalişmasi, Yüksek Lisans Tezi, Fen Bilimleri 2015. High-Resolution Airborne UAV Imagery to Assess Olive Tree Crown Parameters Using 3D Photo Reconstruction: Application in Breeding Trials. Remote Sensing, 7(4), pp. 4213-4232.
Günlü, A., 2012. Landsat TM Uydu Görüntüsü Yardımıyla Bazı
Meşcere Parametreleri (Gelişim Çağı ve Kapalılık) ve Arazi
Kullanım Sınıflarının Belirlenmesi. Kastamonu Üniversitesi Orman Fakültesi Dergisi, 12(1), pp. 71-79.
Haala, N., Brenner, C., 1999. Extraction of buildings and trees in urban environments. ISPRS Journal of Photogrammetry and Remote Sensing, 54(2), pp. 130-137.
Hyyppä, J., Hyyppä, H., Inkinen, M., Engdahl, M., Linko, S., Zhu, Y.H., 2000. Accuracy comparison of various remote sensing data sources in the retrieval of forest stand attributes. Forest Ecology and Management, 128(1), pp. 109-120.
Hyyppä, J., Hyyppä, H., Litkey, P., Yu, X., Haggrén, H.,
Rönnholm, P., Pyysalo, U., Pitkänen, J., Maltamo, M., 2004. Algorithms and methods of airborne laser scanning for forest measurements. International Archives of Photogrammetry, Remote Sensing and Spatial Information Sciences, 36(8), pp. 82-89.
Ismail, S., Peterson, L.D., Hinkle, J.D., Friedman, E., 2005. Applications of deployable telescopes for earth-observing lidar. In Proceedings of the ESTO Earth Science Technology Conference, College Park, pp. 27-28.
Jedlička, K., 2009. Accuracy of surface models acquired from different sources-important information for geomorphological research. Geomorphologia Slovaca et Bohemica, 9(1), pp. 17-28.
Leckie, D., Gougeon, F., Hill, D., Quinn, R., Armstrong, L., Shreenan, R., 2003. Combined high-density lidar and multispectral imagery for individual tree crown analysis. Canadian Journal of Remote Sensing, 29(5), pp. 633-649.
Lu, D., Mausel, P., Brondızio, E., Moran, E., 2004. Relationships between forest stand parameters and Landsat TM spectral responses in the Brazilian Amazon Basin. Forest ecology and management, 198(1), pp. 149-167.
Özen, F., Türk, M., 2014. Ormaniçi merada ağaç sıklığının bitki
örtüsü üzerine etkileri. Türkiye Ormancılık Dergisi, 15(1).
Pitkänen,J., Maltamo, M., Hyyppä, J., Yu, X., 2004. Adaptive methods for individual tree detection on airborne laser based canopy height model. International Archives of Photogrammetry, Remote Sensing and Spatial Information Sciences, 36(8), pp. 187-191.
Popescu, S.C., Wynne, R.H., Nelson, R.F., 2003. Measuring individual tree crown diameter with lidar and assessing its influence on estimating forest volume and biomass. Canadian Journal of Remote Sensing, 29(5), pp. 564-577.
Pouliot, D.A., King, D.J., Bell, F.W., Pitt, D.G., 2002. Automated tree crown detection and delineation in high-resolution digital camera imagery of coniferous forest regeneration. Remote Sensing of Environment, 82(2), pp. 322-334.
Stellingwerf, D.A., Hussin, Y.A., 1997. Measurements and estimations of forest stand parameters using remote sensing. VSP.
St-Onge, B., Vepakomma, U., 2004. Assessing forest gap dynamics and growth using multi-temporal laser-scanner data. Power, 140, pp. 173-178.
Türkiye Orman Varlığı, 2014. Orman İdaresi ve Planlama Dairesi
Başkanlığı, Orman Genel Müdürlüğü, Orman ve Su İşleri
Teknikleri ile Ağaçların Boy, Tepe Çapı ve Tepe Hacimlerinin Belirlenmesi, TUFUAB 2015, Konya, Türkiye.
The International Archives of the Photogrammetry, Remote Sensing and Spatial Information Sciences, Volume XLI-B1, 2016 XXIII ISPRS Congress, 12–19 July 2016, Prague, Czech Republic
This contribution has been peer-reviewed.