TRAFFIC SIGN DETECTION BASED ON BIOLOGICALLY VISUAL MECHANISM
Xiaoguang HU a*, Xinyan ZHU a, Deren LI a
a
State key Laboratory of Information Engineering in Surveying, Mapping and Remote Sensing, Wuhan, China
Commission III/3
KEY WORDS: Vision Sciences, Optical, Detection, Urban, Automation
ABSTRACT:
TSR (Traffic sign recognition) is an important problem in ITS (intelligent traffic system), which is being paid more and more attention for realizing drivers assisting system and unmanned vehicle etc. TSR consists of two steps: detection and recognition, and this paper describe a new traffic sign detection method. The design principle of the traffic sign is comply with the visual attention mechanism of human, so we propose a method using visual attention mechanism to detect traffic sign ,which is reasonable. In our method, the whole scene will firstly be analyzed by visual attention model to acquire the area where traffic signs might be placed. And then, these candidate areas will be analyzed according to the shape characteristics of the traffic sign to detect traffic signs. In traffic sign detection experiments, the result shows the proposed method is effectively and robust than other existing saliency detection method.
1. 0BINTRODUCTION
With the development of society and economy, the traffic problems become more and more serious, which become one of the bottle-neck of modern city. Traffic accidents are paid much attention by the governments of the world. Under this condition, ITS (Intelligent Traffic System) is in need. Traffic sign is important information of the road traffic and its detection and recognition has attracted much attention in last decade because of its importance. It involves the technologies of pattern recognition, digital image processing, artificial intelligence, computer vision and so no. However, traffic sign recognition is still an unsolved problem as it can be changed easily depending on its relative location and angle of view against camera and surrounding condition such as weather and daytime.
In recent years, traffic sign detection and recognition problems have drawn the attentions of many researcher. Sebastian Houben establish a new probabilistic measure for traffic sign colour detection and propose a novel Hough-like algorithm for detecting circular and triangular shapes[1]. Kyung-in Min etc proposed a method which can recognize about 4 directional road signs in Region of Interest and, the experiment are based on unmanned ground vehicle[2]. The method using Coherence Vector of Oriented Gradients features with neural network
classifier is promised by R. Rajesh etc and, they prove the results based on the combination of other features can acquire better recognition rates[3]. Siti Sarah Md Sallah etc propose a road sign detection and recognition algorithm for an embedded application, which use HSI color space to segment the road signs color and the shape to classify road signs[4]. Besides, the visual attention mechanism is introduced to detect traffic sign, which mainly for prohibition sign as it is very important for traffic safety[5]
. Jiang Yanhua etc use the algorithm that is composed of color segmentation, shape detection and pictogram recognition to solve the problem. In the first step Ridge Regression is used to obtain a precise segmentation in RGB color space. Recognition process include a novel feature extraction involves OTSU
method[6]
. Chen Zhixie etc propose the system divided into two phases. In the detection and coarse classification phase, they employ the Simple Vector Filter algorithm, Hough transform and curve fitting approaches. In the refined classification phase, the Pseudo-Zernike moments features and support vector machines are used[7]. Lykele Hazelhoff and Ivo Creusen etc report their works which different from others. They detect present signs in street-level panoramic images and the signs also need to be positioned besides the detection and classification[8]. Jung-Guk Park etc use machine learning algorithms to detect traffic sign, and scale-space to handle the different scale of traffic signs. In recognition phase, they introduce a novel feature to distinguish different signs, which include the 64-dimensional feature vector by the 4 Gabor filters and 16-dimensional feature vector by the fast Fourier transform[9]. Liu Yang etc describes an approach to using the location histogram matching for the broken traffic signs recognition[10].
The selective attention is the characteristics of human visual system (HVS). We will unconsciously focus our attention at saliency object and have not any prior knowledge when we saw a natural scene. It is very important to find saliency area because we can distribute finite computing resources according to saliency object to reduce time consuming. The saliency theory are used in many computer vision applications such as image segmentation, target recognition and image search etc. Visual saliency are closely related to the human experience and cognition and many image attributes can cause people's unconscious attention like contour, colour, edge and intensity etc. Because the potential of saliency research in computer vision, it is now investigated by multiple disciplines like cognitive psychology, neurobiology, CV. The design principle of the traffic sign is to attract the drivers which take into account the visual saliency of human, e.g. they normally have vivid colour, normalized shape etc. So, the use of the visual attention mechanism is reasonable in traffic signs detection. In this paper, we introduce a detecting method of the traffic sign based on visual attention mechanism, and our goal is to detect the prohibition signs because its importance in traffic safety. In International Archives of the Photogrammetry, Remote Sensing and Spatial Information Sciences, Volume XXXIX-B1, 2012
addition to, a new generated method of saliency map based on visual contrast is also introduced.
2. 1BMETHODOLOGIES
2.1 4BTwo-way Integration Method of Target Detection
Modern physiology and psychology in visual research shows that the visual process is a integrated process including both bottom-up and top-down[11], so our visual attention model is two-way integration. In Top-Down phase, we choose Simple Vector Filter proposed by T. Asakura etc[12] as a priori guide. The filter can highly extract specific colour and remove profile and have good segmentation results for red, blue and yellow. In Bottom-Up phase, we use a new saliency analysis method based on visual contrast.
Fig.1. The detection flowchart of traffic sign
The flowchart of our method is shown in Fig.1. Firstly, the whole scene will be analyzed by visual attention model based on two-way integration. We may acquired many saliency areas, i.e. candidate areas., because there are many object in the scene and they maybe have the same saliency with task-related objects, Secondly, these candidate area will be analyzed according to the shape characteristics of task-related objects to acquire the needed target area[5].
2.2 5BPhysiology background of saliency analysis
The phenomenon that the retina will strongly respond to large contrast visual stimulation and the generation mechanism of visual information in the primary visual cortex can be simulated. we propose a method generating saliency map according to the cognitive neuroscience research. The method includes two layers computational unit and they correspond to simple cell and complex cell in primate primary visual cortex.
S Unit: Human retina RF will strongly respond to the highest-contrast visual information, e.g., the center is light but surrounding is dark. The biological characteristics can be simulated by using difference operation between central high-resolution layer and surrounding slow-high-resolution layer[13]. Primate primary visual cortex contains simple cells and complex cells. Some studies suggest that the receptive fields of the simple cell only include a small part of the vision, these local units must be pooled together by visual system in order to perceive the target within vision. Complex cells are the nonlinear spatiotemporal integration of simple cells[14]. In this research, we use contrast as a local saliency, i.e., the contrast information given by retinal are local contrast information generated by simple cell in primary visual cortex. And then, these local contrast information are integrated together to form the global information generated by complex cell.
0.4
Fig.2. Flowchart of image attention analysis
C Unit:C unit are pooled from the S unit. The computing pool model is the bridge between complex and simple cells in primate primary visual cortex. As shown in Fig.2, there are three basic computing pool model for integrating local units is proposed in work[15], i.e. Maximum model,Energy model and Half-wave model。Some experimental evidence in favor of the max operation has already appeared[16, 17]. So, we choose out the max model to pool from complex cells to simple cells.
Input Image
Fig.3. Flowchart of image attention analysis
Our approach is summarized in Fig.3, within the workflow of image attention analysis, an input image passes through two parts, S unit, and C unit. They respectively correspond to simple and complex cells. After down-sampling and the central-surround operation, we can get the local contrast map in S unit, and then the max model is employed to pool from the local contrast map to the global contrast map in C unit. For further highlighting the saliency areas, the global contrast map is smoothed with Gaussian filter in order to acquire the saliency map. Subsequently, the generic threshold segmentation is used to detect the object in the saliency map, where threshold is three times the average intensity of the saliency map.
6B2.3 Computational step of saliency map
To sum up, a novel method of detecting the saliency object from the image has the following specific steps:
1) To generate an image pyramid. Down-sampling the original image
I
to create the Gaussian pyramidI
( )
, where
is the layer of the image pyramid. The layer
is set to 4, and thus
[1..4]. The first layer is the quarter of the size of the original image, the next layer is a half of the upper layer, and for instance the ration of the imageI
(1)
and the imageI
(4)
is 1/8.2) To generate S unit. We use center-surround operation to deal with 4-layer images in the pyramid and the result is used as the visual
information of S unit. A “center” fine scale c
1, 2,3
and a“surround” coarser scales
2,3, 4
s c , 1 , surround layer s are interpolated to the scale of the central layer c, and then the point by point difference operation is used to get three difference International Archives of the Photogrammetry, Remote Sensing and Spatial Information Sciences, Volume XXXIX-B1, 2012
1- 2, 2 - 3 3- 4 (
1,...,3) nDiff , n . Finally, we get simple unit
1 2, 3
S Diff,Diff Diff according to Eq.(1), and is the across
scales difference operation.
( , ) ( ) ( )
n c s c s
Diff I I I (n1,...,3) (1)
3) To generate C unit. The Diffn from the S unit are interpolated to the scale of the image (1)I , and then calculate the complex unit C by using Eq.(2).
( )
C Max S S
Diff1,Diff2,Diff3
(2)4) To generate saliency map. To further highlight the saliency areas and for better visual effect, we smooth the image C with a Gaussian filter hg whose size is 9*9 and standard variance is 8 to acquire the saliency map ( ) S I .
( ) g*
S I h C (3)
5)Object detection template is obtained. We use threshold segmentation to obtain binary image.
1 ( ) ( )
0
{
S I threshold S Iotherwise
(4)
In eq.(4), empirically threshold is set to thresholdE S I( ( )) *3, where ( ( ))E S I is the average intensity of the saliency map.
6) To obtain the detection result. The detection result is acquired by convoluting the real images and detection template of their own.
* ( )
Result I S I (5)
3. 2BEXPERIMENTS
The experimental data are selected from the two data collection points in Wuhan City, China. A set of data are manually collected near Wuhan university. Another set of data are automatically collected by Mobile Mapping System in Hankou district of Wuhan (Data sources: Wuhan Leador Spatial Information Technology Development CO.LTD). To verify the effectiveness of visual attention mechanisms, we only use the image data provided by the MMS system without using the positioning information. And not one particular image, but a more general pattern, at the street. The research area and real images are shown in Fig.4.
Data Collection Points
Data Collection Points
a (b)
(c) (d)
Fig 4. Digital map(a) and real images(b) of the research area The difficulty in detecting is: 1) there are many kinds of interference exist in scene, e.g. the acquired information in experimental area includes traffic signs, roads, building, vehicle, pedestrians, lines, trees, shadow etc. The spectral, shape, texture of some objects is similar with the traffic sign. 2) The same target may have different appearance under different weather and light.
Fig.5. Shows saliency analysis result of different method. Compared with Itti's[18] and Hou's[19] method, the experimental result shows our method can better highlight the saliency of traffic signs and suppress irrelevant information in scene.
a Original Image (b) Proposed method
(c) Itti’s saliency map (d) Hou’s saliency map Fig.5. The results of different saliency method China's current standard is GB5768-1999 after revised in 1999 and mainly consists of warning signs, prohibition signs, indication signs etc. Because of their direct relationship with traffic safety, these three kinds of signs are the major studied objects. This research aims to prohibition signs, but partial indication signs. are also round, so this method is also able to detect partial indication signs.
1) Image down-sampling
Firstly, the size of images is 640*480. The length side is more than 640 pixels, which should be resized to be 640 pixels. To illustrate the proposed detection method is effective, image keeps the original complexity without any cut.
2) Target Segmentation
After down-sampling, images were segmented by using the process shown in Fig. 1.
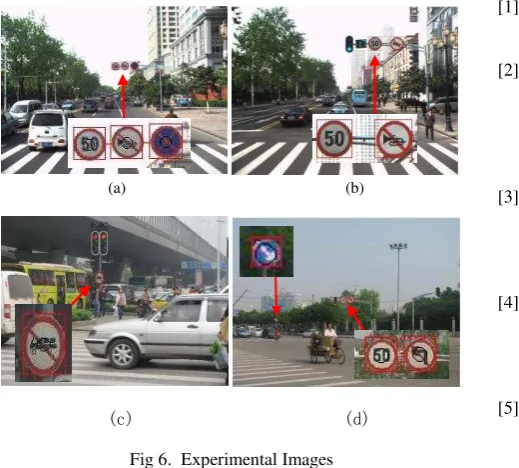
3 Detection of circular Signs
The experimental results show the method has high accuracy in locating the circular traffic signs. Some experimental results are shown in Fig.6(a)~(d). Fig.6(d) shows the circular indication sign was detected by this method. These results show that the method is robust and scalable.
(a) (b)
(c) (d)
Fig 6. Experimental Images
We use 673 street view images to verify the performance of the proposed method, which contains 261 traffic signs. Compared results of different methods are shown in tab 1, our method achieves the high detection rate than other saliency detection method, but the high false alarm rate is a problem need to be concerned.
Tab 1. Compared results of different methods Method Correct
Detection False Alarm
Detection Rate
Itti 161 162 62%
Hou 116 212 44%
Our method 217 206 83%
4. 3BCONCLUSIONS
In this work, we proposed a new detection method of traffic sign according to the design principle of the traffic sign. A visual attention model based on two-way integration is used to analyze the whole scene to acquire the candidate area. And then these candidate areas will be analyzed according to the shape characteristics of the traffic sign to detect traffic signs. In addition to, based on the mechanism of biological vision, we describe a saliency map generation method based on visual contrast and apply this method into the bottom-up phase in visual attention model. Experimental results show our method has a high detection probability than other saliency detection method. In the future, we will integrate the visual attention model with the ability of learning and memory to realize the traffic sign detection model fusioned with visual attention, learning and memory.
ACKNOWLEDGEMENTS
This work was supported by NSFC (40971232,41023001), National Support Program (2012BAH35B03), 863 Program (2011AA010500).
REFERENCE
[1] Houben S.A single target voting scheme for traffic sign detection[C].Intelligent Vehicles Symposium (IV), 2011 IEEE, 2011
[2] Kyung-in M,Jae-Saek O, Byong-Woo K.Traffic sign extract and recognition on unmanned vehicle using image processing based on support vector machine[C].Control, Automation and Systems (ICCAS), 2011 11th International Conference on, 2011
[3] Rajesh R,Rajeev K,Suchithra K, et al.Coherence vector of Oriented Gradients for traffic sign recognition using Neural Networks[C].Neural Networks (IJCNN), The 2011 International Joint Conference on, 2011
[4] Sallah S S M,Hussin F A, Yusoff M Z.Road sign detection and recognition system for real-time embedded applications[C].Electrical, Control and Computer Engineering (INECCE), 2011 International Conference on, 2011
[5] Xiaoguang H,Xinyan Z,Hui L, et al.Traffic sign detection based on visual attention model[C].Geoinformatics, 2011 19th International Conference on, 2011
[6] Yanhua J,Shengyan Z,Yan J, et al.Traffic sign recognition using Ridge Regression and OTSU method[C].Intelligent Vehicles Symposium (IV), 2011 IEEE, 2011
[7] Zhixie C,Jing Y, Bin K.A Robust Traffic Sign Recognition System for Intelligent Vehicles[C].Image and Graphics (ICIG), 2011 Sixth International Conference on, 2011
[8] Hazelhoff L,Creusen I, de With P H N.Robust detection, classification and positioning of traffic signs from street-level panoramic images for inventory purposes[C].Applications of Computer Vision (WACV), 2012 IEEE Workshop on, 2012 [9] Jung-Guk P, Kyung-Joong K.A method for feature
extraction of traffic sign detection and the system for real world scene[C].Emerging Signal Processing Applications (ESPA), 2012 IEEE International Conference on, 2012
[10] Liu Y,Ki-Ryong K,KwangSeok M, et al.Broken traffic sign recognition based on local histogram matching[C].Computing, Communications and Applications Conference (ComComAp), 2012, 2012 [11] Itti L,Gold C, Koch C.Visual attention and target
detection in cluttered natural scenes [J]. Optical Engineering, 2001, 40: 1784
[12] Asakura T,Aoyagi Y, Hirose O K.Real-time recognition of road traffic sign in moving scene image using new image filter[C].SICE 2000. Proceedings of the 39th SICE Annual Conference. International Session Papers, 2000
[13] Itti L,Koch C, Niebur E.A model of saliency-based visual attention for rapid scene analysis [J]. Pattern Analysis and Machine Intelligence, IEEE Transactions on, 1998, 20(11): 1254-1259
[14] Edward M C.Neural Mechanisms for the Generation of Visual Complex Cells [J]. Neuron, 2001, 32(3): 378-380
[15] Sakai K, Tanaka S.Spatial pooling in the second-order spatial structure of cortical complex cells [J]. Vision Research, 2000, 40(7): 855-871
[16] Gawne T J, Martin J M.Responses of primate visual cortical V4 neurons to simultaneously presented stimuli [J]. Journal of Neurophysiology, 2002, 88(3): 1128-1135
[17] Lampl I,Ferster D,Poggio T, et al.Intracellular Measurements of Spatial Integration and the MAX Operation in Complex Cells of the Cat Primary Visual Cortex [J]. Journal of Neurophysiology, 2004, 92(5): 2704-2713
[18] L. Itti C K, E. Niebur.A model of saliency-based visual attention for rapid scene analysis [J]. IEEE Transactions on Pattern Analysis and Machine Intelligence, 1998, 20(11): 1254-1259
[19] Hou X, Zhang L.Saliency detection: A spectral residual approach[C], 2007: Ieee
![Fig.5. Shows saliency analysis result of different method. Compared with Itti's[18] and Hou's[19] method, the experimental result shows our method can better highlight the saliency of traffic signs and suppress irrelevant information in scene](https://thumb-ap.123doks.com/thumbv2/123dok/3240278.1397254/3.595.307.545.322.532/saliency-analysis-different-compared-experimental-highlight-irrelevant-information.webp)