RESEARCH ON DIFFERENTIAL CODING METHOD
FOR SATELLITE REMOTE SENSING DATA COMPRESSION
Z. J. Lin a, *, N. Yao b, B. Deng c, C. Z. Wang d, J. H. Wang d a
Chinese Academy of Surveying and Mapping, 16 Beitaiping Road, Beijing, China - [email protected]
bRemote Sensing information Engineering School, Wuhan University, 129 Luoyu Road, Wuhan, China
[email protected]
c
Beijing Ceke Spatial Information Technology Company, Ltd., 16 Beitaiping Road, Beijing, China
[email protected]
d
Guizhou Guihang Unmanned Aerial Vehicles Company, Ltd., 87 West City Road, AnShun, China
[email protected]
KEY WORDS: Satellite, Compression, Land cover, Differential encoding, Information amount, Compression rate
ABSTRACT:
Data compression, in the process of Satellite Earth data transmission, is of great concern to improve the efficiency of data transmission. Information amounts inherent to remote sensing images provide a foundation for data compression in terms of information theory. In particular, distinct degrees of uncertainty inherent to distinct land covers result in the different information amounts. This paper first proposes a lossless differential encoding method to improve compression rates. Then a district forecast differential encoding method is proposed to further improve the compression rates. Considering the stereo measurements in modern photogrammetry are basically accomplished by means of automatic stereo image matching, an edge protection operator is finally utilized to appropriately filter out high frequency noises which could help magnify the signals and further improve the compression rates. The three steps were applied to a Landsat TM multispectral image and a set of SPOT-5 panchromatic images of four typical land cover types (i.e., urban areas, farm lands, mountain areas and water bodies). Results revealed that the average code lengths obtained by the differential encoding method, compared with Huffman encoding, were more close to the information amounts inherent to remote sensing images. And the compression rates were improved to some extent. Furthermore, the compression rates of the four land cover images obtained by the district forecast differential encoding method were nearly doubled. As for the images with the edge features preserved, the compression rates are average four times as large as those of the original images.
* Corresponding author.
1. INTRODUCTION
Satellite Earth data transmission is an indispensible link in the process of satellite remote sensing. Under many circumstances, data compression technology should be considered to improve the efficiency of this link. For example, a certain remote sensing satellite with a designed data acquisition rate of 840 Mbps (millions of bits per second/ megabytes per second), given a data transmission rate of 450Mbps, calls for an at least 1.9 times data compression rate so as to ensure a real-time data transmission from satellite to Earth. Hence, if a country has not yet possessed sufficient capacity of evenly building necessary ground receiving stations, remote sensing images should be stored by the on-board computers and not be transmitted until the satellites fly above the receiving station. As for the aforementioned satellite, the on-board stored data obtained from above North and South America will be approximately four times compressed when it is transmitted to the receiving stations in China.
Different from video camera images, remotely sensed imagery is characterized by its lower correlation, higher entropy and lower redundancy. Besides, the information contained in remote sensing images, e.g., hues and textures, is in abundance. The information contained in the on-board stored images is expected to be preserved as complete as possible for following image interpretations and measurements. Hence, the most favorable
data compression method for remote sensing imagery is lossless compression, or at least near lossless compression which would not affect the accuracy of stereo measurements.
In order to ensure the quality of the acquired remote sensing images with sufficiently and effectively usage of the limited storage space on-board, compression methods with higher compression rates are demanded, the essence of which is to reduce the redundancy of images as large as possible.
2. DIFFERENTIAL CODING FOR LOSSLESS COMPRESSION
2.1 Basis of Information Theory
Lossless compression refers to a class of data compression algorithms that allows the exact original data to be reconstructed from the compressed data. The most representative lossless compression algorithms include Shannon coding, Huffman coding, run-length encoding, Lempel-Ziv-Welch (LZW), arithmetic coding and so on. From the perspective of information theory, the principle of lossless compression is to eliminate the data redundancy. The redundancy of images results from two aspects: (1) unevenly distributed radiations which may be reflected by grayscale histograms; (2) the auto-correlation consisting in time, spatial
and spectral domains. Take video camera images for example. Correlations between neighboring frames are strong. Hence, images of this kind are able to be compressed with a thousand times compression rate. However, satellite image time series reflect changes in landscapes which results in a rather weak correlation in time domain. And for high-resolution panchromatic images, the redundancy mainly resides in spatial domain.
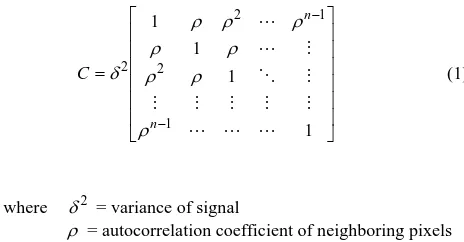
A number of statistical analyses reveal that the grayscales of a certain remote sensing image possess the property of the first order Markov process, whose covariance may be abstracted as (Lin and Zhang, 2006; Hu, 1979)
According to the information theory, the mutual information, given two neighboring pixels t and (t+1), of their gray values is calculated by the following formula (Lin and Zhang, 2006; Tao and Tao, 2004):
t,t1
ln
1I (2)
Hence, the information amount of a rectangular image with Lx
in length and Lyin width is
= standard deviation of noise
In other words, the average information amount of each pixel is reduced by ln
1 nats, i.e., log2
1 log2ebits, due to the correlation of neighboring pixels. Table 1 lists several auto-correlation coefficients and their corresponding reduced information amounts, i.e., mutual information.Auto-correlation coefficients 0.9 0.8 0.7 0.6 Mutual information -2.3 -1.6 -1.2 -0.9
Table 1. Several auto-correlation coefficients and their corresponding reduced information amounts (unit: bits)
The auto-correlations residing in spatial domain of remote sensing images, shown in Table 1, reflect data redundancy which would be reduced by data compression.
2.2 Differential Encoding
The steps of the differential encoding are as follows:
1. Substitute the difference of gray values pertaining to two neighboring rows (or columns), i.e., the ith (i2) and the (i-1)th, for the gray values of Row(or Column) i. That is, giXiXi1.
2. Substitute the e difference of gray values pertaining to two neighboring columns (or rows), i.e., the jth (j2) and the (j-1)th, for the gray values of Column (or Row) j. That is, gj XjXj1.
3. Huffman encoding would be applied to compress the obtained difference image (g ). ij
The three steps are together called bidirectional differential encoding. A mutually exclusive execution of Step 1 and 2, together with Step 3, may be treated as a uni-directional differential encoding algorithm.
2.3 District Forecast Differential Coding
From the perspective of information theory, the information amount provided by a remote sensing image is not only lying on the transit capacity of information during the imaging process (Tao and Tao, 2004), but resting with the land objects, i.e., the uncertain degrees of landscapes.
Given a landscape with n possible states, the probabilities of which are respectivelyPi ,i1,2,n, the uncertain degree of it may be characterized by entropy
i
If a landscape, e.g., built-up areas, is of great uncertainty calculated by Formula (4), the information amount of the remote sensing image which imaging the landscape will be large. Otherwise, a landscape exemplified by seawater would be of less uncertainty, whose information amount contained in the remotely sensed image could be much smaller compared to the built-up areas even if the spatial resolution of the image is higher. Therefore, the image covering built-up areas would have less redundancy and a higher compression rate than the image of seawater even if the images are of the same resolution. As a kind of entropy coding method, the encoding efficiency of Huffman coding, to a great extent, lies on how accurate the prediction on probability distribution of data is. Hence, if we are capable of carrying out the histogram statistics of the historic images according to the preconcerted satellite orbit, and further utilize the statistics to implement district forecast differential encoding, the compression rates will be further improved.
2.4 Near Lossless Compression of Edge Protected Images
If demand for lossless compression can be loosen to a near-lossless compression, the compression rate is expected to be further improved.
The stereo measurements in modern photogrammetry are basically accomplished by means of automatic stereo image matching. The principal factor affecting the accuracies of stereo measurements is the edge features of images. As long as the edge features are immune to destructions, the accuracies may be expected to be consistent. Therefore, an edge protection operator is utilized to appropriately filter out the high frequency noises which could help to magnify the signals and further improve the compression rates.
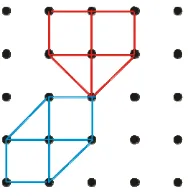
Figure 1. Edge Protection Smoothing Operator An edge protection smoothing operator is shown in Figure 1, in which the black solid circles represent pixels and the red and blue polygons represent directional pointers. In a window of 5 by 5 pixels, the pointers cover eight directions. The steps for executing this operator include: (1) computing the variance of gray values of the covered pixels in each pointer; (2) treating the direction with maximum variance as an edge, while regarding the minimum variance as plainness; (3) substituting the average value for the central value in the direction with the minimum variance; (4) shifting the window until the image is ergodic. After the application of this operator, the compression rate of a certain image is expected to be further improved.
3. EXPERIMENTS AND ANALYSIS
3.1 Differential Coding
Two remote sensing images, as shown in Figure 2, are utilized to test the effects of differential encoding. (a) is a Landsat-5 TM image consisting of Band 5, Band 4 and Band 3, the spatial resolution of which is resampled to 28.5 meters. And the main land cover types of this image include water body, farmland, built-up areas and mountain areas. (b) is a SPOT-5 panchromatic image with a spatial resolution of 2.5 meters, in which built-up areas and farmland are the main land cover types. Both of the images are made up of 500 by 500 pixels.
The following experimental steps are carried out for the aforementioned images:
1. Compute entropies, auto-correlation coefficients and information amount of the images
2. Apply Huffman coding to the images without any decorrelation process.
3. Utilize differential encoding to eliminate the correlation of pixels and encode the difference images.
4. Compute the average code lengths and compression rates of the Huffman coding and differential encoding, respectively.
(a) Landsat-5 TM (b) SPOT-5 Figure 2. Testing images for differential coding The results are listed in Table 2. The average code lengths of the compressed images are very close to the entropies of the original images. It confirms that Huffman coding is definitely a good entropy encoding algorithm. Compared to the Huffman coding, the average code lengths of the compressed images by differential encoding are much more close to the corresponding information amounts. Especially, the average code length of compressed SPOT panchromatic image by bidirectional differential coding is 3.66, which is very close to the information amount of 3.44. Moreover, the compression rate is nearly two times as large as that of Huffman coding. By means of the information measures, analysis on data characteristics and a sufficient consideration of the correlativity of data will help to find effective data transform algorithms, which is capable of reducing the data redundancy and improving the compression rates of lossless compression.
Both of the unidirectional and bidirectional differential coding algorithms are first order. Although the average code lengths of the compressed images are closer to the information amounts of the original images, the still remained difference manifests an incomplete decorrelation. Hence, second order or higher order differential coding algorithms may be adopted to further reduce the variance of data and to reduce correlativity.
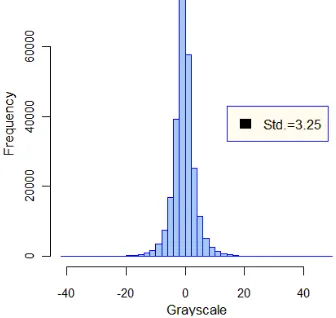
The essence of differential transform is equivalent to a reduction of the variance of gray values. The range of grayscale after the transform is so remarkably narrowed that the standard deviation is decreased from 23.05 (in Figure 3) to 3.25, which greatly cuts down the dispersion of the grayscale distribution. Moreover, a significant characteristic of normal distribution appears after the differential transform, as is shown in Figure 4. The purpose of differential encoding is to reduce the correlation among pixels to the maximum extent. This algorithm is easy and simple to implement which makes it worthy of application in satellite Earth data transmission to economize in resources and improve transmission efficiency. Besides, Deng and Lin (2009) applied this algorithm to the remote sensing images of “Beijing-1” micro-satellite. Compared with the experiments of DPCM, the effect of this algorithm is more favorable due to its decorrelation process which achieves a more than two times compression rate.
TM Band-5 TM Band-4 TM Band-3 SPOT
Entropy (bits) 6.48 6.01 5.00 6.17
Information amount (bits) 4.38 3.40 1.60 3.44
Huffman Coding Average code length 6.51 6.04 3.97 6.20
Compression rate 1.23 1.32 2.01 1.29
Uni-directional differential coding
Average code length 5.22 4.85 3.97 4.50
Compression rate 1.53 1.65 2.01 1.78
Bidirectional differential coding
Average code length 5.12 4.77 3.88 3.66
Compression rate 1.56 1.68 2.06 2.19
Table 2. Comparisons between Huffman coding and differential coding
Figure 3. Grayscale histogram of the initial image
Figure 4. Grayscale histogram of the differential image 3.2 District Forecast Differential Coding
Four types of representative land covers are selected and shown in Figure 5. All of them are SPOT-5 panchromatic images with a 2.5 meter spatial resolution, consisting of 1024 by 1024 pixels. Differential encoding algorithm was applied to these four images, with results shown in Table 3. The results accord with what is expected, i.e., the compression rates of the images are in reverse proportion to the information amounts. The land covers with larger information amounts, e.g., urban areas and farm lands, would achieve smaller compression rates, and vice versa (e.g., mountain areas and water bodies). Therefore, according to the negative correlation between information amount and
compression rate, a district forecast differential encoding method is proposed to further improve the compression rates of remote sensing images.
First, images may be categoried by the texture complexities, e.g., built-up areas, farmlands, forests, deserts, water, etc. For different land cover types, differential encoding algorithm is applied. And the more effective one between unidirectional or bidirectional differential encoding is selected for each land cover type according to the compression efficiencies. At last, the corresponding compression modules would be built for each type.
Moreover, due to the definitive orbits of satellites, land cover types inherent to remote sensing images are relatively certain. As is mentioned above, the information amounts inherent to images are different because of different land cover types, which results in different compression rates. Hence, historic remote sensing images may be firstly collected to judge the land cover types when satellite flying over certain districts. In other words, the orbit is divided into districts according to land cover types. As the satellite flying over oceans, the differential encoding module for this type may be executed to compress the image data. Similarly, the differential encoding module for forest may be called when the satellite flying over a forested area. In this way, the differential coding algorithms may be applied to images according to different districts so as to obtain higher compression rates and sufficiently and effectively usage of the limited storage space on-board.
3.3 Near Lossless Compression
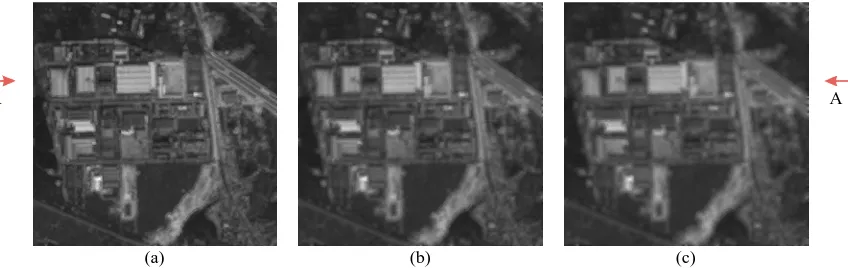
To testify, the operator is applied to the SPOT-5 image in Figure 2(b) one time, two times and three times, respectively. The result images are shown in Figure 6, and the corresponding compression results of Huffman coding and differential encoding are listed in Table 4, where the times of edge protection smoothing set to naught equals to directly applying the encoding algorithms to the original image.
According to Table 4, with the times of edge protection smoothing increasing, the compression rates of Huffman coding are seldom improved. However, significant improvements in both the average code length and compression rate may be achieved after the application of differential coding. Moreover, considering different uncertainties of different land cover types, the same comparative experiments are applied to the four images shown in Figure 5, the results of which are listed in Table 5. It is obvious that different land cover types will obtain different compression rates. Furthermore, the lower the information amount is, the higher the compression rates would be achieved.
In Table 4, as the smoothing times increase, the entropies and information amounts are correspondingly reduced, which reveals information loss during the edge protection smoothing process. Meanwhile, the gradually blurred images (in Figure 6) after increased times of smoothing also suggest the information loss to some extent. Therefore, the edge preserved smoothing method is proposed to be integrated with the district forecast differential encoding so as to further improve compression rates. But the spatial resolution of images should be considered. For example, urban areas are characterized by point and linear details inherent to images. If the spatial resolutions of images are relatively higher, the times of edge protection smoothing are supposed not to be too much in order to avoiding large information loss. Otherwise, the land cover types with large redundancy, exemplified by water, would be compressed with a
significantly improved compression rate because of the edge protection smoothing.
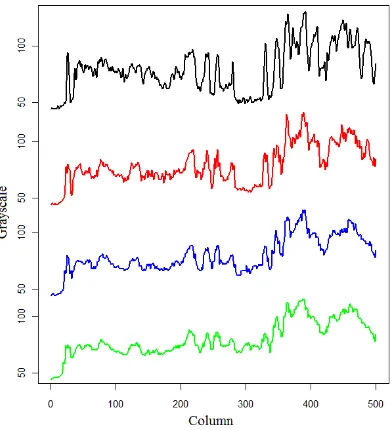
Besides, a sectional drawing is plotted along with the A-A direction, as is shown in Figure 7. The black curve represents the gray values of the A-A section pertaining to the original image, while the red, blue and green curves respectively represent the gray values of the A-A section after once, two times and three times edge protection smoothings. It is clear that the edges are relatively enhanced by the smoothing. Moreover, the positions of edges are relatively permanent. Hence, this kind of smoothing is immune to edge destruction, which will maintain the accuracies of stereo matching.
Urban areas Farmland Mountain areas Water
Entropy (bits) 6.12 4.89 4.13 3.27
Information amount (bits) 4.31 2.94 2.24 1.65
Huffman Coding Average code length 6.16 4.91 4.17 3.31
Compression rate 1.30 1.63 1.92 2.42
Uni-directional differential coding
Average code length 4.97 3.62 3.18 2.41
Compression rate 1.61 2.21 2.52 3.32
Bidirectional differential coding
Average code length 3.93 3.31 2.78 2.32
Compression rate 2.04 2.42 2.88 3.45
Table 3. Huffman coding and differential coding of images of four land cover types
(a) built-up area (b) farmland (c) mountain area (d) water
Figure 5. Remote sensing images of for typical land cover types
A A
(a) (b) (c)
Figure 6. Resulting images after different times of edge protection smoothing: (a) one time; (b) twice; (c) three times
Times of edge protection smoothing Naught One Two Three
Entropy (bits) 6.17 6.11 6.08 6.06
Information amount (bits) 3.44 2.99 2.44 2.08
Huffman Coding Average code length 6.20 6.13 6.11 6.11
Compression rate 1.29 1.30 1.31 1.31
Uni-directional differential coding
Average code length 4.50 4.13 3.63 3.32
Compression rate 1.78 1.94 2.20 2.41
Bidirectional differential coding
Average code length 3.66 4.05 3.56 3.22
Compression rate 2.19 1.98 2.42 2.49
Table 4. Comparisons of Huffman coding and differential coding corresponding to different times of edge protection smoothing
Urban areas Farmland Mountain areas water
Naught Average code length 6.12 4.89 4.13 3.27
Compression rate 1.61 2.21 2.52 3.32
One time smoothing
Average code length 5.81 4.78 4.01 3.10
Compression rate 1.74 2.51 2.99 4.36
Two Times smoothing
Average code length 5.63 4.70 3.97 3.06
Compression rate 1.99 3.02 3.81 5.17
Three times smoothing
Average code length 5.51 4.65 3.95 3.07
Compression rate 3.23 3.45 4.29 7.25
Table 5. Unidirection differential coding of different land cover types after different times of edge protection smoothing
Figure 7. A-A sectional drawing
4. CONCLUSION
Obviously, the proposed differential encoding for lossless compression is feasible. Besides, this method is simple and easy to implement which makes it worthy of application in data transmission to economize in resources and improve transmission efficiency. In addition, the satellite orbits may be partitioned into districts according to historical aerial images, remote sensing images, GIS data and so on, together with the establishment of different compression modules, which would serve to compress different land cover images and maximize the compression rates of lossless compressions. Thus, the valuable
transmission channels will be effectively utilized. The edge-protection smoothing is a bit of time-consuming, but enough time is available for on-board smoothing when a satellite is far away from the ground receiving stations. This strategy proves to possess much higher compression rates that would improve the utilization rates of the expensive satellite Earth communication infrastructures. It is of especial importance for a country, exemplified by China, which has not yet constitute a worldwide ground reception station system, and is capable of meeting the requirements of cartographic satellites.
REFERENCE
Deng B., Lin Z. J., 2010. Onboard data lossless compression of remote sensing image based on "District Forecast" differential coding. Science of Surveying and Mapping, 35(1), pp. 10-12 Hu Z. M., 1979. Orthogonal Transformations in Digital Signal Processing. Posts and Telecom Press, Beijing.
Lin Z. J., 1988. Multi-information and Multi-criterion Image Matching. Wuhan Technical University of Surveying and Mapping, Wuhan
Lin Z. J., Zhang Y. H., 2006. Measurement of information and uncertainty of remote sensing and GIS data, Geomatics and Information Science of Wuhan University, 31(7), pp. 569-572.
Tao C. K., Tao. C. K., 2004. Optical Information Theory. Science Press, Beijing, pp. 36-55.
ACKNOWLEDGEMENT
The research is partially supported by “973 Program” grants