ASSESSMENT OF THREE-DIMENSIONAL MODELS DERIVED FROM LIDAR AND TLS DATA
T. Landes, P. Grussenmeyer, H. Boulaassal, M. Mohamed
The Image Sciences, Computer Sciences and Remote Sensing Laboratory LSIIT-TRIO UMR 7005, INSA Strasbourg, France
Commission II, WG4
KEY WORDS: accuracy, precision, assessment, three-dimensional, quality, TLS, LIDAR
ABSTRACT:
This paper suggests the use of specific methods for assessing the geometry of 3D building models, by considering models extracted automatically from terrestrial laser scanning (TLS) data and aerial laser scanning (ALS) data. Well known quality factors have been applied for assessing roofs and façades separately. A projection into 2D makes sense in this case, because currently, 3D models or point clouds of façades are often projected into 2D for generating 2D façade maps, as required in the building trades. For assessing roofs in 3D, error maps have been suggested especially for analysing the spatial distribution of plane adjustment errors which might affect the final reconstructed 3D model. For assessing 3D building vector models as one object, first experiments based on volumetric quality factors are presented. This approach is based on ratios inspired from quality factors that have already proven themselves in the literature for comparing surface areas. The volumes considered here are computed on vector models (faceted solids) and not voxels. Further investigations are necessary on the one hand, for testing the sensitivity of these factors. On the other hand, the approach must be completed by criteria allowing the detection of shape differences, independently of the building volume.
1. INTRODUCTION
Whether airborne or terrestrial, laser scanners have the great potential to enable with high speed the acquisition of 3D data especially in urban areas. If data acquisition seems easy, the subsequent processing steps (filtering, segmentation, reconstruction) are more or less complex. Development of fully automatic algorithms providing reliable 3D building models remains an important challenge, due to the complexity of urban scenes (Akca et al., 2008). Nowadays, no process is able to provide with laser data a 3D city model or even a 3D building in a complete automatic way. Achieving a result is a first important step, but it should be completed by quality assessments. Result assessments for 3D building models are mostly approached in a qualitative visual way. For surveyors, quantitative assessments are essential. Nevertheless, calculating uncertainties in a 3D model is not a trivial task.
Unfortunately, 3D is not yet generalized to the building trades. Many surveyors working with laser scanners are forced to degrade the data into 2D drawings, because the contractors are used to work with 2D maps. Therefore 2D assessment approaches must be considered. For assessing 3D models, statistical criteria and error maps have been used. Finally, for assessing the entire 3D building, quality factors based on volume calculations are suggested.
2. RELATED WORKS
While the general emphasis has been to develop methods and tools for automatic or semi-automatic generation of city models, the concept of quality evaluation has also become very important. Assessment is generally considered at the end of a work and frequently limited to a visual check. A few papers address the topic of quality assessment of 3D building models produced with aerial imagery or LIDAR data (McGlone and Shufelt, 1994; Ragia, 2000; Rutzinger et al., 2009, Akca et al.,
2008, Schuster and Weidner, 2003, etc.). Although city models are being produced worldwide at a very fast rate, there is a certain lack of standardization regarding the evaluation techniques (Akca et al., 2010; Rutzinger et al., 2009). The rigor of an assessment method is often depending on the ground truth available or on the contractor’s specifications. Visual inspection is the minimum required.
The topic of assessment of models produced with TLS data is also a current issue. The quality of the data provided by this increasingly used technology has been analyzed in several papers (Baltsavias, 1999; Reshetyuk, 2006; Lichti, 2010) in order to assess the a priori accuracy of points composing a point cloud.
Approaches leading to 3D models by ALS or TLS generally imply several processing steps, which might contribute to the final error budget. However, when public authorities order the modeling of a city or individual buildings, they are limited to the evaluation of the submitted models. For this reason, only the uncertainties occurring in the reconstruction step will be considered in this paper. More details about the assessment of intermediate results like segmentation results obtained with terrestrial or aerial laser scanner data can be found in (Landes et al., 2012, Tarsha-Kurdi, 2008).
The purpose of this work is to propose solutions for the geometric assessment of 3D vector models obtained by processing of ALS and TLS data. Several methods are investigated. 2D quality factors and errors metrics like RMSE are produced, as suggested in Rutzinger et al. (2009) or Schuster and Weidner (2003). Also less common indicators, like error maps or volumetric quality factors are suggested. These assessment approaches will be illustrated on 3D building facades obtained from TLS data, and on 3D building roofs obtained from LIDAR data acquired in Strasbourg, France. Every accuracy assessment study includes three fundamental steps (Congalton, 2009): firstly, design the accuracy assessment sample; secondly, collecting data for each sample, and finally, analyzing the results.
It is useful to remind the distinction between accuracy and precision, because both concepts are sometimes mixed up in the literature. Accuracy calculations suppose that a reference model (ground truth) is gained through an independent and more precise surveying technique than the laser scanning technique. Precision describes the way the points are distributed around the most probable value of the observation or result. Thus for gaining a reference model for precision calculations, it is appropriate to work on the same data, but to use a more precise method for the model creation (generally manual).
3. ASSESSMENT OF RECONSTRUCTED 3D BUILDING MODELS
An interesting study towards quantitative quality evaluation of building models has been achieved in Schuster and Weidner (2003). They refer to approaches developed in (McKeown et al. 2000) and (Ragia, 2000) generally for 2D pixel based analysis. Also Song and Haithcoat (2005) suggest the use of surface area based indicators. These indicators are originally coming from remote sensing classification assessments (confusion matrix). But they can also be applied on vector polygons, which surface area will be compared to surface areas of reference polygons. Since point clouds acquired on façades are still too often “degraded” into 2D maps, these factors have been selected for helping to assess 2D building façade models. Also for the assessment of roof models extracted from LIDAR data, these factors provide interesting results.
3.1 Assessment of façade and roof models in 2D
The roofs and façades are produced through as 3D vector data. As mentioned above, several quality factors expressed as ratios have been selected in the literature and calculated on the basis of surface areas of vector polygons. Table 1 reminds their expression where SR means the surface area of the reference vector polygon and ST the surface area of the polygon to be tested.
Quality factor Explanation
Detection rate: it is the ratio between the intersection area between two planes and the reference plane. ρd = 1 means that the calculated polygon is perfectly superposed to the reference polygon.
Quality rate: it is the ratio between the intersection area between two planes and the union of two planes. ρq = 1 means that both polygons are perfectly superposed.
Branch factor: it is the ratio of the part of the reference polygon which is not included in the polygon under study and the intersection of the two polygons.
Miss factor: Ratio of the part of the polygon being evaluated which is not included in a reference polygon and the intersection of the two polygons.
False alarm rate: it is the ratio of the part of the reference polygon which is not included in the polygon under study compared to the area of the reference polygon.
Table 1. Quality factors used to evaluate surface areas of polygons in vector models
The main difficulty consists into defining an adequate reference model. Satisfying results are reached when the value of ρd and ρq is close to 1, and the three others are close to 0.
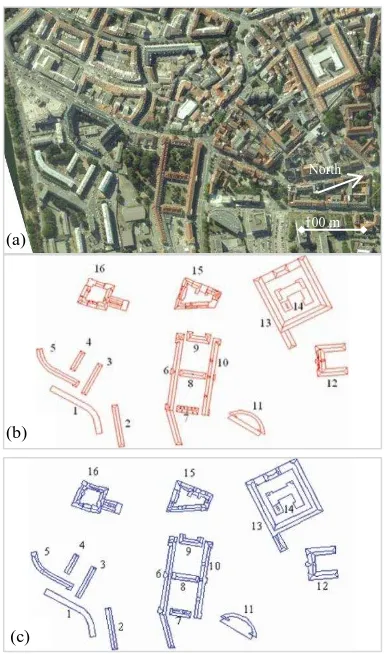
3.1.1 Roofs assessment: A complete processing chain leading to 3D building models based exclusively on LIDAR data has been developed in (Tarsha-Kurdi et al., 2008). One algorithm of this chain deals with the reconstruction of roofs and provides automatically 3D vector models of roofs. The reference model chosen for assessment is a stereorestituted vector map of roofs. Roofs are composed of planes, edges and nodes. The point cloud used presents a low point density (1.3 points/m²), and covers the center of Strasbourg where 16 buildings with different levels of complexity have been chosen (Figure 2). The accuracy analysis of these samples based on the quality factors provides mean values higher than 0.83 for ρd and ρq, and lower than 0.13 for ρb, ρm, ρf (Tarsha-Kurdi et al., 2008). These good values confirm the efficiency of the algorithm. Obviously, the point cloud characteristics (density, accuracy, noise), and the complexity of the roof impact the final result.
Figure 2. (a) Aerial image of a test site in Strasbourg; (b) vector model of building roofs obtained (b) by photogrammetric stereorestitution (reference) and (c) by automated approach (Tarsha-Kurdi et al., 2008).
Two types of errors may cause bad rates for the quality factors. If small objects on the roof (antennas, chimneys, windows) cannot be modeled due to the low point density, they affect the roof plane equation. They appear in the global error budget like systematic errors. Since the reference roof models have been produced with independent photogrammetric data, also errors stemming from geocoding uncertainties might distort the plane
(b)
(c) (a)
100 m North m
equations of the roofs and therefore their contours in the 2D plane.
When LIDAR is not able to capture points on building façades, a reconstruction of the buildings by combination of TLS and ALS data is required (Boulaassal et al., 2011). At this stage the assessment must be continued on façades.
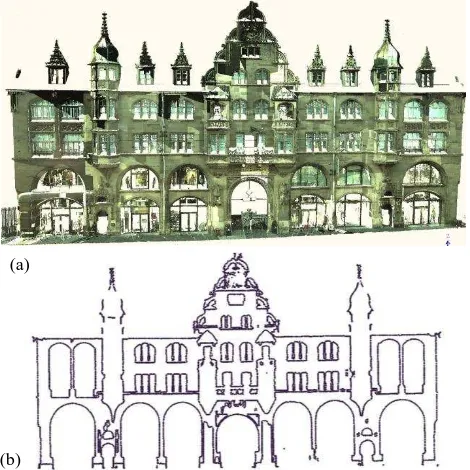
3.1.2 Façades assessment: The building façades reconstruction based on TLS data can be assessed by comparing a survey map with the vector model projected on a plane. A complete processing chain leading to 3D geometric façade models has been developed in (Boulaassal et al., 2009) and assessed in (Landes et al., 2012). For illustration purpose, an old building in the center of Strasbourg has been scanned by TLS (Leica C10) with 1 point every cm after registration of three point clouds (Figure 3). It has been chosen for its architecture and because a 3D elevation map produced by stereorestitution was available (Figure 4).
Figure 3. Scanned façade of a complex architectural building (a) and extracted contours (b)
After segmentation in planes, the contour points of the main façade plane have been extracted (Figure 3b) and adjusted in order to produce a vector model of the façade. A few polygons from the restituted model have been chosen for the contours evaluation (Figure 4).
Figure 4. Restituted map (in black) with assessment contours (in red). Extracted contour points appear in magenta.
Sample No.
ST (m²)
SR (m²)
ρd ρq ρb ρm ρf
1 19,36 18,31 17,96 0,93 0,89 0,07 0,01 0,01
2 1,75 1,72 1,66 0,95 0,90 0,05 0,03 0,03
3 5,81 5,65 5,51 0,95 0,92 0,05 0,02 0,02
4 38,26 37,55 37,62 0,98 0,97 0,02 0,00 0,00
5 18,62 17,94 18,12 0,97 0,95 0,03 0,01 0,01
mean 0,96 0,93 0,05 0,02 0,02
Table 5. Quality factors calculated for 5 polygons extracted in the façade.
Then the quality factors ρd, ρq, ρb, ρm, and ρf have been calculated for 5 windows, of various sizes, and showing visually the highest differences with the reference (Table 5). The quality factors are very satisfying and confirm the quality of the produced 2D vector map. However, they do not quantify the geometric accuracy of the reconstructed façade elements. To complete the assessment, errors metrics like the calculation of deviations and RMSE are relevant. Here, the 3D deviations between the 5 reference contours and the calculated contours reach 6 to 20 cm depending on the window, i.e. 12 cm in average. The RMS error of all the Euclidian distances in 3D reaches 14 cm, which could be better given the technology involved. A visual inspection enables to understand these results. Given that the calculated contours are based on the point cloud, they cannot describe the parts of the façade which are hidden when scanned from a terrestrial point of view (see the shadows at the bottom of windows in Figure 6). Therefore, a visual assessment is essential for justifying the sometimes low geometric accuracy.
Figure 6. Impact of shadows on the reconstruction of the façade. (a) Reference vector model in red and extracted contour points in magenta before vectorization; (b) colorized TLS point cloud.
As a summary, for 2D analyses, the quality factors are useful for roughing out the detection quality, although they imply the definition of thresholds. However, they are not sufficient for assessing the geometric position of the vectors and must be supplemented by statistical criteria like deviations and RMSE.
3.2 Assessment of 3D models
This section considers the assessment of 3D models of roofs and finally of the entire building.
3D roofs assessment: Rottensteiner (2003) suggests the analysis of Root Mean Square Errors (RMSE) for analyzing the precision of the complete 3D building. RMSE are interesting to analyze, especially when plane adjustments are carried out, as it is the case for roofs. However, RMSE describe only the dispersion of points around an average value but not their spatial distribution, which is assumed to be Gaussian. For this reason, a method is proposed for completing the assessment of the 3D roof vector model previously converted into raster format. It is based on the calculation of the distance between each point of the cloud and the mean plane to which it is assigned.
(a) (b)
(a)
(b)
An image called ‘error map’ is produced for every plane entering into the model. A pixel value of zero means that the model coincides with the point cloud. Several buildings acquired with high density (7 points/m²) by ALS over an industrial area have been modeled. Subsequently errors maps have been calculated. Figure 7 presents an example of a building of simple geometry. As deduced from in the error map, more than 90 % of the points are located in +/- 0.25 m around the adjusted roof plane. Since a large amount of pixels is close to zero, it can be affirmed that the results are precise but not necessarily accurate since the reference model is derived from the same data as the those used for reconstruction.
The building roof shown in Figure 8 is of complex architecture and has been extracted from ALS data with lower density (1.3 point/m²). Since the small roof details cannot be detected in that case, they enter in the plane calculation like points describing actually the roof. This influences inevitably the building error map, in which only 60% of points are located in the interval +/-30cm around the plane. Consequently, the roof plane equations are unrealistic and the 3D building model contains visual distortions. Therefore, the error map is helpful for improving the calculation of the roof plane models and consequently the 3D building model. More details can be found in (Tarsha-Kurdi, 2008).
Figure 7. Color coded error map (left) for a 2D roof model (right) of a simple building (Hermanni site)
Figure 8. Automatic building modeling of a complex building (Strasbourg site). From left to right: aerial image, error map, complete (distorted) 3D building model.
The same principle can be applied for assessing the accuracy (instead of the precision) of the roof plane extraction. This means having a reliable reference, which is validated as exact (ground truth). In this case, a difference image between label images could be carried out and pixel-based performance metrics can be adopted (Rutzinger et al., 2009).
3.2.2 Entire 3D building assessment: Considering a building as one object, volume comparisons seem to be rather appropriate than surface areas comparisons. Volume comparisons between reference building and modeled building cannot be considered alone, because volume metrics are affected by the building size. Thus, in presence of a majority of small buildings, object-based performance metrics like the volume metric may lead to high error rates (McKeown, 2000; Rutzinger et al., 2009). A new approach aiming to evaluate 3D
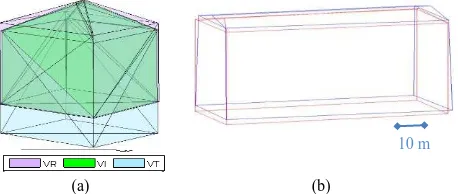
buildings is experimented here. The quality factors used in section 3.1 and also applied in (Mohamed and Grussenmeyer, 2011) for plane-based accuracy assessment in photogrammetry, have been extended to the assessment of 3D volumes. It suggests a volume based comparison between a 3D building vector model and an accurate 3D reference model (Figure 9). The volumes are not computed on voxels but on solids obtained by meshing the vector models. The “volumetric” quality factors used for the assessment express the relationships between the volume of the modeled building and the volume of its reference. They take into account the volume of their intersection as well as the volume of their union. Figure 9a illustrates the volume of the reference model (VR), volume of the tested model (VT) and the volume of intersection (VI). Table 10 details the volumetric quality factors. Satisfying results are reached when the value of Vρd and Vρq is close to 1, and the three others are close to 0.
Figure 9. (a) Relationship between reference model (VR) and tested model (VT), with ; (b) superimposition of the reference model (in red) and the extracted model for the building No. 2 (in blue).
For this first experiment, a 3D building model has been extracted by processing of low density LIDAR data (1.3 point/m²). The 3D reference building model has been created based on the photogrammetric processing of images acquired with UltraCam-X stereopairs. The pixel size on the ground is about 16 cm. An accuracy of about 16 cm in X, Y and 25 cm in Z can be estimated for a point digitized in the stereopairs. It is satisfactory, considering that the accuracy of the LIDAR point clouds used here is lower (around 30 to 40 cm in X, Y, Z). Building No. 2 in Figure 2 has been chosen and compared to its reference. The building is about 10m large, 82 long and 22 high. Figure 9b presents the tested model in blue and the reference model in red.
The resulting volumes and quality factors for the building under study are presented in Table 11.The values obtained for the quality factors show that and are higher than 0.8 and the other three factors are close to zero. This means that the 3D building models extracted from both LIDAR and from stereopairs are closed from each other. Since the photogrammetric model is more accurate, the model provided by LIDAR data processing is therefore validated.
This example is interesting, because it shows the interest to undertake an analysis of the entire model in 3D. By applying the assessment on surface areas (see section 3.1) for each side of the building, the results would obviously be much better (values higher than 0.93 for for example) because projected in 2D, the planes overlap very well. Thus, a 2D analysis alone would overestimate the quality of the model.
(a) (b)
10 m
Table 10. Volumetric quality factors for assessing 3D building volumetric quality factors for a building.
This volume based approach has the advantage to be easy to apply, and to be data and process independent; it requires only reference datasets. A drawback is the necessity for the user to set a threshold for describing the level of concordance between models. As mentioned in (McKeown, 2000), the metrics should not be tunable via thresholds, because they introduce a subjective element into evaluation.
Moreover, the quality factors might be favorable although the building shape is not validated. Figure 9b clearly shows that a vertical shift affects the model to be tested. Any shift or rotation between the reference and the tested model will affect the intersection volume between the models. But the same shift for a small or for a big building will not provide the same factors. The sensitivity of the approach regarding the effect of the building size, building shape, building shifts, rotations must be analyzed.
However, it becomes clear that the calculation of volume ratios for assessing the quality of 3D building modeling is not sufficient.
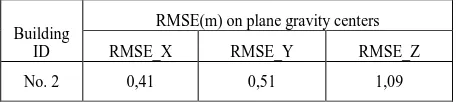
For taking into account the shifts, a RMSE is computed based on the deviations between both models, in X, Y and Z directions. Deviations are not calculated between homologous nodes, but between centers of gravity of homologous planes that compose the tested and respectively the reference building. This choice has been made, because it is not trivial –for our knowledge- to automatically find corresponding vertices to compute the RMSE between the vertices of two vector
buildings in 3D. Table 12 presents the RMSE results obtained for the building under study. The value of RMSE in X-direction is about 0.4 m while the RMSE in Y-direction is 0.5 m and 1 m
Table 12. RMSE values obtained for the planes of the building No. 2
The error budget affecting the final product is not only composed of errors due to the reconstruction algorithm, but also of errors coming from a low point cloud density, errors due to the georeferencing of the LIDAR and the aerial data, due to the shape of the produced buildings, etc. Several tests applied on a large sample of building reveals that a systematic error affects the Z coordinates of the LIDAR data used here. This vertical shift has already been observed in a study where LIDAR data have been combined to TLS data (Boulaassal et al., 2011). Once detected, this error must be corrected for the whole dataset before starting again the assessment.
At this stage, further investigations regarding the completeness of the assessment approach as a combination of quality factors and statistical criteria are necessary. As underlined in (Rutzinger et al., 2009), there is no single optimum evaluation technique and the combination of several evaluation methods is advised. Regarding the setting of thresholds for the volumetric quality factors and the RMSE values, a standard model inspired from a national order helping the contractors checking the quality of subcontracted work is under study.
4. CONCLUSION
Currently, no standard has been defined to assess 3D models and which automatically assess whether a 3D model is acceptable or not. This paper presents the assessment of 3D vector models of façades, roofs and complete buildings, using several approaches. Of course, visual inspection cannot be avoided. For assessing façades or roofs outlines in 2D, quality factors already suggested in the literature have been applied. For assessing 3D vectors, statistical criteria like RMSE are somewhat restrictive and that’s why they have been supplemented by error maps. For assessing entire 3D building models, quality factors based on volume ratios have been considered and completed by RMSE considerations. This approach must be further investigated regarding shape characteristics of the buildings.
Our future researches will also focus on the study of a standard assessment model, helping the end user to make a judgment on the level of accuracy provided by the building models with respect to their requirements. Finally, the main difficulty of assessment approaches is to create sufficient high quality reference data at low cost.
5. REFERENCES
Akca, D., Freeman, M., Sargent, I. and Gruen, A., 2010. Quality assessment of 3d building data. Photogrammetric Record Vol. 25 (132), pp. 339-355. between the volume of intersection of the two buildings and the volume of the reference building. Vρd close to 1 means that the calculated model is perfectly superposed to the reference building.
Volumetric quality rate: it is the ratio between the parts which are common to both volumes and the union of the two volumes.
Volumetric branch factor: it is the ratio of the part of the reference building volume which is not included in the building volume under study and the intersection of the two volumes.
Volumetric miss factor:it is the ratio of the part of the volume being evaluated which is not included in the reference volume and the intersection of the two volumes.
Volumetric false alarm rate: it is the ratio of the part of the reference volume which is not included in the volume under study compared to the volume of the reference polygon.
Baltsavias, E. P. 1999. Airborne laser scanning: basic relations and formulas. ISPRS Journal of Photogrammetry and Remote Sensing, 54(2–3): 199–214.
Boulaassal, H., Landes, T., Grussenmeyer, P., 2009. Automatic extraction of planar clusters and their contours on building façades recorded by terrestrial laser scanner. In Special issue of the International Journal of Architectural Computing IJAC, Issue 07, Vol. 01, p. 1-20.
Boulaassal, H., Landes, T., Grussenmeyer, P., 2011. Reconstruction of 3D Vector Models of Buildings by Combination of ALS, TLS and VLS Data. 4th 3D-ARCH International Conference on 3D Virtual Reconstruction and Visualization of Complex Architectures, Trento (Italy), 2-5 March 2011, 6 pages.
Landes, T., Boulaassal, H., Grussenmeyer, P., 2012. Quality assessment of geometric façade models reconstructed from TLS Data. The Photogrammetric Record, DOI: 10.1111/j.1477-9730.2012.00674.x, 18 pages.
Lichti, D. D., 2010. Terrestrial laser scanner self-calibration: correlation sources and their mitigation. ISPRS. Journal of Photogrammetry and Remote Sensing, 65(1): 93–102.
McGlone, J. C. and Shufelt, J. A., 1994. Projective and object space geometry for monocular building extraction. IEEE Computer Society Conference on Computer Vision and Pattern Recognition. 54–61.
McKeown, D., Bulwinkle, T., Cochran, S., Harvey,W., McGlone, C. and Shufelt, J., 2000. Performance evaluation for automatic feature extraction. IAPRS International Archives of Photogrammetry and Remote Sensing, Vol.33, pp. 379-394.
Mohamed, M., Grussenmeyer, P., 2011. Plane-based accuracy assessment in photogrammetry: comparison of Rollei Medium format and Ultracam-X digital cameras. GTC2011 Symposium, Geomatics in the City, Jeddah, Saudia Arabia, May 11-13, 6 pages.
Ragia, L., 2000. A quality model for spatial objects. International Archives of Photogrammetry and Remote Sensing, 33(B4): 855–862.
Reshetyuk, Y., 2006. Investigation and calibration of pulsed time-of-flight terrestrial laser scanners. Licentiate thesis in Technology, Royal Institute of Technology (KTH), Stockholm, Sweden. 152 pages.
Rottensteiner, F., 2003. Automatic generation of high-quality building models from LIDAR data. IEEE Computer Graphics & Applications, 23 (6), 42-51.
Rutzinger, M., Rottensteiner, F., Pfeifer, N., 2009. A comparison of evaluation techniques for building extraction from airborne laser scanning. IEEE Journal of selected topics in applied earth observations and remote sensing, Vol. 2, No.1.
Schuster, H. F. and Weidner, U., 2003. A new approach towards quantitative quality evaluation of 3D building models. ISPRS Commission IV Joint Workshop on Challenges in Geospatial Analysis, Integration and Visualization II, Stuttgart, Germany. 8 pages
Song, W. and Haithcoat, T.-L, 2005. Development of comprehensive accuracy assessment indexes for building footprint extraction, IEEE Trans. Geosc. Remote Sensing, vol. 43, no. , pp. 401-404.
Tarsha-Kurdi, F., Landes, T., Grussenmeyer, P., 2008. Extended RANSAC algorithm for automatic detection of building roof planes from LIDAR data. The Photogrammetric Journal of Finland. Vol. 21, n°1, 2008, pp.97-109.
Tarsha-Kurdi, F., 2008. Extraction et reconstruction de bâtiments en 3D à partir de relevés LIDAR aéroportés. PhD Thesis of the Strasbourg University, supervised by INSA Strasbourg.
6. ACKNOWLEDGEMENTS
Authors want to thank Fayez Tarsha-Kurdi, who made his PhD at the INSA Strasbourg until 2008. Some datasets of his work have been used in this paper.