Linking technical change to research effort:
an examination of aggregation and spillovers effects
Greg Traxler
a,∗,1, Derek Byerlee
b,2aDepartment of Agricultural Economics and Rural Sociology, Auburn University, Auburn, AL 36841-5406, USA
bThe World Bank, Washington, DC, USA
Received 20 September 1998; received in revised form 8 February 2000; accepted 1 March 2000
Abstract
We used a disaggregate approach to examine investment efficiency of wheat breeding research in India. India’s total research effort comprizes 20 research programs spread across 50 experiment stations. A technology spillover matrix was constructed for both potential and actual spillovers. Spillovers and free-riding were dominant characteristics of technical change during the period studied. Although the aggregate rate of return to wheat improvement research in India was estimated to be 55%, eight programs were found to have earned a negative rate of return when spillins were taken into account. Research output is concentrated on a few strong programs. The two strongest programs generated 75% of all the technical change benefits, even though they claimed just 22% of research resources. These two programs include a significant degree of overlap, while on the other hand many farmers were not reached by any of the programs — 56 and 78% of rainfed and durum area, respectively, in 1990 was still sown with pre-1976 varieties. © 2001 Elsevier Science B.V. All rights reserved.
Keywords: Technical change; Wheat; India; Spillovers
1. Introduction
Economists have now conducted hundreds of stud-ies to estimate the returns to investment in agricultural research (Evenson and Rosegrant, 1993; Alston et al., 1995). Most have been applied at a very aggregate level of either the state or national research system (Alston and Pardey, 1996, p. 199). Results of these studies have generally confirmed the high payoff to agricultural research, and have been instrumen-tal in influencing policy makers to increase funding
∗Corresponding author. Tel.:+1-334-844-4800;
fax:+1-334-844-5639.
E-mail address: [email protected] (G. Traxler).
1Associate Professor. 2Principal Economist.
for research. However, in many cases, expansion of agricultural research systems has occurred across the board, with relatively little use of economic analysis to decide which programs to establish or enlarge. Most research systems have now ceased to expand and the information provided by aggregate rate-of-return studies is of limited usefulness in today’s climate of declining funds. Attention has now shifted to finding means of enhancing the impact of existing levels of re-search appropriations and to strategically downsizing research programs. To date few attempts have been made to disaggregate rates of return in a manner that corresponds to the operational authority of research administrators who will be guiding the reallocation of research resources among programs.
The value of empirical analyses of agricultural research impacts in allocating research resources has
been further limited by difficulties in dealing with the effects of technology spillovers — benefits generated by the adoption of an innovation outside the mandate area of the research institution making the discov-ery. Spillover effects are, in Griliches’ (1992, p. 29) words “both prevalent and important” and, therefore, are an important factor to consider in empirical anal-yses because their omission may cause the source of research benefits to be attributed incorrectly, biasing the rate-of-return estimates. Studies that have consid-ered spillovers have mainly used some prior notion of ‘research proximity’ or apparent transferability to focus on the potential impacts of spillins (e.g. Davis et al., 1987; Pardey and Wood, 1994). A few studies have presented econometric evidence supporting such priors (Jaffe, 1986; Evenson, 1991; Maredia et al., 1996; Schimmelpfennig and Thirtle, 1997). But few attempts have been made to directly measure realized technology spillovers of agricultural technologies or to link them to research investments.3 If technology spillovers can be anticipated, research managers may be able to improve the efficiency of research invest-ments by targeting resources to programs that generate spillovers and eliminating programs that are free-riding on research from more productive programs.
This study examines a large national wheat breed-ing research effort that comprizes 20 research pro-grams and 50 experiment stations. Ex-post technology spillovers are identified using varietal pedigree and dif-fusion data. The rate-of-return (ROR) to each of the 20 research programs is estimated using this information. To measure the extent of bias in ROR estimates that would be induced by not taking technology origin into account, these estimates are compared to naive esti-mates which assume there were no technology spillins from adjoining research programs. We find spillovers to be a dominant force in technical change — 70% of all the technical change emanates from spillovers from other research programs in the national system. This represents important information for administra-tors seeking to redeploy research resources without risk of reducing the overall availability of technology to farmers.
The specific case examined is wheat breeding research in India. The Indian wheat breeding research
3Brennan and Fox (1995) and Evenson and Rosegrant (1993) are two exceptions.
effort has been highly successful as measured by widespread adoption of modern semidwarf wheat varieties (MVs) during and following the Green Rev-olution, and by the high estimated overall return on investment in wheat research (Kahlon et al., 1977; Evenson and McKinsey, 1991). Nonetheless, growth in public funding for agricultural research in India has slowed amid increasing concern about research dupli-cation and overstaffing (World Bank, 1990). Focusing on the post-Green Revolution period subsequent to the widespread adoption of MVs, we estimate the resources deployed in research programs, the rate of genetic gain achieved in each target production environment and the ex-post return on investment for each program, with and without acknowledging the origin of spillovers. We find that although the overall research effort has provided a high return on investment, research output is concentrated on a few strong programs, and research benefits accrue to a concentrated geographic area.
2. Background
India is the world’s second largest wheat produc-ing country, with a wheat area approximately equal to that of the US. Wheat production stretches across a north–south distance of nearly 2500 km, under a wide range of agroclimatic conditions, cropping systems, abiotic stresses (primarily heat and drought) and biotic stresses (primarily rust diseases).
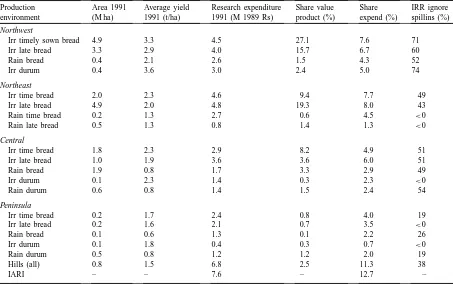
Table 1
Production, research indicators and IRR ignoring spillins, by environment Production
environment
Area 1991 (M ha)
Average yield 1991 (t/ha)
Research expenditure 1991 (M 1989 Rs)
Share value product (%)
Share expend (%)
IRR ignore spillins (%)
Northwest
Irr timely sown bread 4.9 3.3 4.5 27.1 7.6 71
Irr late bread 3.3 2.9 4.0 15.7 6.7 60
Rain bread 0.4 2.1 2.6 1.5 4.3 52
Irr durum 0.4 3.6 3.0 2.4 5.0 74
Northeast
Irr time bread 2.0 2.3 4.6 9.4 7.7 49
Irr late bread 4.9 2.0 4.8 19.3 8.0 43
Rain time bread 0.2 1.3 2.7 0.6 4.5 <0
Rain late bread 0.5 1.3 0.8 1.4 1.3 <0
Central
Irr time bread 1.8 2.3 2.9 8.2 4.9 51
Irr late bread 1.0 1.9 3.6 3.6 6.0 51
Rain bread 1.9 0.8 1.7 3.3 2.9 49
Irr durum 0.1 2.3 1.4 0.3 2.3 <0
Rain durum 0.6 0.8 1.4 1.5 2.4 54
Peninsula
Irr time bread 0.2 1.7 2.4 0.8 4.0 19
Irr late bread 0.2 1.6 2.1 0.7 3.5 <0
Rain bread 0.1 0.6 1.3 0.1 2.2 26
Irr durum 0.1 1.8 0.4 0.3 0.7 <0
Rain durum 0.5 0.8 1.2 1.2 2.0 19
Hills (all) 0.8 1.5 6.8 2.5 11.3 38
IARI – – 7.6 – 12.7 –
receives the major share of its operating funds from ICAR. These programs are administratively classified by geographic zone and by production environment within zones. There are five geographic zones: North-west Plains Zone (NWPZ), Northeast Plains Zone (NEPZ), Central Zone (CZ), Peninsular Zone (PZ), and Northern Hills Zone (NHZ). Each geographic zone has up to five research programs targeting dif-ferent environments defined on the basis of: (a) wheat species (bread wheat and durum wheat); (b) irrigation status (irrigated and rainfed) and (c) planting time, (timely planted or late planted as determined by crop-ping pattern and intensity). A total of 20 significant programs are analyzed in this study (Table 1). Other smaller research projects focusing on breeding ob-jectives such as salinity tolerance, but which do not release varieties are not analyzed.
The size of the mandated production environ-ments for each breeding program varies substantially (Table 1). We use the term ‘production environment’ to refer to the target environment of a ‘research
environments which receive about 40% of the wheat research resources.
The adoption of MVs closely follows the moisture status of the environment. Practically all the irrigated area is now sown with MVs so that the remaining area under tall varieties is in rainfed areas. Adoption of MVs in rainfed areas is most advanced in the higher rainfall NHZ and NWPZ. In other zones adoption of semidwarf MVs in rainfed areas is negligible, although improved tall varieties have been widely adopted in much of these areas. Average varietal age (average number of years since release weighted by area sown) can be used as a summary measure of the rate at which varieties are adopted and disadopted (Brennan and Byerlee, 1991). The rate of turnover varies sharply in the zones. New releases are most frequently avail-able and more quickly adopted in the NWPZ. Varietal turnover is slowest in NEPZ and CZ.
Although the rate of technical change varies sub-stantially across environments, the research impact of individual programs has not been previously investi-gated. Such information could be particularly useful in identifying areas for improving the efficiency of wheat-research investments through such measures as scaling back programs from a comprehensive breeding effort to a more limited testing program, or merging programs across either geographic zones for similar environments or merging programs for different environments in the same zone.
The economic analysis proceeds in three sections. First, resources deployed to wheat improvement research in each environment are estimated. Next, data and methods for estimating the research bene-fits for each environment are explained and internal rates of return (IRRs) are calculated for each pro-duction environment using the naive assumption that all technical change benefits are being generated by the ‘home’ mandate research programs. The final section identifies inter-program technology spillovers and presents IRRs when technology spillovers are correctly attributed.
3. Data and economic framework
Returns to investment in wheat breeding research in India are estimated from benefits accruing for the period 1978–1991, selected to represent
the post-Green Revolution period subsequent to widespread MV adoption in irrigated areas. To reflect time needed to develop new varieties, a lag of 10 years between the initiation of research investments and the diffusion of the first varieties generating ben-efit flows is assumed. Wheat breeding expenditures by environment were not available, so expenditures from the period 1968 to 1991 were reconstructed using three data sources: (a) estimated total national agricultural research expenditures from 1968 to 1986 (Pardey et al., 1991); (b) estimated numbers of total agricultural scientists and numbers of total wheat im-provement scientists (Directorate of Wheat Research, 1992; Evenson et al., 1999) and (c) the number of varietal trials by environment.
to be constant through time. The annual increase in production due to Type I technical change generated in each agroecological environment is the yield dif-ference times the base traditional variety (TV) yield times the change in area
Type I1Qt =kIYTVA(¯ MVt −MVo),
where kI is the assumed percent yield increase due to adoption of MVs,A¯ is the average wheat area in 1977–1990, MVt the percent of wheat area planted
with MVs in year t, MVothe area planted with MVs in 1977 and YTVis the average TV yield in 1977.
Type II technical change occurs in areas that had already replaced TVs with first generation MVs and now periodically adopt newer MVs to replace older generation MVs. This varietal turnover produces a steady improvement in average yield and assures the maintenance of yield stability in the face of evolving pest biotypes. We model the effect of Type II technical change using the trend in genetic gains in yield po-tential of successive varietal releases. This trend was statistically estimated using varietal trial data by em-ploying the Godden (1998) varietal vintage model. The trials include candidate varieties for release, as well as the main commercial varieties, and usually a long term check. In irrigated areas, this trend was estimated to be close to 1% per year, falling to 0 in some rainfed areas.
The annual production increase due to Type II tech-nical change for each region and environment is
Type II1Qt =(kIIt −1)YMVA¯MVo(s/d); fors < d =(KtII−1)YMVA¯MVo; fors≥d. The research-induced yield advantage is assumed to grow at a compound rate, i.e.,ktII=(1+g)s, where g is the environment-specific annual yield contribution (given in the Appendix), s=(t–1977) and d the average varietal age. YMV is the average MV yield in 1977, and the s/d term is included to allow Type II impacts to diffuse linearly over the first d years of the benefit period beginning in 1977 before rising to a maximum area equal to the area planted to MVs in 1977.
The combined annual economic surplus generated for each environment is:
ESt =
PtQtKt(1+0.5K)t
(|n| +e) ,
where Kt is the percentage increase in production
attributable to technical change (i.e. the combined supply shift of Type I and II technical change), Pt
is the real wheat price and n and e are demand and supply elasticities, assumed to be −0.35 and 0.40, respectively. Wheat prices vary by type (bread and durum), quality, and location of wheat produced. Farmers in NWPZ receive the lowest prices since it is a surplus area specializing in MVs of bread wheats, while farmers in more marginal areas receive higher prices because they produce durum wheats or wheats of higher quality, and because of the cost of transport to bring wheat into these wheat-deficit areas. To com-pute the IRR for each program, a research lag of 10 years between the initiation of research investments and the initiation of benefit flows is assumed. Benefits were phased in linearly beginning in the 11th year. The speed at which benefits accrued due to varietal adoption was based on the observed weighted average varietal age which ranges from 4 years in NWPZ to 23 years in some environments in the CZ and PZ.
4. Rates of return by program, ignoring spillins
The estimated overall IRR for wheat improvement research in India is 55%. This is high but consistent with other recent studies in India and South Asia (Evenson and McKinsey, 1991; Byerlee and Traxler, 1995). When spillovers are ignored, the estimated IRRs for the individual research programs range from negative to 74% (Table 1). Thirteen of the 19 pro-grams generated an IRR of 19% or above. Only the environments which have had no adoption of MVs, and therefore, no technical change, experienced nega-tive rates of return. Varietal turnover through adoption of successive generations of MVs (Type II technical change) was the dominant source of research benefits for the period, accounting for about 90% of all the benefits of wheat breeding research in India. This represents a major shift from the previous period characterized by the advent of the Green Revolution and Type I adoption of MVs.
to research conducted in that environment. However, without examining spillovers it is impossible to tell which programs are generating output that is a close or even perfect substitute for another program’s out-put. The next section measures technology spillins as a means of more accurately gauging the contribu-tion of each research program to farm level technical change.
5. Rates of return incorporating spillovers
A given production environment enjoys the poten-tial to absorb spillins from adjacent and non-adjacent research programs. A weighting function, Ka= P
wiKi, can be used to analyze spillover effects
(Griliches, 1992). The weighting function implies that the aggregate supply shift, K, experienced in en-vironment a is a composite of technology contributed by research conducted by programs in all the envi-ronments. Both indirect and direct approaches have been employed to identify the spillover fractions, wi .
(Evenson, 1991). In the following two sections we demonstrate each approach. In the next section the indirect approach is used to estimate the spillover po-tential based on results from uniform national varietal trials. This analysis reveals some information with regard to research proximity and environmental simi-larity, but does not provide direct evidence of actual spillovers which could be used to calculate program IRRs which account for technology spillins. A later section calculates IRRs based on direct measures of realized spillovers using data on varietal origin and diffusion.
5.1. Indirect assessment of spillovers
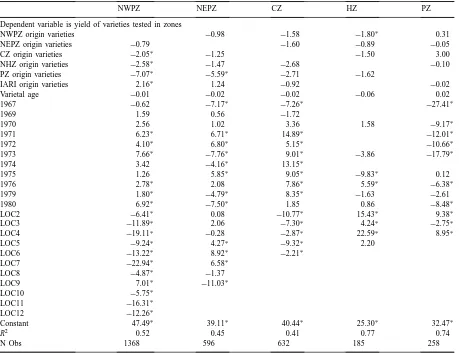
A set of linear regression equations was used to assess the potential for technology spillovers among zones for one production environment, following the procedure of Maredia et al. (1996). Varieties devel-oped by the timely irrigated bread wheat programs in each of the five geographic zones, as well as varieties developed by the national program at IARI, were evaluated in national trials from 1967 to 1981. Trials were grown anywhere from 4 to 12 sites in each zone. Separate regressions were estimated for each zone; the dependent variable in each case was yield in
100 kg/ha. Four types of independent variables were included: (1) origin dummy variables representing the zone in which the variety was developed; (2) a continuous variable representing the first year that the variety appeared in the testing program to proxy for the ‘vintage’ of the technology; (3) dummy variables for the year of the trial to incorporate weather effects and (4) dummy variables for the site of the trial to account for location effects.
The coefficients of the origin variables can be in-terpreted as the yield disadvantage (or advantage) of varieties originating in other zones. That is, the first six rows of Table 2 are a potential spillover matrix measured in absolute yield differences (Davis et al., 1987).
Only one origin coefficient is significantly positive in any of the equations. IARI varieties perform well in the NWPZ, with a statistically significant yield ad-vantage of more than 200 kg/ha. This is not surpris-ing since IARI’s main research station in New Delhi is located in the NWPZ. IARI varieties also have the highest yields in the NEPZ, but are not statistically different from NEPZ-origin varieties. The spillin po-tential appears to be limited in the CZ and NHZ, with all origin coefficients having negative signs. CZ vari-eties appear to have potential for substituting for PZ varieties, although the coefficient is not statistically significant.
5.2. Direct measures of technology spillovers
Table 2
Regression analysis of technology spillins among irrigated timely environments
NWPZ NEPZ CZ HZ PZ
Dependent variable is yield of varieties tested in zones
NWPZ origin varieties −0.98 −1.58 −1.80∗ 0.31
NEPZ origin varieties −0.79 −1.60 −0.89 −0.05
CZ origin varieties −2.05∗ −1.25 −1.50 3.00
NHZ origin varieties −2.58∗ −1.47 −2.68 −0.10
PZ origin varieties −7.07∗ −5.59∗ −2.71 −1.62
IARI origin varieties 2.16∗ 1.24 −0.92 −0.02
Varietal age −0.01 −0.02 −0.02 −0.06 0.02
1967 −0.62 −7.17∗ −7.26∗ −27.41∗
1969 1.59 0.56 −1.72
1970 2.56 1.02 3.36 1.58 −9.17∗
1971 6.23∗ 6.71∗ 14.89∗ −12.01∗
1972 4.10∗ 6.80∗ 5.15∗ −10.66∗
1973 7.66∗ −7.76∗ 9.01∗ −3.86 −17.79∗
1974 3.42 −4.16∗ 13.15∗
1975 1.26 5.85∗ 9.05∗ −9.83∗ 0.12
1976 2.78∗ 2.08 7.86∗ 5.59∗ −6.38∗
1979 1.80∗ −4.79∗ 8.35∗ −1.63 −2.61
1980 6.92∗ −7.50∗ 1.85 0.86 −8.48∗
LOC2 −6.41∗ 0.08 −10.77∗ 15.43∗ 9.38∗
LOC3 −11.89∗ 2.06 −7.30∗ 4.24∗ −2.75∗
LOC4 −19.11∗ −0.28 −2.87∗ 22.59∗ 8.95∗
LOC5 −9.24∗ 4.27∗ −9.32∗ 2.20
LOC6 −13.22∗ 8.92∗ −2.21∗
LOC7 −22.94∗ 6.58∗
LOC8 −4.87∗ −1.37
LOC9 7.01∗ −11.03∗
LOC10 −5.75∗
LOC11 −16.31∗
LOC12 −12.26∗
Constant 47.49∗ 39.11∗ 40.44∗ 25.30∗ 32.47∗
R2 0.52 0.45 0.41 0.77 0.74
N Obs 1368 596 632 185 258
∗Coefficient differs from zero at 10% significance level, standard errors computed using White’s heteroscedasticity consistent covariance
matrix estimator.
must be also be examined to link changes in farm productivity with research effort. These data must be examined keeping in mind that superior varieties can travel long distances from their institute of release to their zones of diffusion (Maredia et al., 1996; Byerlee and Traxler, 1995).
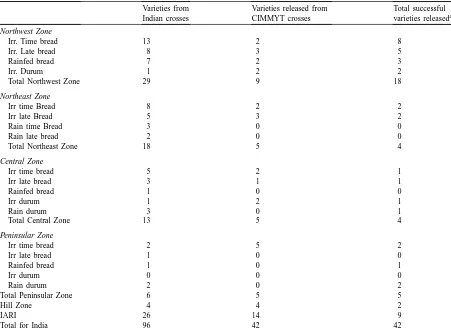
A total of 138 wheat varieties were released in India between 1976 and 1993, including 42 varieties obtained from the International Maize and Wheat Improvement Center (CIMMYT), based in Mexico (Table 3). CIMMYT itself does not release wheat varieties. It makes varieties available to national
Table 3
Varieties released and successful varieties by environment, 1976–1993 Varieties from
Indian crosses
Varieties released from CIMMYT crosses
Total successful varieties releaseda
Northwest Zone
Irr. Time bread 13 2 8
Irr. Late bread 8 3 5
Rainfed bread 7 2 3
Irr. Durum 1 2 2
Total Northwest Zone 29 9 18
Northeast Zone
Irr time Bread 8 2 2
Irr late Bread 5 3 2
Rain time Bread 3 0 0
Rain late bread 2 0 0
Total Northeast Zone 18 5 4
Central Zone
Irr time bread 5 2 1
Irr late bread 3 1 1
Rainfed bread 1 0 0
Irr durum 1 2 1
Rain durum 3 0 1
Total Central Zone 13 5 4
Peninsular Zone
Irr time bread 2 5 2
Irr late bread 1 0 0
Rainfed bread 1 0 1
Irr durum 0 0 0
Rain durum 2 0 2
Total Peninsular Zone 6 5 5
Hill Zone 4 4 2
IARI 26 14 9
Total for India 96 42 42
aRelease which was planted to at least 25,000 ha during any 1 year Source: Jain (1994).
experienced technical change despite a lack of research output from their corresponding research institutions. Diffusion information was used to trace the sources of these spillins.
Information on area planted to individual varieties is only available for the 1990–1991 season (Table 4). The table shows the percent of wheat area sown with varieties from each zone by environment. For example the first line of the table indicates that 25% of the irri-gated timely-sown wheat area in NWPZ was planted with varieties developed in that zone, while 4% of the area in that environment was sown with varieties developed by CZ, 53% to IARI varieties, 3% to CIM-MYT varieties, 15% to varieties released prior to 1976 (prior to the period of analysis in this study).
Approxi-mately 10% of total area was sown with unidentified varieties. Table totals are percent of identified area.
Table 4
Realized technology spillins, percent of area sown to cultivars by zone of origination, 1990–1991 Zone where cultivar sown Zone where cultivar developed
NWPZ NEPZ CZ PZ HZ IARI CIMMYT Pre-1976
Northwest Zone
Irr time bread 25 – 4 – – 53 3 15
Irr late bread 10 – – – – 85 – 5
Rainfed bread 20 – – – – – 33 47
Durum 26 – – – – – 74 –
Total: Northwest 21 0 3 0 0 59 5 12
Northeast Zone
Irr time bread 41 – – – – – 59 –
Irr late bread –7 – – – 7 – 86
Rainfed time bread – – – – – – – 100
Rainfed late bread – – – – – – – 100
Total: Northeast 13 4 0 0 0 4 19 62
Central Zone
Irr time bread 65 – 20 – – 3 – 12
Irr late bread – – 77 – – – – 23
Rainfed bread – – – – – 14 – 86
Irr Durum – – – – – – – 100
Rainfed durum 16 – 52 – – – – 26
Total: Central 16 0 26 0 0 8 0 50
Peninsular Zone
Irr time bread – – – – – 82 2 16
Irr late bread – – – – – – – 100
Rainfed bread – – – 40 – – – 60
Irr durum – – – – – – – 100
Rainfed durum – – – 8 – 4 – 88
Total: Peninsular 0 0 0 6 0 34 1 59
Hill Zones — All – – – – 6 12 18 64
Total: India 16 1 7 0.3 0.2 30 9 37
to pre-1976 varieties, indicating that much of the area in these environments is not being reached by any of the research programs.
6. Rates of return by program, accounting for spillins
The variety diffusion data were used to recalculate IRRs for each program so that technology diffusion was directly linked to research program investments.4 Benefits in each production environment were
appor-4Since no estimate of costs was available, and because the focus of the study is on the Indian system, an IRR was not calculated for CIMMYT research.
tioned based on spillover shares. The spillover share wij is the share of technology from program i used in
environment j, calculated as: wij=Aij/PAj, where
Aij is the area in environment j sown with varieties
released by program i, and PAj is the total area
sown with post-1976 varieties in environment j. The use of Table 4, based on varietal diffusion in 1990, to construct weights implicitly assumes that spillovers are constant throughout the period. Data on success-ful varietal release over time provides support for the idea that release and adoption patterns have been relatively stable.
Table 5
Estimated internal rate of return (IRR) accounting for technology spillins by environment for wheat breeding research in India IRR with
spillins (%)
Changein IRR (%)
Nat. benefits (%)
Northwest
Irr time bread 61 −9 31
Irr late bread 32 −28 1
Rainfed bread 37 −15 0.3
Irrigated durum 76 +2 0.6
Northeast
Irr time bread <0 −49 0.0
Irr late bread 34 −9 0.8
Rainfed timebread <0 – 0.0
Rainfed late bread <0 – 0.0
Central
Irr time bread 43 −8 5.8
Irr late bread 51 0 3.6
Rain bread <0 −49 0.0
Irr durum <0 – 0.0
Rainfed durum 49 −5 0.5
Peninsula
Irr time bread <0 −19 0.0
Irr late bread <0 – 0.0
Rainfed bread 26 −0 0.1
Irr durum <0 – 0.0
Rainfed durum 14 −5 0.0
Hills (all) 17 −21 0.4
IARI 66 – 45.2
CIMMYT – – 10.7
closely tied to identifiable research output, eight pro-grams now have negative IRRs. As would be expected given the heavy concentration of research output noted above, two programs, NWPZ irrigated timely bread wheat and IARI, generate more than 75% of all benefits from an expenditure of 22% of the resources. Nearly all programs in the NEPZ and PZ appear to be free-riding on technologies generated elsewhere. Programs in only two zones, NWPZ and CZ, have been financially efficient at generating technologies for their mandate environments.
Spillovers are clearly a dominant force in varietal technical change in India, accounting for approxi-mately 70% of all surplus produced. The national programs of IARI are responsible for 70% of the spillover benefits, and CIMMYT another 11%. The return on research investment would be much higher if money were redirected from unproductive research programs.
7. Conclusions
In this study, we used a disaggregated approach to examine investment efficiency of wheat breeding research in India, the world’s second largest wheat producing country. The evidence we assembled on re-search output and technology spillovers included three related sets of data; variety release data, variety yield trial data and variety diffusion data. The variety release data is an indicator of research output over a 20-year period. The trial data is an indicator of spillover poten-tial. The diffusion data directly measures technology spillovers at one point in time, late in the period.
benefits. The 16 least productive programs combined to produce just 3.7% of national benefits while con-suming 69% of research resources. Eight programs were found to have earned a negative rate of return when spillins were taken into account. Clearly there is considerable scope for increasing the overall return on research investment by redirecting money from unproductive research programs.
One of the difficult puzzles is that the successful programs exhibit a very heavy degree of overlap — 80% of all the benefits produced by IARI research which occurred in the irrigated NWPZ. So, to a large extent the two strongest programs were serving the same set of clients. On the other hand, many farmers in the marginal rainfed and durum wheat areas were not reached by new technologies from any programs — 56 and 78% of rainfed and durum, respectively area in 1990 was still sown with pre-1976 varieties. The difficulty in serving marginal environments has plagued many crop breeding programs (Byerlee and Morris, 1993).
Although spillovers and free-riding were dominant characteristics of technical change during the period studied, it is important to continue to monitor technol-ogy generation by program in order to establish the degree of stability of spillin patterns over time. How common is it for a program to switch from ‘technology borrower’ to ‘technology generator’ status over time? If the pattern is stable, the elimination or redesign of free-riding programs represents a means of increasing the overall rate of return on research investments, at modest risk of reducing technology availability to any of the nation’s farmers.
The analysis presented in this paper has two broader implications for conducting studies of rates of return to investment in agricultural research. First, high ag-gregate rates of return can hide considerable hetero-geneity in the performance of research programs that comprise the overall effort. In this case, a high aggre-gate rate of return to wheat improvement research in India was due to the performance of just two research programs, which absorbed less than one quarter of the resources invested. Second, rates of return are quite sensitive to whether spillovers from other programs are explicitly incorporated. In this study calculations performed under the naive assumption that all tech-nical change was induced by local institutions drew a distorted picture of research productivity patterns.
Most studies in the past have ignored such spillovers and have thus biased rates of return to research. Together these results imply that many previous eval-uations of investment in agricultural research have underestimated the extent of inefficiencies in in-vestment in agricultural research at the sub-national level.
References
Alston, J., Pardey, P., 1996. Making Science Pay, AEI Press, Washington DC, 375 pp.
Alston, J., Norton, G., Pardey, P., 1995. Science Under Scarcity, Ithaca, Cornell University Press, 585 pp.
Brennan, J.P., Byerlee, D., 1991. The rate of crop varietal replace-ment on farms: measures and empirical results for wheat. Crop Varieties Seeds 4, 99–106.
Byerlee, D., Morris, M., 1993. Research for marginal environ-ments: are we underinvested. Food Policy 18 (3), 381–393. Brennan, J.P., Fox, P.N., 1995. Impact of CIMMYT Wheats
in Australia: Evidence of International Research Spillovers, Economics Research Report No. 1–95, NSW Agriculture, Wagga Wagga, NSW.
Byerlee, D., Traxler, G., 1995. National and international research in the post-green revolution period: evolution and impacts. Am. J. Agric. Econ. 77, 268–278.
Directorate of Wheat Research, 1992. Project Director’s Report, 1991–1992. Report presented to the 31st All India Wheat Research Workers Workshop, 26–28 August 1992.
Davis, J.S., Oram, P.A., Ryan, J.G., 1987. Assessment of agri-cultural research priorities: an international perspective. ACIAR and IFPRI, Canberra.
Evenson. R.E., 1991. Analyzing the transfer of agricultural technology. In: Anderson, J.R. (Ed.), Agricultural Technology: Policy Issues for the International Community. University of Arizona Press, Tucson.
Evenson, R.E., McKinsey, J.W., 1991. Research, extension, infrastructure, and productivity change in Indian agriculture. In: Evenson, R.E., Pray, C.E. (Eds.), Research and Productivity in Asian Agriculture. Cornell University Press, Ithaca.
Evenson, R.E., Rosegrant, M.W., 1993. Determinants of produc-tivity growth in asian agriculture: past and future. In: Paper presented to the AAEA Pre-conference Workshop on Post-Green Revolution Agricultural Development Strategies: What Next? Orlando, FL, 30–31 July 1993.
Evenson, R.E., Pray, C., Rosegrant, M.W., 1999. Agricultural Research and Productivity Growth in India. IFPRI Research Report 109. International Food Policy Research Institute, Washington DC, 88 pp.
Godden, D., 1998. Comparison of two techniques for estimating the effects of new cereal varieties on crop yields. Plant Varieties and Seeds. 1, 37–52.
Hertford, R., Schmitz, A., 1977. Measuring economic returns to agricultural research. In: Arndt, T.M., Dalrymple, D.G., Ruttan., V.W. (Eds.), Resource Allocation and Productivity in National and International Agricultural Research. University of Minnesota Press, Minneapolis.
Jaffe, A.B., 1986. Technological opportunity and spillovers of R&D: evidence from firms patents, profits, and market value. Am. Econ. Rev. 76, 984–1001.
Jain, K.B.L., 1994. Wheat cultivars in India: names, pedigrees, origins, and adaptations. Research Bulletin No. 2, Directorate of Wheat Research, Karnal, India.
Jain and Byerlee, 1999. Investment efficiency at the national level: wheat improvement in India, In: Maredia, M.K., Byerlee, D. (Eds.), The Global Wheat Improvement System: Prospects for Enhancing Efficiency in the Presence of Spillovers, Research Report No. 5. CIMMYT, Mexico, DF.
Kahlon A.S., Saxena, P.N., Bal, H.K., Jha, D., 1977. Returns to investment in agricultural research in India. In: Arndt, T.M., Dalrymple, D.G., Ruttan, V.W. (Eds.), Resource Allocation and Productivity in National and International Research. Minneapolis, University of Minnesota Press.
Maredia, M.K., Ward, R., Byerlee, D., 1996. Econometric estimation of a global spillover matrix for wheat varietal technology. Agric. Econ. 14, 159–173.
Morris, M., Dubin, J., Pokhrel, T., 1994. Returns to wheat research in Nepal. Agric. Econ. 10, 269–282.
Mruthyunjaya, P., Ranjitha, Selvaraja, S., 1994. Congruency Analysis of Resource Allocation in Indian Agricultural Research System. Division of Agricultural Economics, IARI, New Delhi. Pardey, P.G., Wood, S., 1994. Targeting research by agricultural environments. In: Anderson, J.R. (Ed.), Agricultural Techno-logy: Policy Issues for the International Community. CAB International, Wallingford.
Pardey, P.G., Roseboom, J., Anderson, J.R. (Eds.), 1991. Agricul-tural Research Policy: International Quantitative Perspectives. Cambridge University Press, Cambridge.
Paroda, R.S., 1992. All India coordinated crop improvement projects: organization and management. In: Proceedings of the Group Discussion on Management of Change — All India Coordinated Crop Improvement Project, ICAR, New Delhi. Schimmelpfennig, D.S., Thirtle, C., 1997. Research spillovers
between the European community and the United States. Paper Presented at the Annual Meeting of the Western Agricultural Economics Association Annual Meeting. Seattle, July 1997.