THE EFFECT OF LOSSY IMAGE COMPRESSION ON OBJECT BASED IMAGE
CLASSIFICATION - WORLDVIEW-2 CASE STUDY
A. Marsetic a, *, Z. Kokalj a, K. Ostir a, b
a SPACE-SI, Askerceva 12, 1000 Ljubljana, Slovenia - (ales.marsetic, ziga.kokalj)@space.si b
Institute of Anthropological and Spatial Studies, Scientific Research Centre of the Slovenian Academy of Sciences and Arts, Novi trg 2, 1000 Ljubljana, Slovenia - kristof@zrc-sazu.si
Commission IV, WG IV/2
KEY WORDS: Image Lossy Compression, Object Classification, JPEG 2000, WorldView-2, k-Nearest Neighbor, Support Vector Machine
ABSTRACT:
Lossy compression is becoming increasingly used in remote sensing although its effect on the processing results has yet not been fully investigated. This paper presents the effects of JPEG 2000 lossy compression on the classification of very high-resolution WorlView-2 imagery. The k-nearest neighbor and support vector machine methods of the object based classification were used and compared. The results explore the impact of compression on the images, segmentation and resulting classification. The study proves that in general lossy compression does not adversely affect the classification of images; what is more, in some cases classification of compressed images gives better results than classification of the original image. Classification accuracy of support vector machines method indicates that compression ratios of up to 30:1 can be used without any loss of accuracy. The best result of the k-nearest neighbor method was obtained with the highest compression ratio (100:1), but the outcome cannot be trusted without reserve. In the study we found that the support vector machine method gives better classification results than the k-nearest neighbor and is also recommended for further research. In addition to the classification method, image segmentation, a basic step of object classification, plays an important role in the accuracy of the results.
* Corresponding author.
1. INTRODUCTION
Images with high spatial, spectral and temporal resolution are needed to achieve optimal results in various remote sensing applications – e.g. land cover mapping and analysis, disaster management, climate modelling and agricultural and forest management. With the introduction of satellites like WorldView-2, such images are already commercially available. With images offering such detail, but also with coarser spatial resolution, freely available imagery of high temporal frequency (e.g. that of the MODIS sensors), the amount of data can quickly become difficult to handle, especially in terms of storage, management and processing. In such a case the use of effective compression techniques is a necessity. There are many areas where the use of lossless and especially lossy compression is already a common practice. For example, one of the main sources of lossy compressed images are the geoportals that are required to perform a fast delivery of large images to multiple users simultaneously through the internet. Geoportals are usually based on OGC (Open Geospatial Consortium) standards in the form of WMS (Web Map Service) and WCS (Web Coverage Service).
Although lossy data compression techniques are being increasingly used, they have not yet achieved global acceptance in the remote sensing community. They are thought to negatively affect the quality of images and finally the processing results, such as image classification (Garcia-Vilchez et al., 2011). There are few studies that address the impact of lossy compression on image classification. They mostly deal with low resolution data or very small images, non-standard compression
algorithms, and analyse pixel-based classifications only. The results from these studies are frequently conflicting – some encourage lossy compression, others advise against its use.
When classifying urban areas from a combination of aerial photographs and lidar data compressed with wavelet compression, Kiema (2000) found that compression ratios of up to 20:1 can be used without deteriorating the results of classification. Lam et al. (2000) achieved acceptable classification with JPEG compression of SPOT multispectral imagery with compression ratios of up to 20:1. Liang et al. (2008) investigated effects of supervised classification of aerial photographs, which have been previously compressed with JPEG 2000 and SPIHT techniques. The results have been satisfactory up to 10:1 compression ratio; the JPEG 2000 compression gave better accuracy. Zabala and Pons (2011) came up with interesting conclusions when compressing Landsat ETM+ and TM images with JPEG and JPEG 2000 techniques. They showed that homogeneous areas can be compressed to a ratio of 20:1, while the fragmented areas only to 5:1. Better results were obtained with the classification of compressed than original images. Compression is very important for hyperspectral images, where the volume of data is very large. Garcia-Vilchez et al. (2011) tested pixel-based classification on AVIRIS images, previously compressed with various techniques. Good results were obtained also with high compression ratios. To similar conclusions came also Mercier et al. (1999) using vector quantisation. In this case good classification was achieved with a compression ratio of 70:1. However, Goodenough et al. (2004) do not recommend
compression of hyperspectral satellite data (e.g. of Hyperion, AVIRIS) in the determination of forest areas
This paper addresses the implications of lossy compression for image classification of very high resolution WorldView-2 satellite imagery. In order to ensure representative results we used object oriented classification and JPEG 2000 compression standard, which provides better quality than older techniques (e.g. JPEG) and is also increasingly used in remote sensing.
2. LOSSY COMPRESSION TECHNIQUES
There are two basic image compression types. The first is lossless data compression, generally considered as data compaction, which eliminates the unnecessary redundancy but does so without any loss of information. On the other hand, lossy data compression removes some low-detail information. Because the best compression ratios achieved by lossless techniques are in the order of 3:1 (Serra-Sagristà and Aulí-Llinàs, 2008), lossy compression is used when higher ratios are required.
2.1 JPEG 2000
JPEG 2000 is an image compression standard and coding system. It was created in 2000 and is based on wavelet and sub-band technologies. Its core is described as in International Standard (ISO/IEC 15444-1). It is superior in compression quality to the preceding JPEG standard and is additionally very suitable for use in remote sensing because:
- it offers both lossless and lossy compression,
- spatial information can be reached with random access, so there is no need to tile large images,
- regions of interest can be defined, encoded, and transmitted with better quality than the rest of the image, and
- image cropping is lossless (no error build up).
3. DATA
3.1 WorldView-2
WorldView-2 is the first very high-resolution commercial satellite with more than four “standard” multispectral bands; the three in visible light and one in near infrared have been supplemented with a second near infrared band, a red edge band, a yellow band and band that captures light with a wavelength a little shorter than the blue band (coastal band). The sensors capture data in 11 bits, multispectral with a 1.84 m and the panchromatic with a 0.46 m spatial resolution at nadir. The imagery resampled to 2 m and 0.5 m respectively due to legal restrictions. The swath width is 16.4 km. The satellite was launched into a Sun synchronous orbit 770 km above the Earth in October 2009. Its revisit frequency is almost every day with a 45° viewing angle and less than four days with a 20° viewing angle.
The images used in this study were acquired by the WorldView-2 satellite on August 1st 2010. They cover a 17 km x 16 km area
of western Ljubljana (Slovenia) and its surroundings. They contained only basic radiometric and sensor corrections, which means that they were not projected to a plane using a map projection. Furthermore, the size of the pixels on the surface (GSD) varied over the entire image because of the camera viewing geometry and platform motion. Metadata with information on the satellite orbit, camera properties and RPC coefficients to facilitate the rectification were supplied by the image provider.
3.2 Data Preparation
It was necessary to adequately prepare the images before compression and classification. The panchromatic and multispectral images were first orthorectified in the ENVI program using RPC coefficients. To maintain the high spatial resolution of the panchromatic images and the high spectral resolution of multispectral images, they were combined into a pansharpened image using the Gram-Schmidt method (Laben and Brower, 2000). Pansharpening was done on an area of 1448 x 968 pixels which was sufficient to carry out the research. The small image enabled faster processing and facilitated manual classification of the area which was later used to verify the accuracy of the automatic object-based classification. The chosen region includes agricultural land, forests and urban areas.
4. METHODS
The research of the impact of lossy compression on the classification was divided in several steps. First, it was necessary to compress the eight bands image with the JPEG 2000 technique. This was followed by decompression and then classification because the software used does not work with compressed imagery.
4.1 Compression and Decompression
Due to the large number of bands and the possibility to control the compression ratio (CR), the compression was done in the ERDAS Imagine software. The program allows the selection of the compression ratio, which was chosen to measure the size reduction of data. CR is calculated as the ratio between the size of the original file and the size of compressed files. For example CR 2:1 indicates that the compressed file has half the size of the original.
Because the paper addresses the impacts of various CRs on classification, the image was compressed with six different lossy compression ratios (2:1, 5:1, 15:1, 30:1, 50:1and 100:1). For small CRs the differences with the original images are small, but higher ratios produce quite distorted images. Figure 1 shows a comparison between a sample from the original image and the compressed image with a 100:1 compression ratio.
4.2 Classification
In most cases a classified image is the final product in the processing chain of remote sensing data. We can even say that the classified image is the most important product of remote sensing and that classification was also one of the major reasons for the development and enhancement of image sensors for Earth observation. This also led to development of many classification methods. These can be divided according to the classification unit; a pixel classification, and an object based
classification. The first treats each pixel as a single unit that consists of values from multiple spectral bands. With the operations of classification and image analysis the pixels are sorted and allocated into various classes. While in the traditional pixel classification each pixel is sorted according to certain statistical characteristics, the object oriented classification first combines the pixels in segments (objects) with the segmentation procedure and then assigns each segment to a particular class (Kanjir, 2009).
Figure 1. An excerpt from the original image (top) and the compressed image at 100:1 ratio (bottom).
Investigations of the effects of image compression on the classification quality have so far mostly studied pixel classification, because it has a longer history than the object based approach. In recent years, owing to the introduction of very high resolution imagery, the trend shifted to object based classification which achieves better results with this kind of imagery (Blaschke, 2010). For this reason object based classification was used to classify the half-meter resolution WorldView-2 images. ENVI Zoom’s Feature Extraction module was chosen for processing (ENVI User's Guide, 2008). The procedure first performs segmentation that divides the image into segments by combining adjacent pixels with similar values
(brightness, texture, color, etc.). The resulting segments are simplified presentations of real objects in an image.
After completing the image segmentation the classification was conducted on the basis of previously calculated attributes (spectral, spatial, texture) of all eight bands. The information classes were chosen before automatic classification. Given the visual object recognition and to facilitate the validation of the results, five different classes were selected:
- forest (combines forest surfaces, groups of trees and large individual trees),
- buildings (mostly residential houses and related facilities),
- grassland and crops (fields of green crops, grassland and pastures)
- bare soil (agricultural land without crops, barren land), and
- roads (roads and other concrete and asphalt surfaces).
After the selection of classes the process continued with supervised classification using the training data. The operator chooses a few training segments for each predetermined information class. In our case, the samples were chosen based on aerial orthophoto and WorldView-2 images. Two classification algorithms were tested: k-Nearest Neighbor (kNN) and Support Vector Machine (SVM).
The classified images retained some noise in the form of small isolated segments of suspect classification and jagged areas with inhomogeneous forms. Most of these segments were filtered out with a majority filter. After the filtering the classification was completed. A sample of the classification results are presented in Figure 2.
Figure 2. Sample of the original image classification results
4.3 Validation
The resulting classifications were evaluated using the confusion matrix which is one of the most widely used classification
accuracy indicators. Using the matrix the relationship between the reference "real" data and the classification results is established. The matrix is square with the number of columns and rows equaling the number of classes for which classification accuracy is determined. The columns in the matrix represent the reference data; the rows contain the classified data. The values in the diagonal cells give the number of correctly classified pixels, the number in the other fields are errors (Janža, 2005). In our case the reference data was prepared manually with visual interpretation of WorldView-2 imagery. In this way the errors that can arise from non-updated data were avoided. However, also the manually classified vector map was not perfect since without field verification it is difficult to determine all kinds of small objects, especially in urban areas.
5. RESULTS
The effects of the compression ratios on the accuracy of classification were determined using the confusion matrix. In addition to the classification accuracy, the impact of the compression ratio on the geometry of segments, and the difference between images before and after compression were also examined.
5.1 Compressed Images
Figure 3 shows the percentage of unchanged pixels in images of different compression ratios for all bands. A rapid decrease of unchanged values is noticed. There are only about 30% of unchanged pixels with 2:1 compression ratio and the number is below 10% already at a ratio of 15:1.
The ranges of change and maximum deviations for all the images were also examined. The average difference of digital value expectedly increases almost linearly and reaches a value of 11.64 at the maximum compression. The maximum difference behaves similarly, with the biggest value at 198. The 11-bit radiometric resolution must be considered in the interpretation.
Figure 3. Percentage of unchanged pixels
Deterioration of the quality when increasing compression ratio can be clearly seen on the compressed images. The
simplification of textures which is most visible on grassland and agricultural areas can also be noted.
5.2 Segmentation
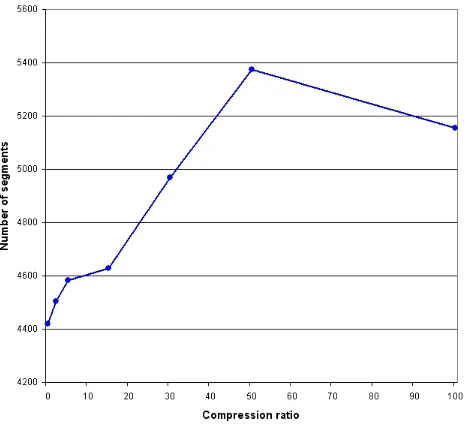
Segmentation is the first step of object-oriented classification. The objects (segments), that later enter into the process of classification, are created based on pixel characteristics and similarity. This step is very important and has a great impact on the final results. The effects of compression on the geometry of the segmentation were examined only visually, nevertheless the number of acquired segments was quantitatively assessed and is shown in Figure 4.
Figure 4. Number of segments
Because of the smoothing effect, with the increasing of the compression ratio the decreasing of the number of objects was expected, but the result was just the opposite. After visual inspection, it turned out that the increase in the number of segments was due to oversegmentation in forested areas where a number of tiny segments appeared. Otherwise it was noticed that at high compression ratios there are less isolated segments and more combined segments, which actually constitute entire “real” objects (e.g. a whole roof, a longer stretch of a road). When comparing results from different ratios it can also be clearly seen that with the increase of the CR, the changes in segment boundaries are getting bigger. From the results we can conclude that compression has a big impact on segmentation.
5.3 Overall Accuracy and Kappa Coefficient
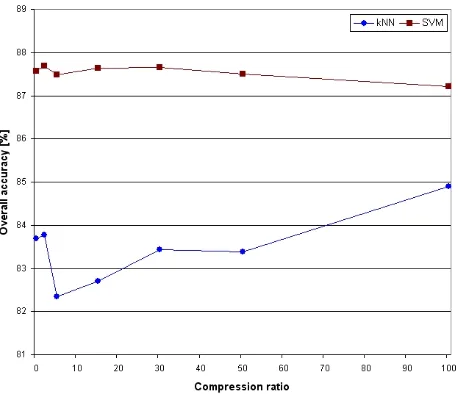
Table 1 shows the overall classification accuracy of the original and compressed images for the k-Nearest Neighbor and Support Vector Machine techniques. The SVM gave about 4% better results that the kNN. Images classified with the k-Nearest Neighbor method behave surprisingly because the best result is obtained with the highest compression (100:1) while the results with medium compression (5:1, 15:1) produce the worst results.
When using the SVM method the results are closer to expected. In this case the best results are obtained at 2:1 compression, but also the classifications at 15:1 and 30:1 compression offer a better solution than the one with the original image. It can be concluded that the compression ratio of up to 30:1 can be used
with SVM classifier without any loss of accuracy, although the results from higher compression ratios are also very good. The overall classification accuracy is shown in Figure 5.
Overall Accuracy (%) kNN SVM
Table 1. Overall classification accuracy of the original and compressed images for the kNN and SVM techniques. The difference between the value obtained at each CR and the value
obtained from the original image is shown in parentheses
The kappa coefficient is another criterion for assessing the classification accuracy. It was introduced because even a purely random classification reaches a certain level of precision in the confusion matrix. With the kappa coefficient the difference between the studied and a random classification is measured. It is defined in the range between 0 and 1, where 0 means that the used classification did not achieve better results than a random one would. Contrary, a value of 1 means that the classification contains no errors. For example, the value 0.5 means that the classification is 50% better than the random (Janža, 2005).
Figure 5. Overall classification accuracy
Table 2 shows the kappa coefficients for all images. The results reflect those in the overall accuracy test. The only difference is that of the SVM method, where the largest coefficient (the best classification) is achieved with 2:1 compression ratio. The kappa coefficient also shows the superiority of SVM method in comparison with kNN.
In addition to quantitative validation it is possible to draw some qualitative conclusions with visual interpretation. The classifications of the original and compressed images do not differ significantly; however, noticeable changes are visible and often depend on the type of segmentation and the form of segments. Furthermore, we have to take into account also the reference classification which is used for the calculation of the confusion matrix. The reference classification image is operator dependent and in some cases even less accurate than the automatic classification (e.g. in some cases the facades of the houses of a few pixels size are classified under the class "roads", while they were visually classified as "buildings").
Kappa Coefficient kNN SVM
Original 0,7021 0,7640
Table 2. Kappa coefficient of the original and compressed images for the kNN and SVM techniques. The difference between the value obtained at each CR and the value obtained
from the original image is shown in parentheses
6. CONCLUSIONS
The paper addresses the effects of lossy compression on the classification of very high resolution images. The analysis revealed that classification made with lossy compressed images is not negatively affected by compression; in some cases it is even better than the original image classification.
The SVM classification method gives better results than the
Despite the obtained results, it is still difficult to determine the highest usable compression ratio as the classification accuracy depends on many other factors as well (e.g. classification method, segmentation parameters). Additionally, the results of the kNN classification show a strange behavior that cannot be completely trusted since very high compression ratios should have an adverse effect on classification accuracy.
Future studies will need to pay more attention to the segmentation, which is a crucial step in the success of classification. In addition to classification it will be necessary to carefully examine the effects of compression also on other automated processes such as the identification of characteristic points or detection of spatial patterns.
REFERENCES
Blaschke, T., 2010. Object based image analysis for remote sensing. ISPRS Journal of Photogrammetry and Remote Sensing, 65(1), pp. 2-16.
García-Vílchez, F., Muñoz-Marí, J., Zortea, M., Blanes, I., González-Ruiz, V., Camps-Valls, G., Plaza, A., Serra-Sagristà, J., 2011. On the Impact of Lossy Compression on Hyperspectral Image Classification and Unmixing. IEEE Geoscience and Remote Sensing Letters, 8(2), pp. 253-257.
Goodenough, D.G., Dyk, A., Han, T., Jazayeri, A., Li, J., 2004. Impacts of Lossy Compression on Hyperspectral Products for Forestry. In: Proceeding of International Geoscience and Remote Sensing Symposium, IGARSS, Anchorage, Alaska, USA, pp. 465-468.
ITT Visual Information Solutions, 2008. ENVI User's guide, Boulder, Colorado, USA.
Janža, M., 2005. Določitev rabe tal s klasifikacijo satelitske podobe za namene hidrološkega modeliranja na območju zaledja izvira Rižane. Geologija, 48(1), pp. 153–159.
Kanjir, U., 2009. Objektna klasifikacija rabe tal iz podatkov daljinskega zaznavanja. BSc Thesis. Fakulteta za gradbeništvo in geodezijo, Oddelek za geodezijo, Ljubljana.
Kiema, J. B. K., 2000. Effect of wavelet compression on the automatic classification of urban environments using high resolution multispectral imagery and laser scanning data. In: International Archives of Photogrammetry and Remote Sensing, Amsterdam, Netherlands, Vol. XXXIII, Part B3, pp. 488–495.
Lam, K. W., Lau, W., Li, Z., 2000. The effects on image classification using image compression technique. In: International Archives of Photogrammetry and Remote Sensing, Amsterdam, Netherlands, Vol. XXXIII, Part B7, pp. 744–751.
Laben, C. A., Brower, B. V., 2000. Process for enhancing the spatial resolution of multispectral imagery using pan-sharpening. United States Patent 6011875.
Liang, Z., Tang, X., Zhang, G., Wu, X., 2008. Effects of JPEG2000 and SPIHT compression on image classification. In: The International Archives of the Photogrammetry, Remote Sensing and Spatial Information Sciences, Beijing, China, Vol. XXXVII, Part B7, pp. 541–544.
Mercier, G., Mouchot, M.-C., Cazuguel, G., 1999. Joint classification and compression of hyperspectral images. In: Proceeding of International Geoscience and Remote Sensing Symposium, IGARSS, Hamburg, Germany, Vol. 4, pp. 2035– 2037.
Serra-Sagristà, J., Aulí-Llinàs, F., 2008. Remote Sensing Data Compression. In: Graña, M. and Duro, R. J. (eds.), Computational Intelligence for Remote Sensing. Springer-Verlag, Berlin, pp. 27-61.
Zabala, A., Pons, X., 2011. Effects of lossy compression on remote sensing image classification of forest areas. International Journal of Applied Earth Observation and Geoinformation, 13(1), pp. 43-51.