A DATA MANAGEMENT METHOD FOR EFFICIENT SEARCH AND RENDERING
OF MULTIPLE LARGE SCALE POINT CLOUDS
T. Maeno, H. Date, S. Kanai
Graduate School of Information Science and Technology, Hokkaido University, Sapporo 060-0814, Japan
[email protected], (hdate, kanai)@ssi.ist.hokudai.ac.jp
KEY WORDS: Multiple Point Clouds, Octree, LOD, Laser Scanning, Data Management, Data Search, Rendering
ABSTRACT:
Recently, with the progress of laser scanning technology, it has become possible to scan several environments such as buildings, roads, and cities easily and at a low cost. There are typically three scanning methods: TLS (Terrestrial Laser Scanning), MMS (Mobile Mapping System), and ALS (Airborne Laser Scanning), and the environments are scanned for measurement, modelling, and simulation etc. Therefore, an efficient and comprehensive data management method, which can handle these point clouds in various applications is strongly required. In this paper, we describe a method of data management for efficient search and rendering of multiple large scale point clouds. First, we define a general point cloud file format including the octree and the quantization structure. Next, the data management method enabling an efficient search and rendering of the point clouds is proposed. Finally, the effectiveness of our method is verified using several actual data sets.
1. INTRODUCTION
Recently, with the progress of laser scanning technology, it has become possible to acquire point clouds of several environments easily. There are three typical scanning methods: TLS (Terrestrial Laser Scanning), MMS (Mobile Mapping System), and ALS (Airborne Laser Scanning). TLS can acquire point clouds in high density and with accuracy, and it can scan the objects around the scanner. The MMS can scan the road and the objects near the road such as buildings, trees, and utility poles with high density and accuracy. ALS can acquire point clouds of the ground surface and buildings from the above, but the point density is relatively low. Using these measurement systems, multiple point clouds which represent the same objects or region can be obtained, and are applied to various applications effectively.
Using multiple point clouds supports a more effective use of scan data in several applications. For example, automatic object recognition and classification may be achieved more accurately using multiple point clouds obtained by scanning the same area. In addition, by using point clouds scanned in the same location at a different time and date, the changes in land use can be surveyed. Furthermore, by combining the point clouds of ALS and TLS, more accurate modelling of buildings can be achieved (Bohm, 2005). In this way, more accurate processing or modelling can be achieved using multiple point clouds of environments scanned in various measurement systems, and a need for efficient management methods of multiple point clouds has been growing.
The following are three major requirements for the efficient use of multiple large scale point clouds.
1) A unified and simple data format: The point clouds are used in several systems and applications. For smooth use of point clouds, a simple and general data format is necessary. LAS format (LAS, 2007) is one of general-purpose formats of point
clouds, however it has excessive information and the file size is large.
2) Flexible search of point clouds: It is important to efficiently acquire point clouds which are suitable and necessary for an application purpose. It is necessary to be able to search point clouds not only by time-space, but also by other queries such as the type of measurement system, measurement place (indoor or outdoor), and provider etc.
3) Efficient rendering of multiple point clouds: It is important to render multiple large scale point clouds efficiently and in high quality. Though a lot of methods for rendering single point cloud have been proposed (Rusinkiewicz, 2000; Wand, 2007), there is no method for handling multiple point clouds.
In this paper, we propose a data management method for efficient search and rendering of multiple large scale point clouds for several applications. First, we define a general point cloud format for efficient search and rendering. Then we propose an efficient rendering method of multiple large scale point clouds. Finally, the effectiveness of our method is verified using several actual data sets.
2. RELATED WORK
Typically there are two types of storage of point clouds, file storage and database storage. Generally, more rapid data input-output can be achieved using file storage compared with database storage (Shan, 2008). Moreover, file storage is directly compatible with exploitation and viewing applications. However, random access based on geospatial criteria cannot be achieved using file storage. In our proposed data management method, file storage is used because it conforms directly to the applications, and rapid data input-output are required. For the file format of point clouds, LAS format is proposed as the standard format (LAS, 2007). LAS format is intended to International Archives of the Photogrammetry, Remote Sensing and Spatial Information Sciences, Volume XXXVIII-5/W12, 2011
contain ALS point data, and LAS format version 2.0 has extended the format to include general three dimensional point clouds. This format consists of a file header block, a point record metadata block, variable length records, and point data. By describing the point record metadata block, users can construct any conceivable point record structure. However, the application interoperability of LAS format files may be low because of high flexibility, and the data size being large. In this paper, a compact file format for point cloud applications and efficient searching using several queries is proposed.
There are several works handling multiple point clouds. Mandlburger et al. (Mandlburger, 2009) proposed a method of data management from the data acquisition step to the application step, however it only refers to ALS and other measurement systems are not stated. Bohm et al. (Bohm, 2005) generated accurate CAD models of buildings by integrating ALS and TLS point clouds. It is possible to create accurate building models by integrating the ALS data and the TLS data. This building model can be used as a virtual city model with LOD (Level of Detail). Lavarone et al. (Lavarone, 2003) proposed a method of generating a whole 3D model of a building and its surroundings by integrating multiple point clouds. These works dealt with multiple point clouds, however there were no discussions about the data management in detail.
Rusinkiewicz et al. (Rusinkiewicz, 2000) proposed a method for efficient rendering of large scale 3D mesh data using the resolution point rendering technique. For the multi-resolution rendering, the data is converted into a tree structure. A breadth first search performed during rendering, and the appropriate resolution can be applied depending on the viewpoint. Although the method can display large data efficiently, the method cannot handle multiple files. Wand et al. (Wand, 2007) described a new out-of-core multi-resolution data structure for real-time visualization and interactive editing of large scale point clouds. To achieve efficient rendering, multi-resolution data structure is created by converting the point cloud into an octree structure and by creating the quantized point clouds at each inner node of the octree. In this method, there is a difficulty in handling multiple point clouds. We enhance the rendering method (Wand, 2007) in order to handle multiple point clouds efficiently.
3. PROPOSED DATA MANEGEMENT METHOD
3.1 Overview
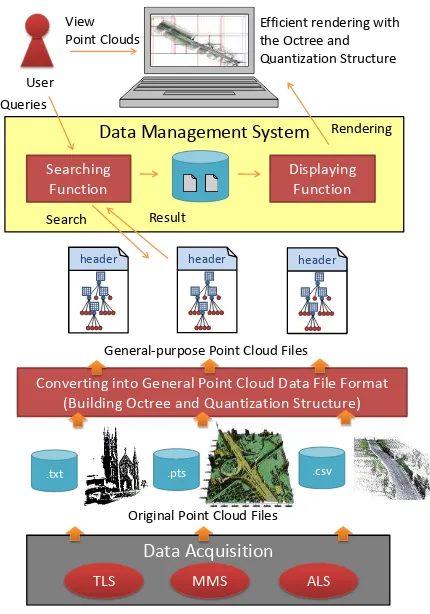
Figure 1 shows an overview of the system proposed in this paper. First, we define a general point cloud format which meets various requirements in the use of point clouds. Second, a search method for point clouds in various search queries is achieved. Third, efficient rendering for multiple large scale point clouds is described.
3.2 General point cloud data format
3.2.1 Requirements for point cloud management and data format: We define a general point cloud data format that
meets the following requirements.
Requirements for point cloud processing
R1) The point cloud has enough information to meet several parts of point cloud processing such as denoising, registration, interpolation, filtering, rendering, and classification.
Requirements for point cloud searching
R2) The point cloud can be searched by various search queries (not only time and space, but also type of measurement system, provider etc.).
R3) The point cloud can be searched efficiently by spatial queries.
Requirements for point cloud rendering
R4) The rendering quality (point density, FPS) can be maintained while displaying multiple point clouds.
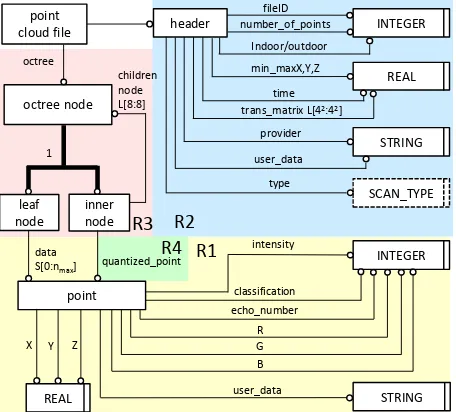
The data structure which meets these requirements is shown in Figure 2. Details are described as follows.
First about R1, there are typical parts of point cloud processing such as denoising, registration, interpolation, filtering, rendering, and classification. Table 1 summarizes the point cloud processing and information which is necessary to perform the processing. In denoising (Deschaud, 2010), XYZ coordinate values and intensity are necessary. Points are moved onto the estimated surface based on the relation of neighbouring points or approximated surface. Obvious outliers and the points whose intensity is extremely low may be removed. The registration can be generally done using the XYZ coordinate values (Xin, 2010) and intensity (Bohm, 2007). The coordinate transformation matrix which minimizes the registration error is calculated. For the lack of points
Data Management System
.txt .pts .csv
Converting into General Point Cloud Data File Format (Building Octree and Quantization Structure)
Displaying Function
Result
Original Point Cloud Files General-purpose Point Cloud Files
Searching Function
Search
Efficient rendering with the Octree and Quantization Structure
header header header User
Queries
Data Acquisition
Rendering View
Point Clouds
MMS ALS TLS
Figure 1. Overview of proposed data management method International Archives of the Photogrammetry, Remote Sensing and Spatial Information Sciences, Volume XXXVIII-5/W12, 2011
caused by occlusion, the point cloud is interpolated by upsampling techniques such as morphological operation or the ball-pivoting algorithm (Shi, 2008; Bernardini, 1999). It can be done by using XYZ coordinate values of neighbouring points. In filtering, particular points are extracted using XYZ coordinate values or classification value (Shan, 2008; Zeng, 2008). For example, a ground surface point cloud can be created by moving or removing particular points according to the height (Z coordinate value) or echo number. If a point cloud is classified, a building removed point cloud can be created by removing the points which are classified as buildings. In rendering, processed point clouds are displayed using XYZ coordinate values. Colored point clouds can be displayed using the RGB values of each point. In classification, points are classified into predefined classes such as buildings, ground, and vegetation using XYZ coordinate values or intensity (Shan, 2008; LAS, 2007). Table 2 shows the specific contents of the classification field which is configured referring to LAS specification. Therefore, in our structure, XYZ coordinate values, intensity, RGB values, echo number and classification are stored in each point and the coordinate transformation matrix (trans_matrix) is stored in the file header as shown in Figure 2.
data
Figure 2. Data structure of the general point cloud data format represented in EXPRESS-G
For meeting R2, we store the type of measurement system (type), measurement time and date (time), measurement range (min_maxXYZ), measurement place (indoor/outdoor), and provider (provider) in the header of the file, which enable point cloud file searching by various search queries. For example, information about measurement type is useful to apply algorithms which are designed for point clouds with specific properties depending on the type of measurement system. For meeting R3, an octree structure enabling efficient space searching is built. It is useful to find point clouds in the region of interest. Moreover, it is useful to find overlap regions between some point clouds in quality rendering of multiple point clouds described in chapter 4. Therefore, an octree structure is built in each point cloud file.
Finally for meeting R4, it is required that the rendering quality must be maintained constantly while displaying point clouds regardless of the viewpoint or number of the points. In particular, uniform point density and advancement of FPS are required. To meet these requirements, a quantized point cloud is stored in each inner node, whose number of points is less than original point cloud (Wand, 2007). In addition, file ID and number of points are stored in the file header as a metadata, and user data (optional field that can be used by users) are stored in each point and file header for scalability.
Necessary data Output
Denoising X, Y, Z, Intensity X,Y, Z
Registration X, Y, Z, Intensity
Coordinate transformation matrix
Interpolation X, Y, Z X, Y, Z (R, G, B)
Filtering X, Y, Z, Classification,
echo number X, Y, Z
Rendering X, Y, Z, R, G, B, Intensity (Rendered image)
Classification X, Y, Z, Intensity Classification
Table 1. Necessary data for point cloud processing
Value Meaning
Table 2. Classification class
3.2.2 Octree: An octree structure is adopted for efficient
search and rendering of the point clouds. Figure 3 shows an example of building octree structure by space subdivision. Octree is a tree data structure which is used to partition a 3D space by recursively subdividing it into eight sub spaces. Each node has eight children nodes. The root node is associated with a minimum axis-aligned bounding cube of the given point cloud. Each children node is associated with each uniformly subdivided cubes of parent node. The leaf node has points in the associated cube. Each node is recursively subdivided until the number of points stored in it becomes less than nmax. An octree structure enables efficient rendering with view-frustum culling and determining LOD described in next section. Moreover, in a case handling multiple point clouds, overlap region detection can also be efficiently achieved by using an octree.
3.2.3 Quantization: LOD techniques (Rusinkiewicz, 2000;
Wand, 2007) are necessary for efficient rendering of large scale point clouds. In order to achieve an LOD representation, we use quantized points. First, we create a quantization grid in each inner node by uniformly dividing its cube into k3 grid cells (k is the number of divisions along each side). If there are one or more points in each quantization grid cell, only one representative point is selected by a random manner and is stored in the node. An example of the quantized point clouds is shown in Figure 3. In this way, uniformly down-sampled points can be stored in each inner node.
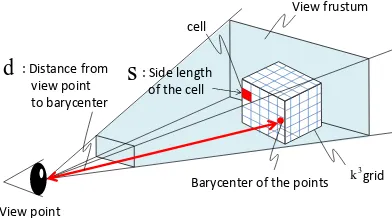
Cell
Figure 3. Octree and quantization
3.3 Rendering method
3.3.1 Rendering of a point cloud: Efficient point cloud
rendering is realized by LOD using quantized points stored in inner nodes, or original points stored in leaf nodes. A depth-first search of the octree is performed during rendering. Depth traversal is done until the node satisfies the condition becomes closer to the point cloud, value d becomes small and more detailed points in deeper nodes are rendered. Conversely, when the viewpoint becomes far from the point cloud, value d becomes large and more down-sampled points in upper level nodes are rendered. As a result, real-time view-dependent LOD can be achieved.
there is overlappings among multiple point clouds, rendering is done by the following method to maintain the uniform point density of the point clouds. Figure 5 shows the overview of rendering method of multiple point clouds with overlaps.
i) Detect overlap region among multiple point clouds using bounding cubes of octrees (Figure 5 (a)).
ii) If overlaps exist, search the nodes N whose cubes are entirely included in the overlap region (Figure 5 (b)). iii) For the node satisfying the condition s/d
(where
) in N, the points stored in the node are rendered. For the other node in N, a part of the quantized points stored in the parent node are rendered (Figure 5 (c), (d)).B
(b) Finding cubes in the overlap Cubes (nodes) of each point cloud in overlap region
(c) Local down sampling using a part of quantized points of the parent
(d) Result
Figure 5. Rendering of multiple point clouds with overlaps
3.4 Search function
In our system, it is possible to search point clouds by several queries such as measurement range, measurement time and date, type of measurement system, provider, and measurement place (indoor/outdoor). Searching point clouds by several queries is useful in several applications. For example, modelling of buildings can be done using a point cloud acquired by searching based on measurement range and measurement place (outdoor). As another example, object recognition and surveying of land use can be done using point clouds obtained by searching based on measurement range and measurement time and date. The search process consists of the following two stages.
First, point cloud files are searched according to user specified queries. The table which contains information of the file header is used for searching. If the range is used as a query, point clouds in the files obtained by the search are used in the following search.
Then, the search based on range is performed for each point International Archives of the Photogrammetry, Remote Sensing and Spatial Information Sciences, Volume XXXVIII-5/W12, 2011
cloud in each file obtained by the search. Points in the query range are efficiently found using an octree structure.
4. RESULTS AND EVALUATIONS
4.1 Test data sets and implementation
Data sets used in the tests are summarized in Table 3. We used two data sets which were scanned in urban area at Kyoto and Tokyo, Japan. Data set 1 consists of 10 files of MMS point clouds, and the total number of points is about 3 million (Ishikawa, 2009). Data set 2 consists of 2 files of MMS point clouds and 1 file of ALS point cloud, and the total number of points is about 12 million. Each data set is shown in Figure 6 and 7. Our system was implemented on a standard PC with Intel Core i7 2.93GHz, 8GB RAM, and GeForce GTX 470 graphics board. All tests were performed at parameters nmax=100,000, k=128.
Data set 1 Data set 2
Scan type
and files MMS x 10
MMS x 2 ALS x 1
Total points 2,999,041
(300k per files)
11,935,168
(7M, 4M in MMS files 1M in ALS file)
Location Uji, Kyoto, Japan Tyofu, Tokyo, Japan
Provider Waseda University KOKUSAI KOGYO CO.,
LTD
Table 3. Data set
4.2 Results of point cloud searching
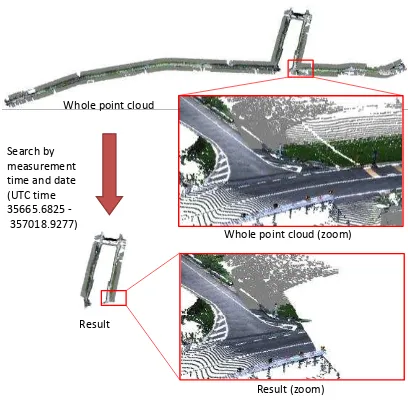
Figure 6 shows the result of searching point clouds using measurement range (Global coordinate: -28000.0 < x < -27700, -37700 < y < -37350) and type of measurement system as a search query, and Figure 7 shows the result of searching point clouds using measurement time and date (UTC time: 35665.6825-357018.9277). The point clouds satisfying given query were obtained from multiple point cloud files.
Whole data
Scan type: ALL
Scan type: MMS
Scan type: ALS Range (Global Coordinate):
-28000.0 < x < -27700.0 -37700.0 < y < -37350.0
Figure 6. A result of searching by measurement system and range from multiple point cloud files
Whole point cloud
Result (zoom) Whole point cloud (zoom)
Result Search by measurement time and date (UTC time 35665.6825
-357018.9277)
Figure 7. A result of searching by measurement time
4.3 Results of point cloud rendering
Comparison of point clouds rendered using an octree and quantized points of our method and without them is shown in Figure 8. As shown in the figure, using an octree and quantization structure, in case where the viewpoint was far from the point cloud (Figure 8 left), the quantized point clouds were rendered. In case where the viewpoint was close to point cloud (Figure 8 right), more detailed point clouds were rendered. Thus, LOD depending on the viewpoint was achieved. The rendering result in the case of the closer viewpoint was similar to the one of the original point cloud as shown in Figure 8 right.
No octree and quantization structure
Rendering with octree and quantization structure
Figure 8. Result of point cloud rendering International Archives of the Photogrammetry, Remote Sensing and Spatial Information Sciences, Volume XXXVIII-5/W12, 2011
In order to verify the effect of the octree and quantized points, we measured the FPS of rendering the point cloud. The average FPSs when moving the viewpoint 30 seconds at random near and far off the point clouds were measured. In the case of the far viewpoint, the whole region of the given point clouds was rendered, and in the near case, a local region of the point clouds was rendered. Table 4 shows the average FPS of each case. As show in Table 4 (a), in the case of the far viewpoint, FPS could be improved by dozens of times using an octree and quantization structure compared with the case without particular structure. In the case of the near viewpoint, efficient rendering could be achieved by the use of quantized points and view-frustum culling. Moreover, FPSs in the case of using the overlap detection described in section 3.3.2 are also shown in Table 4 (b). The FPSs were measured under same viewpoint conditions described above. The point clouds were rendered more efficiently by using overlap detection when the viewpoint was close to the point cloud. This is because the point density was uniformed in the area of measurement overlaps.
Viewpoint No particular structure
Octree and quantizaiton structure
(a) No overlap detection
(b) Rendering with overlap detection
Far 2.2 48.4 50.1
Near 2.2 6.9 18.3
x 22
x 4.86
x 3.14
Table 4. Value of FPS [fps]
5. CONCLUSIONS
In this paper, first, the requirements for data management of point clouds were discussed, and a general point cloud format which meets the requirements for the use of point clouds in several point processing was defined. Second, an efficient search using the headers and octree structure of general point cloud data format was achieved. Then, an efficient rendering for multiple large scale point clouds using octree structure and quantized point cloud was achieved. Finally, we confirmed that a flexible search and efficient rendering of multiple point clouds could be achieved with the proposed data management method.
ACKNOWLEDGEMENTS
We wish to thank Kiichiro Ishikawa, Research Institute for Science and Engineering, Waseda University, and Kouji Takeda, Kokusai Kogyo Co., Ltd for providing data sets.
REFERENCES
Shan, J., Toth, Charles K., 2008. Topographic Laser Ranging and Scanning. CRC Press, USA, pp. 295-306.
Rusinkiewicz, S., Levoy, M., 2000. QSplat: A Multiresolution Point Rendering System for Large Meshes. In: SIGGRAPH 2000, New Orleans, USA, pp. 343-352.
Mandlburger, G., Otepka, J., Karel, W., Wagner, W., Pfeifer, N., 2009. Orientation and Processing of Airborne Laser Scanning Data (OPALS) – Concept and First Results of a Comprehensive ALS Software. In: Laserscanning 2009, Paris, France, Vol. XXXVIII, Part 3/W8, pp. 55-60.
Bohm, J., Haala, N., 2005. Efficient Integration of Aerial and Terrestrial Laser Data for Virtual City Modeling Using LASERMAPS. In: Laserscanning 2005, Enschede, the Netherlands, pp. 192-197.
Lavarone, A., Vagners, D., 2003. Sensor Fusion: Generating 3D by Combining Airborne and Tripod-Mounted LIDAR Data. In: The International Archives of the Photogrammetry, Remote Sensing and Spatial Information Sciences, Vol. XXXIV, Part XXX.
Wand, M., Berner, A., Bokeloh, M., Fleck, A., Hoffmann, M., Jenke, P., Maier, B., Staneker, D., Schilling, A., 2007. Interactive Editing of Large Point Clouds. In: Eurographics Symposium on Point-Based Graphics, Prague, Czech, pp. 37-46.
Zeng, Q., 2008. Data Filtering and Feature Extraction of Urban Typical Objects from Airborne Lidar Point Cloud. In: The International Archives of the Photogrammetry, Remote Sensing and Spatial Information Sciences, Beijing, Vol. XXXVII, Part B3b, pp. 153-156.
Shi, Z., Tang, G., 2008. A Approach from Point Cloud Plus Feature Data to Grid DEM. In: The International Archives of the Photogrammetry, Remote Sensing and Spatial Information Sciences, Beijing, Vol. XXXVII, Part B3b, pp. 247-252.
Bernardini, F., Mittleman, J., Rushmeier, H., Silva, C.,Taubin, G., 1999. The Ball-Pivoting Algorithm for Surface Reconstruction. IEEE Transactions on Visualization and Computer Graphics, Vol. 5, No. 4, pp. 349-359.
Deschaud, J., Goulette, F., 2010. Point Cloud Non Local Denoising Using Local Surface Descriptor Similarity. In: IAPRS, Saint-Mande, France, Vol. XXXVIII, Part 3A, pp. 109-114.
Xin, W., Pu, J., 2010. An Improved ICP Algorithm for Point Cloud Registration. In: 2010 International Conference on Computational and Information Sciences, Chengdu, China, pp. 565-568.
Bohm, J., Becker, S., 2007. Automatic Marker-free Registration of Terrestrial Laser Scans Using Reflectance Features. In: proceedings of 8th Conference on Optical 3D Measurement Techniques. pp. 338-344.
Ishikawa, K., Amano, Y., Hashizume, T., Takiguchi, J., Shimizu, S., 2009. City Space 3D Modeling Using a Mobile Mapping System (in Japanese). The Society of Instrument and Control Engineers Trans. on Industrial Application, Vol. 8, No. 17, pp. 133-139.
2007. LAS Specification Version 2.0 Proposal. ASPRS. International Archives of the Photogrammetry, Remote Sensing and Spatial Information Sciences, Volume XXXVIII-5/W12, 2011
![Table 4. Value of FPS [fps]](https://thumb-ap.123doks.com/thumbv2/123dok/3226227.1395807/6.595.60.285.311.389/table-value-of-fps-fps.webp)
