LIGHT-WEIGHT SENSOR PACKAGE
FOR PRECISION 3D MEASUREMENT WITH MICRO UAVs
E.G. POWER-LINE MONITORING
K.-D. Kuhnert a, *, L. Kuhnert a
a
Institute of Real-Time Learning Systems, Faculty IV, University of Siegen, D-57068 Siegen, Germany
(kuhnert,lars.kuhnert)@fb12.uni-siegen.de
KEY WORDS: Micro UAV, light-weight 3D-sensor, laser scanner, power-line monitoring, DEM, point cloud
ABSTRACT:
The paper describes a new sensor package for micro or mini UAVs and one application that has been successfully implemented with this sensor package. It is intended for 3D measurement of landscape or large outdoor structures for mapping or monitoring purposes. The package can be composed modularly into several configurations. It may contain a laser-scanner, camera, IMU, GPS and other sensors as required by the application. Also different products of the same sensor type have been integrated. Always it contains its own computing infrastructure and may be used for intelligent navigation, too. It can be operated in cooperation with different drones but also completely independent of the type of drone it is attached to. To show the usability of the system, an application in monitoring high-voltage power lines that has been successfully realised with the package is described in detail.
1. INDRODUCTION
Several systems have been invented or proposed for 3D measurement of landscape and other outdoor surfaces. Our system is intended for the 3D measurement of digital elevation maps (DEM) by using small or micro UAVs. Therefore, it has only a weight of 1.5kg while including a medium range laser scanner, a medium resolution camera, an IMU and GPS. It contains its own computing infrastructure and is therefore quite independent of the type of UAV it is attached to.
The laser scanner has a range of about 200m and 0.25deg angle resolution. The camera has a resolution of 1300*1300 pixel which is enough for medium quality photometry. But the main purpose is to support and document the scanning results. A high quality IMU and a GPS sensor are used to create a pose estimation of the UAV (see details in chapter 3).
Because the different sensors are glued together with an embedded computer which has several interfaces available, it is possible to combine the sensor system with a certain type of UAV by getting the pose information from the downstream of the UAV.
The sensor package can also be utilized as stand alone system getting only the power supply form the UAV. For most mini or micro UAVs the quality of this operation mode is superior to using the UAV data, due to high precision and low drift of the packages IMU. The low power consumption was demonstrated in experiments were the maximum operation-time of a microdones md4-1000 UAV was only cut by 5% compared to flying with no payload. If necessary the system can operate on its own battery. In this case it is completely independent of the UAV.
The system stores the measurement data on a USB-stick with full quality. But it is also possible to down-stream the data with
reduced resolution e.g. for monitoring. In post-processing the data are fused into a point cloud and a DEM. The precision is in the sub-dm range.
One advantage of our system is the high lateral resolution of the laser-scan data which allows even to measure the ropes of high voltage power-lines (see capter 4). This application has been realised together with Cenalo GmbH. First the UAV autonomously scans the power-line. The distance to the power line can be optimised. Thus, it has not to be switched off but a near measurement is possible. This has the advantage that up-to-date precise measurements of the ropes of the power line and -at the same time- of the vegetation beneath it become available.
Typically, quantitative 3D data are difficult to collect. Here within 1h a complete segment of the power-line can be measured. The precision is in the sub-dm range. With a special evaluation process the precision can be increased to the cm range in the post-processing. Also it is possible with the same data to verify an existing mapping e.g. the hight profile even in strongly vegetated areas. The result is a 3D geo-referenced map.
2. RELATED WORK
Unmanned aerial vehicles (UAVs) in conjunction with a laser scanner have been previously used by other research groups. Most experiments in this field, like (Morris et al., 2010) or (Grzonka et al., 2012) are operating in an indoor scenario and performing self-localization and mapping with a SLAM approach. Common SLAM algorithms are working best with structured terrain. Indoors GPS is typically not available. Thus, SLAM is very often the only way to get a self-localization.
In outdoors which has less structured terrain SLAM is harder to use but GPS mostly is available and robust on a UAV. Thus, it can be used for self-localization. In (Nagai at al., 2009) and (Yi et al., 2011) laser scanners were combined with an UAV to do
outdoor mapping. Yi used a much bigger UAV with a total weight of 330kg to do big scale terrain mapping.
A few groups already published work on 3D-measurement of forest surface shape. Nagai et al. in their paper reported tree height estimation and terrain mapping with a UAV and several sensors. (Wallace et al., 2012) deliver a very in depth analysis of the precision of their 3D-laserscan data for vegetation measurement.
The sensor-system described in this paper is distinguished from the mentioned work by its light-weight, modularity and flexibility. The realised application has not been described in this form up to now to the best knowledge of the authors.
3. SENSOR PACKAGE
3.1 Concept
The sensor package was developed by keeping in mind the experiences from several projects with different sensor configurations. In Airshield (we acknowledge the funding by the BMBF) several gas-sensors have been tested in a drone swarm. In an other project, mainly different cameras have been involved to equip the several drones of a swarm. For automatic landing experiments the drones have been used with laser scanners, a stereo camera, ultrasonic sensor, and optical flow sensors.
During these experiments it became obvious that it is not trivial to operate different sensors on even only one drone. Handling a swarm with heterogeneous drones and different sensors improves the complexity. Thus, there was a substantial need to treat the data of the different sensors in a unified way to allow an easy and modular way of utilisation. Central design criteria have been small weight and low power consumption.
Also the package was intended to be independent of the type of the drone. Thus, it was decided to use an embedded computer to make it completely modular. In the beginning only one processor was involved but due to increasing requirements in processing power now several processors have been combined.
3.2 System
The actual system is shown in figure 1. It consists of a 400MHz ARM9 System from ICnova (blue module at the middle of the image). On this part runs the flight control. Thus, the sensor package can also be used as an intelligent high-level controller for autonomous take-off and automatic way-point navigation. The drone can communicate via WLAN with other drones or the ground station. Also if operated in a swarm a decentralized collision avoidance is implemented.
In several real-time application it is advantageous to execute complex sensor evaluation tasks directly on the drone. This way the communication with the ground station can be reduced significantly; minimizing bandwidth requirements of the communication channel and relieving the operator from information overload. To allow these complex computations the computing power has been increased by utilizing an additional Tegra2 Board from Toradex (green module at the left side). This processor contain 2*1Ghz cores, 512MByte RAM and a NVIDIA GeForce GPU.
Earlier experiments showed that straying radiation from computing equipment may heavily disturb the operation of the drone. Thus, both processor modules are fixed to a self-developed basis board which was designed by taking carefully into account electromagnetic compatibility.
The basis board provides the necessary electrical power conversion (Fig.1 right side) when feed from the accumulator of the drone. Of course, also a completely drone independent operation of the sensor package is possible by adding a dedicated accumulator to it. The basis board links the processors and a bunch of interfaces (upper side). Overall power consumption is about 2W.
Figure 1. Embedded System of the sensor package
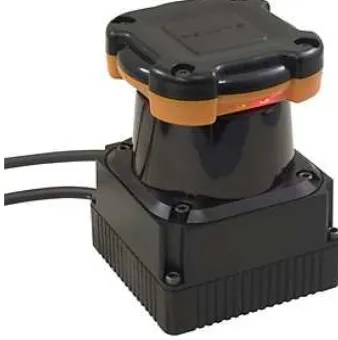
The laser scanning experiments started with the light-weight, small-size scanner from Hokuyo (30LX) shown in figure 2. Originally it is intended for wide angle obstacle surveillance in ground vehicles but due to its operating characteristics it seemed to be suited for aerial laser scanning.
It was connected to the basis board via the network interface. Its operating rage is about 30m for compact, not too dark objects.
During the experiments it was discovered that for very small and fragmented objects this range was not always reached. Because the system was intended to measure conductor-ropes and vegetation a significantly smaller measurement distance became necessary. To ensure the safety of the measurements, on the other hand, the drone has to be at least 10m distant from the target. Some promising first result, which will be presented in the next chapter, showed the feasibility of the approach but flight planning was a critical issue. Thus, this system is mainly used for scanning buildings and landscape where range is not of ultimate interest but low weight is needed.
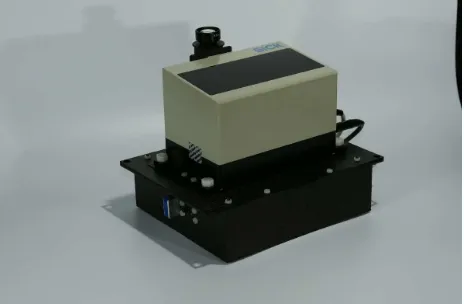
Figure 3. Sensor package with laser scanner, camera, and computing system
In figure. 3 our second generation system is shown. A laser scanner Sick LD-MRS-400001 constitutes the main sensor. It has an operating range of up to 200m and an angle resolution of 0.25 degree. Thus, also small objects can be reliably measured at quite high distances. A video camera is added to the package for control in real-time and also for documentation purposes. The resolution of the camera is 1300*1300 pixel which is already a bit too high for online transmission -and thus converted down for the video channel- but a good compromise if medium quality imagery is needed. Overall power consumption is about 15W. This amount of energy does not significantly reduce the operation-time of micro UAVs that can carry a payload of 1.5kg.
4. AN APPLICATION: POWER LINE MONITORING
4.1 Task
In the sequel an application shall be presented which has been realised with the system described in the preceding chapter. This work has been done in cooperation with Cenalo GmbH.
The basic problem is that vegetation has to be regularly supervised in the region under and near high-voltage transmission lines because it tends to grow into the line and may cause a short time overload and a fire. Especially at windy weather conditions this may lead to complete breakdown of the line. Figure 4. shows a typical configuration.
The situation is actually complicated by the fact that not seldom the ground beneath the lines is not owned by the operator of the line. So, the status of the vegetation structure has to be well measured and documented to be usable in negotiations with the owners about the appropriate actions.
Figure 4. Typical flight configuration
The most-often used, actual approach is to fly over the lines by a helicopter with quite high speed with one pilot and one person visually checking the state of the line and manually documenting it. This method is expensive and due to the speed error prone. It delivers a first hint were problems may occur but no solid measurements. Even imagery often is not available.
In praxis the information should be sufficient to find metrical borders of critical areas and map these. Further, the measurement should be precise enough to determine single trees which have to be cut down.
The critical quantity that has to be measured is the distance between the highest trees and the conductor-ropes. It has been tried to measure it using ground views but this method is only applicable in a few very special landscape configurations. Under typical conditions the line has to be switched off and workers climb onto it to do a manual measuring. Obviously, this method is very expensive.
Here laser scanning as a precise method of distance measurement comes into play. Some experiments with helicopters have been performed. In this approach standard industrial scanners can be applied because their weight is easily bearable.
To catch even small branches the helicopter must fly rather slow and close to the transmission line and the trees. It must fly so close that the downwash of the helicopter moves the trees and pushes them down. Thus, the measurement set-up changes the measurement values and produces unreliable data.
4.2 Approach
Our experiences with unmanned aerial vehicles led to the idea to build the system described in the preceding chapter and use it for the necessary measurements. Because the complete system including drone has a starting weight smaller than 5kg it can be deployed nearly everywhere.
determined. Critical areas and even single critical tees are marked.
In the experiments a UAV of the type md4-1000 from the company Microdrones carries the laser scanner. This UAV is an electrically pro-pulsed helicopter with four rotors (quadro-copter). It is fully stabilized and has a GPS based position hold. Empty weight is about 3Kg.
This UAV was equipped with additional hard- and software components as previously described. The on-board computer not only receives the data from the camera and the laser scanner but also the full downlink stream of the status data from the md4-1000. Furthermore, in automatic mode it sends flight commands to the original avionic of the md4-1000. The low level stabilization-related control is done by the UAV itself.
For the distance measurement the laser scanner UTM-30LX moves over the scene. Thus, the UAV together with the 2D laser scanner forms a 3D scanner. The distances measured by the laser scanner and the data from the UAV which contains the position, altitude and roll, pitch and yaw angles, is furnished with time stamps and written to an USB-stick.
During post-processing these data are used to generate the point-cloud. To achieve the necessary precision the position and pose data of the UAV are utilized to correct the measurement and to remove distortions which are generated by movements of the UAV which have not been compensated be the automatic pose correction control.
4.3 Flight Planning
The limited range of the used laser scanner is the reason why a trade-off between operating security and measurement quality has to be found. Our tests were done on 110kV transmission-lines which are serving the German train network.
Different types of pylons exist in this type of lines. In the first experiments pylons had one crossbar carrying two conductor-ropes at each side and a conductor-rope which is strained from pylon top to pylon top. The distance between this rope and the crossbar is approximately 10m.
For safety reasons the UAV had to keep a security distance of 10m to each single rope. The usable range of the laser scanner is about 25m as described above. This prevents just flying 10m above the central rope. Therefore it is necessary to fly two times along the track between each two pylons.
The actual path was chosen at the height of the central rope but 10m shifted to the left side. On the way back the path was shifted 10m to the right. With this method two overlapping scans are created which are covering the complete transmission line. Already at this point it became clear that this approach was not general enough to cover arbitrary high-voltage power lines but for a proof of concept it has been sufficient.
Originally the flight plan was created manually from the paper version of the construction plans of the transmission line. Several reference points have been determined for each flight between two pylons. Each pair of pylons needs an individual flight plan because the exact dimensions of every pole are different and also the exact distance between two pylons is never the same just as the sagging of the transmission lines.
At the transmission line used for our tests, the sagging of the conductor ropes varied between 10m and 30m. So, the UAV had to follow the shape of the ropes to achieve a nearly constant distance to the ropes during the scan. It is not sufficient to fly a straight course and even for a skilled operator in wood surroundings it is nearly impossible to perform manual control of the UAV and securing the flight at the same time. The task-execution was done semi-automatically and the operator mainly had to guarantee the correctness by supervision. Therefore, the flight planning and pre-programmed flight control must be done in 3D.
The flight plan consists of a way-point list with one point placed at every 5m along the path. It is pre-calculated on a PC. To make sure that the calculated flight plan is correct it is executed in a simulation environment before using it on the real scene.
The simulation software uses a digital surface model of the landscape and is able to add a configurable transmission line model. A 3D model of the surrounding and of the transmission line is created. A newer version models the pylons and points were the ropes contact them very exactly to be able to check the ropes position with cm precision.
4.4 Flight Operation
Starting and landing the UAV in a forest is a critical part so it is done manually using a remote control unit. When the UAV is above the tree tops the autonomous mode is activated. In this mode the UAV executes the pre-calculated list of 3D way-points. The UAV localizes itself by using GPS data for position/speed and a barometer as a hight sensor.
First the UAV ascents to a height which is 20m higher than the highest point of the transmission line. After that it flies directly to the first way-point of the scan path, while keeping its height. In the next step it descends to the required height for scanning. This part of the flight is done with a speed of 4m/s.
The following scan flight uses a speed of 1m/s to achieve the required resolution. After one side of the transmission line segment is scanned the UAV goes again to a height which is 20m higher than the highest point of the transmission line. Then it changes the side by flying over the top rope. The other scan part is done with the same method as described above.
When the scan is completed the UAV returns to the starting point where a human operator can land the UAV using a remote control.
4. 5 Post-processing
every laser measurement are calculated form the data which were recorded from the UAVs downstream.
Because the measurements of the different sensors (scanner, IMU, GPS) are not synchronised they have to be interpolated and re-sampled. With the known mounting position of the laser scanner on the UAV this data can be used to calculate the position and attitude of the scanner for every laser measurement.
Together with the distance values provided by the laser scanner the target point of every measured distance value can be calculated. All the calculated points together constitute a 3D point-cloud. The resolution of the method is good enough to capture even the conductor ropes.
The next step is to import the point-cloud into the existing 3D model of the transmission line which was used earlier for flight planning. In the first version this needed 45min for all points. By several improvements now near real time evaluation is possible also for very large data sets.
The absolute position is calculated by smoothing over all measurements, scaling down the GPS imprecision to the mentioned values. For relative positioning of the point-cloud the reference points are utilised to compute the corrections.
4.6 Results
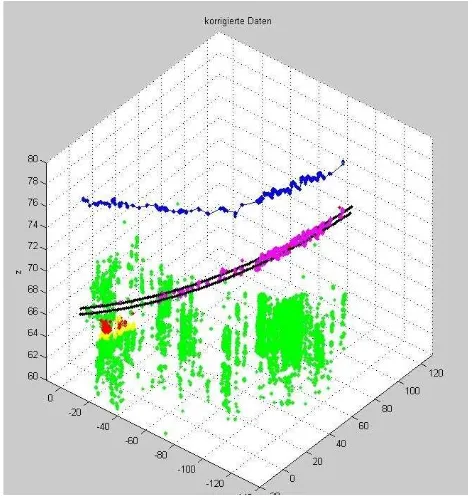
Figure 5. shows a resulting point-cloud of a flight in a rather flat landscape covered with woods. Only one direction of the flight is shown.
Figure 5. Results with Hokuyo 30LX
The top line depicts the path of the drone. The parallel lines below it show the model of the conductor ropes. The fuzzy points on the ropes are real measurements of the ropes. This demonstrated clearly that it is possible to measure them directly. Obviously, the distance between rope and drone has a strong
influence on the detection quality. There are no direct measurements at the right side of the plot; whereas at the left side, the ropes were detected nearly completely. The critical detection distance was about 17m. To get the information about the rope position but stay away from it at a save distance at the same time needs the drone to be operated in a range between [10m, 17m]. This shows that it is quite difficult but possible to fulfil this requirement with the LX30 system.
Vegetation also has been detected. It builds the vertically structured point-cloud beneath the ropes. Structuring occurs from artefacts of the pose estimation. At the left side of the figure a part of the vegetation has been marked as dangerous needing direct action. An other part has been recognised as to near but not directly dangerous. These trees must not directly cut down but have to be kept under short time, repeated observation.
Wind velocity was rather low during the test. Thus, it is save to assume that the conductor-ropes have been at their static position and no swinging occurred. In this case the ropes are straight in the vertical perspective with very good precision. The sagging follows a chain-line which has been approximated by a parabola. With this model parametrised by the construction data the accuracy of the scan measurement can be cross checked. The absolute position deviation of a point is always less than 75cm and the resolution is better than 10cm. This allows a precise relative positioning if well known positions -e.g. of the pylons- are used as references.
The safety distance between the trees and the ropes at this transmission line is 5m. So, the achieved accuracy is more than sufficient for this application. With the captured ropes the performance of flight-planning and flight control can also be shown. The deviation of the UAV position from the planned one is about 4m with a maximum to 6m. So the security distance of 10m between UAV and the conductor ropes which was used for the planning was tight but sufficient.
4.7 Second Generation Scanner-system
The tight operation range of 30LX system lead to the decision to build a new system with an other scanner. The Sick LD-MRS-400001 was chosen due to its large detection range of about 200m. The scanner has a resolution of 0.25degree at 12.5 Hz scan frequency. It scans not only one plane but four, delivering 740 measurement points for each scan. The points are unevenly distributed along the planes and a special calibration procedure is necessary to determine their precise direction. The scanner delivers them in a complex intermingled data stream which has to be decoded. The quality of the data is very good and given in the data sheet.
The scanner was integrated into the sensor package and combined with a camera. Originally the camera was only intended for documentation purposes but it became clear that is also usable for photometric measurement if quality requirements are not to high. The camera images can be send to the ground station in lower quality to support the operator but are also stored on the package computer in full resolution.
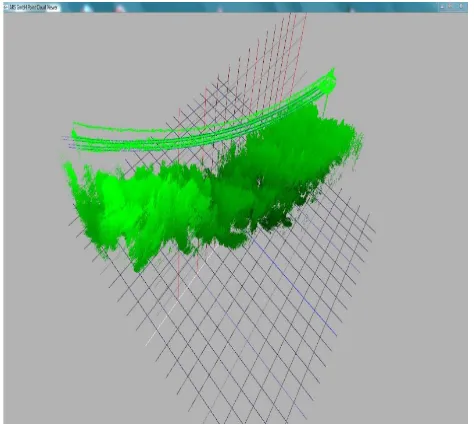
The test flights have been performed in a rather steep and difficult area were measurements with conventional methods are nearly impossible. Figure 6 shows an overview of one example depicting the final result of such a measurement campaign. Typically a point cloud for a pair of pylons contains several million points but in a high precision flight with slow speed it may exceed 10 million points substantially. The point cloud is geo-referenced with an absolute precision of about 0.5m. Relative positioning is even much better.
Figure 6. Geo-referenced data of a measurement with sensor package with LD-MRS (data courteously by Cenalo GmbH)
The vegetation can be seen clearly. In a zoom perspective single trees are distinguishable and may be identified in the photos. The conductor-ropes are completely covered with measurement points now. Also the grounding-rope at the top is detected. The precision of the scan allows to see the isolators of the pylons and partially even the pylons structure. The distance between ropes and vegetation is measured reliably and used to identify critical trees (not shown in the figure).
With this system already regular, commercial observation flights have been successfully completed.
After solving the basic task a number of new possibilities have opened up. Because the model of the ropes and their full measurements coexist in the final data set the correctness of the model can be investigated. Deviations of the real ropes form the construction data can be measured.
On the other hand by using the model knowledge of the power line as a reference function in post-processing the precision of the tree-hight estimation and especially the shape of the forest surface can be improved heavily from dm to cm precision.
The density of the data of normal flights is high enough to catch not only the upper surface of the wood but also the ground structure is detectable. For high precision flights ground data are dense enough for a real measurement. Therefore, existing plans of the construction can be verified and if necessary updated.
5. CONCLUSION
In this paper a sensor package for arbitrary mini and micro drones was presented. Results of operating it in 3D-monitoring of high voltage power lines showed the usability of the system in practical applications.
A newer version with high quality IMU and GPS is now available that improves the precision of the positioning data compared to the presented result by a factor of about 3. The self-localisation of most drones is not intended for measurement but only for navigational purposes. Thus, the additional high quality position and pose information supplements well the existing data. The integrated package with modular reconfigurability is now available.
The application of the package has been proved by the inspection of 110kV lines with one cross bar. It is the most economic method to get detailed information about vegetation near high-voltage transmission lines. Other parameters of the line can also be extracted from the data. Due to the high range of the laser scanner in the second generation system nearly all types of power-lines can be scanned now with an uncritical flight path.
The system is also applicable for other types 3D-measurement on outdoor infrastructure, buildings, forests and landscapes.
6. REFERENCES
Ax, M.; Kuhnert, L.; Langer, M.; Schlemper, J.; Kuhnert, K.-D., 2010, Architecture of an autonomous mini unmanned aerial vehicle based on a commercial platform, Joint 41th Symposium on Robotics and 6th German Conference on Robotics, June 2010
Grzonka, S.; Grisetti, G.; Burgard, W., 2012, A Fully Autonomous Indoor Quadrotor, Robotics, IEEE Transactions on, vol.28, no.1, pp.90-100, Feb. 2012
Wallace, L.; Lucieer A.; Watson C.; Turner D.; 2012, Development of a UAV-LiDAR System with Application to Forest Inventory, Remote Sensing. 2012, 4, pp. 1519-1543;
Morris, W.; Dryanovski, I.; and Xiao, J, 2010, 3D Indoor Mapping for Micro-UAVs Using Hybrid Range Finders and Multi-Volume Occupancy Grids, the workshop on RGB-D: Advanced Reasoning with Depth Cameras, on June 27, 2010, in conjunction with 2010 Robotics: Science and Systems
Conference (RSS’2010), June 2010.
Nagai, M.; Tianen Chen; Shibasaki, R.; Kumagai, H.; Ahmed, A., 2009, UAV-Borne 3-D Mapping System by Multisensor Integration, Geoscience and Remote Sensing, IEEE Transactions on , vol.47, no.3, pp.701-708, March 2009