DIRECT ORTHOPHOTO GENERATION FROM COLOR POINT CLOUDS OF
COMPLEX SCENES
Dimitrios Skarlatos a, *, Stavroulla Kiparissi a, Sofia Theodoridou b
a
Dept. of Civil Engineering and Geomatics, Cyprus University of Technology, P.O. BOX 50329, Limassol 3603, Cyprus – (dimitrios.skarlatos, stavroula.kiparissi) @cut.ac.cy
b Geoanalysis S.A. G. Genimata 54, Thessaloniki 55134, Greece -
[email protected]
Commission III, WG 4
KEY WORDS: Orthophoto, laser scanning, point cloud, accuracy, photogrammetry, computer vision.
ABSTRACT:
During the last decade, laser scanning and automated photogrammetric techniques, proved that it is possible to acquire dense colored point cloud datasets. The density of such datasets sometimes equals or exceeds the density of orthophotos. The standard orthophoto generation process using such dense and full 3D data sets, is tedious as it requires manual corrections over the 3D mesh model, as well as mosaicking and gap filling from adjacent photographs. This paper suggests a fast automated method to produce orthophotos directly from color point clouds, without the need to create a mesh surface, nor to mosaic or fill gaps. Photos from radio controlled helicopter are being processed with traditional photogrammetric process and modern computer vision techniques, against the proposed method. Reference data from land surveying are being used to compare orthophotos from different sources.
* Corresponding author.
1. INTRODUCTION
Differential rectification of photographs has been a valid and well documented photogrammetric product since the beginning of the analytic era (Vozikis, 1979). Over the next years, computer power, enhanced algorithms and applications of orthophotography, had overcome limitations of camera lenses, strong attitudes and complex surface models. Single orthophotograph generation in areas with vertical features is suffering from occlusion areas and modelling problems (Skarlatos, 1999), which can only be tackled using exact and dense 3D models instead of 2.5D Digital Surface Models (DSM), many photos from a variety of angles, along with proper software.
Orthophotos were adopted slowly from the archaeological community but only recently did they become a standard product of significant added value especially in large sites or in cases where photographic quality is a must. Archaeology is a demanding application, both in terms of photographic quality as well as accuracy. Ruins of walls pose a great challenge is large scales, as they occlude areas next to them and they need to be correctly modelled within the 3D DSM if there is any change to be correctly mapped in the orthophoto as well.
2. RATIONALE
Acquisition of dense 3D point clouds has been greatly advanced since the advent of laser scanners (Ruther, et al., 2009) and the recent combination of photogrammetry and computer vision techniques (Remondino et al., 2006, Skarlatos, et al., 2012), usually referred to as Image Based Modeling (IBM). Both techniques can be used stand-alone or complementary to each other, in order to rapidly create precise 3D models inside out, of complex structures (El-Hakim, et al., 2007, Lambers, et al., 2007).
The color information in point clouds from IBM is an internal property of the measured points, since they are calculated directly from photographs. Therefore, each point inherits the color information from the photos directly. On the other hand laser scanners are electronic distance measurement devices using either time-of-flight or phase-shift method to calculate distance (Shan, et al., 2009). Color information on the points is added after the collection, using either an external or internal camera, the later usually being of lower resolution but co-axial to the laser scanner optical axis. In most applications quality handheld photography is being used to add color information to point clouds and meshes (Vosselman, 2010). Nowadays, acquisition of quality 3D color point clouds is trivial, leading to huge datasets, irrespectively of the acquisition method.
Traditional orthophoto generation requires a DSM, along with image interior and exterior orientation data. Use of large 3D point datasets to create a DSM is a time consuming and not always a straight forward process as it may require manual corrections in areas with complex geometry. Even a very accurate 3D model cannot avoid occlusion areas, which must be filled in from adjacent photos. Smears and stretches along near-vertical and near-vertical surfaces should be also expected (Skarlatos, 1999). On the other hand, the density of the color point clouds sometimes is equivalent or better to the required orthophoto pixel size. Therefore a method to create orthophotos, or much better orthomosaics, directly from these color point clouds, avoiding surface meshing step and by-passing these problems could be considered as an interesting option.
Tournas and Tsakiri (2007) suggested a method for orthophoto generation from point clouds gathered with laser scanner and an externally mounted camera. Given the geometric relationship between the laser scanner and the camera it is possible to assign color to points from the external camera. For each orthophoto pixel, the ray is calculated and a triangle is been created on the
fly from close by points on the cloud. Interpolation on this triangle provides Z info for the subsequent orthophoto creation. The suggested method is intended for the production of a single orthophoto under the assumptions that the photo is taken from a position close to laser scanner center, the internal geometry of the camera is known, the relationship between camera and laser scanner is also known. The method proposed in this paper differs in terms that the only data necessary for orthomosaic production is a color point cloud, and that the final product is a complete orthomosaic over the area of interest.
3. METHOLOGY DESCRIPTION
The method introduced here is a modified version used by Natsis (2008), which was designed for use with laser scanner data and external photographs. The method described here is focused on color point data from aerial photos, processed with the Bundler-PMVS algorithm (Skarlatos, et al., 2012), but can be exploited with dense color point clouds of any source. Opposed to the standard orthophoto creation process, the only necessary input is a color point cloud and a reference plane. In aerial imagery this plane is usually the XY plane and from this point forward this will be considered as the projection plane. Standard photogrammetric process needs exterior and interior orientation, image files and a DSM.
The main idea is based on the fact that on the orthophoto visible points are the highest ones and therefore at any given pixel on the orthophoto, only the highest point corresponding on that pixel should be projected on the orthophoto (fig. 1). This simple concept can be easily implemented as well (fig. 2). The advantages of the proposed method are:
No need to create a mesh from the point cloud, hence overcome erroneous triangles and computer intensive processes
Reduce the process by one step
Better response in vertical features and overhangs Inherent avoidance of areas without height information Direct mosaicking as the used Multi View Stereo (MVS)
algorithm retains color information from the best possible photograph (Furukawa, et al., 2010), and the point clouds represents the whole area of interest
The obvious shortcomings of the method are:
The color of a pixel is assigned from a single pixel, while many points may correspond on the same ground pixel A point which is just inside a pixel, might assign color to
this pixel
In case the orthophotograph has very high resolution (ie small pixel size) in respect to point cloud density, many pixels might not be assigned any color value (Fig. 1).
Figure 1. Color assignment to corresponding pixel based on height info from point cloud.
The implementation of the algorithm was done using OpenCV (OpenCV, 2012) and ply files exported from PMVS software. The afore mentioned problem of remaining gaps, has been dealt with the inPaint function of OpenCV. This function requires a mask with pixels to be painted using neighboring pixel values. By default the function paints all black pixels (pixels not assigned any color value during the main algorithm), which is obviously not the proper case. Gaps due to occlusion areas and areas with moving objects such as tree leaves cannot be avoided and shouldn’t be painted at all. In order to restrict color filling of large areas, while maintaining the filling effect in small holes a filter was applied.
This method was originally designed to select void DSM pixels to be filled in, taking into account the afore mentioned parameters (Skarlatos, 1999). Therefore, it can be easily expanded in orthophoto color filling. It is based on three moving windows, 3x3, 5x5 and 7x7, around the central void pixel value. The algorithm counts the void pixels on the 3x3, 5x5 and 7x7 windows, including the central void pixel, respectively 9, 25 and 49 maximum. The user poses three thresholds as the maximum allowable void pixels in the vicinity of the central void one. Many void neighbouring pixels means that this is probably a large void area that shouldn’t be filled. By setting appropriate thresholds user can adapt the algorithm to be more or less sensitive in large gaps, or take into account the ‘shape’ of the gap by adopting significantly different values on the three windows. Using this technique the user has control over the filling areas and the program creates internally the filling mask, which is then passed on the inPaint OpenCV function.
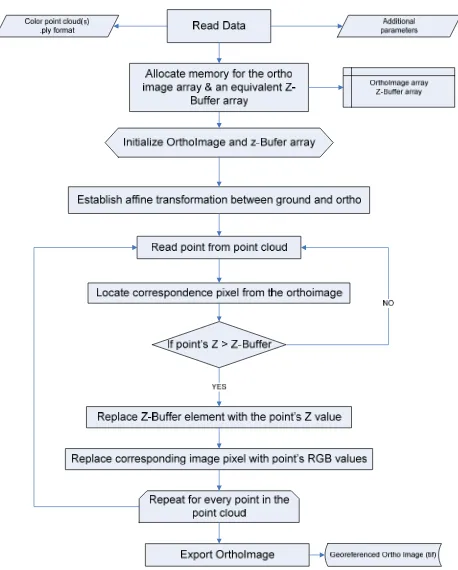
The main algorithm (fig. 2) is very fast and most of the overall program execution time is consumed on gap filling.
Figure 2. Schematic flow chart of the main algorithm of the proposed methodology.
4. APPLICATION AND COMPARISON
The aforementioned method has been used widely in underwater archaeological projects, mapping with UAV and standard aerial digital photographs from VEXCEL camera over urban areas. Although the point clouds are very dense, it is statistically difficult to cover every pixel on the orthophoto (fig. 5). Therefore the results from the proposed method are aesthetically poor with respect to the standard photogrammetric process. On the other hand, due to inherently better geometry, they should perform better on accuracy. In order to test this assumption, the proposed method was compared to the standard photogrammetric process (Erdas Imagine LPS) and a hybrid computer-vision and photogrammetric system (Agisoft’s Photoscan) utilized with the same photo set
4.1 Test area
The test area is a part from Dion archaeological site in Katerini, Greece. The whole park is 60 hectares and parts of it were photographed using a radio controlled helicopter with a calibrated Canon EOS 5D camera for orthophoto production. In addition the whole park was surveyed with total station and a vector plot was created.
The photography that took place with the radio controlled helicopter wasn’t stable enough to form a standard photogrammetric block (fig. 3). Twelve photos with varying ground pixel size from 8 to 30 mm, were taken and used with methods described previously. Since the orientation and the DSM extraction procedures differ slightly, a brief description for each method will follow
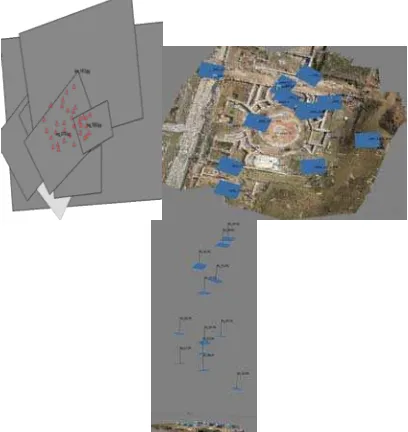
Figure 3. Layout of photographs from radio controlled helicopter and available control points.
4.2 Erdas Imagine LPS
Standard photogrammetric orthorectification took place using Erdas LPS software, as a benchmark for any other comparison. Camera calibration report was used only in this implementation. 34 control points were used for aerial triangulation with RMS 0.05 m and sigma 1.5 pixels. The automatically collected DSM was manually corrected and manually collected breaklines were used to create a high quality DSM with 0.05m spacing. The final mosaic with 0.02 m ground pixel size was photo edited as
stretches and smears were apparent. Photo editing was done with respect to errors’ nature. Overall, the manual labor was significant, but the final result was of high photographic quality (fig. 4).
Figure 4. Orthophotograph (detail) with 0.02 m pixel size, before and after the photo editing produced using the standard photogrammetric process.
4.3 Bundler and PMVS
Bundler (Snavely, et al., 2006) using Lowe’s (1999) Scale Invariant Feature Transform (SIFT) and Sparse Bundle Adjustment (SBA, Lourakis et al., 2009) can be used to relative orient a block of photos with unknown internal geometry. Patch-based Multi View Stereo (PMVS, Furukawa, et al., 2010) can then be used to create very dense color point clouds, without scale. In this particular case the original images were downsampled to 2184x1456 pixels to avoid memory management problems. The total number of keypoints extracted with SIFT algorithm was 40461, out of which 19835 were successfully matched. After the bundle adjustment, the average focal length was 1743.28 pixels, with a standard deviation of 31 pixels. The RMS of the reprojection error was 0.71 pixels. Although the camera was set at fixed focal length (no zoom, no auto focus) during photography, the adjustment results suggest significant focal length variation. The overall reprojection accuracy is lower that a pixel, which suggests that the internal geometry of the block is high.
The final 2M point cloud was created using 7x7 matching windows, at the highest possible resolution (i.e., every pixel in all photos). The threshold for the MVS has set to 3 images, hence only points visible in at least three images were considered as valid matches.
Figure 5. The original output from the proposed algorithm (on the left) with many void pixels (0.02 m pixel size), and the final orthophoto after the inPaint function gap filling process (on the right).
A seven parameter transformation was implemented by pairing control points and manually selected points from the point cloud (Skarlatos, et al., 2012) to register it with sigma naught 0.025 m. Using the aforementioned method an orthophoto with
0.02 m pixel size was created and gaps were filled with 7, 23 and 46 gap filling thresholds for the 3x3, 5x5 and 7x7 windows respectively (fig. 5 and fig. 6). No editing has been performed on the final mosaic.
4.4 Agisoft’s Photoscan
This commercial software is based on similar computer vision algorithms as those described previously along with standard photogrammetric functionality while using a graphic user interface (GUI).
Figure 6. Orthophoto (and detail) with 0.02 m pixel size, produced using the proposed method.
Figure 7. Orthophotograph (and detail) with 0.02 m pixel size, produced using Agisoft’s Photoscan.
The original images (4668x2912 pixels) were used and the adjustment was completed automatically with 46784 tie points. The estimated global focal length of the self calibration was 3519.2 pixels and the reconstructed 3D model, after decimation, had 1M points and 2M triangles. Seven control points were used to georeferenced the 3D model and the photos with average residual error 0.023 m. An orthophoto with 0.02 m pixel size was directly exported by the software (fig. 7) and was used for further testing without any editing. Some holes and stretches remain within the image although the software utilizes the complete 3D model to differentially rectify the photos.
4.5 Comparison
The methods used have some inherent differences. LPS and Photoscan create and use a 2.5D and a 3D model respectively, from matched points to differentially rectify the photos. The proposed methodology directly projects the dense color point cloud on the projection plane in order to produce the orthophoto without the need to calculate a surface. As explained previously, rectification processes performs best in flat surfaces while in complex geometry the result is poor and full of smears and stretches. In terms of visual interpretation and image quality, both methods based on complete surface modelling prior to orthophoto generation, perform mush better that the
proposed method (fig. 4, fig. 6, fig. 7). While the proposed method doesn’t produce crispy images, it is expected to be more accurate for digitization and direct measurements.
Figure 8. Points selected from land surveying, as check points to the orthophotos.
In order to test this assumption, 30 points (fig. 8) were selected to be digitized, and compared with land surveying measurements. Twenty six points correspond to vertical features such as walls and only four correspond in details at flat areas. This is highly unfavourable to the orthophotos as these points usually exhibit the largest errors. The selection was based on the fact that the features that are commonly surveyed and plotted represent discontinuities in surfaces rather than ‘flat’ details such as pavements and changes of tarmac. It should be noted that although the lower photographic quality of the orthophoto from the proposed method didn’t pose any problem in point measurements.
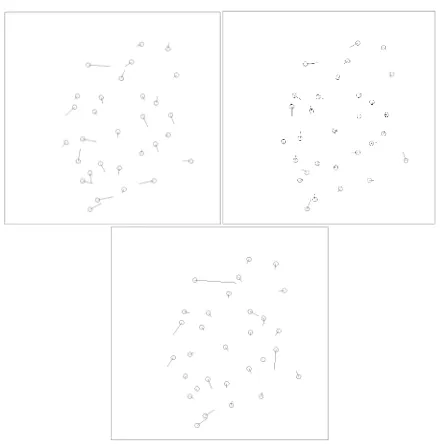
Distribution of residuals from each orthophoto (fig. 9) reveals similar shift pattern among LPS and Photoscan, while the proposed method exhibits smaller and randomly distributed residuals. This may be due the nature of the differential rectification process which inevitably stretches the photograph on occluded areas. At the same time, the photogrammetric process may perform worst as the layout of the photos isn’t a proper one, which significantly reduces overall accuracy. Computer-vision based methods with much more tie points perform better in this aspect. The proposed method seems more accurate despite the fact that the registration process was based on points from the point cloud instead on the photos themselves, hence less precise. At the same time the processed images were of lower resolution, which also degrades results in terms of point density. Results on the comparison table 1 verify that proposed method is more accurate than the traditional process or the hybrid process. The small difference between the photogrammetric and hybrid method may be attributed on the fact that the hybrid method uses a full 3D model instead of a 2.5D for rectification, hence minimizing errors on complex geometrical forms, such as vertical walls.
Figure 9. Map of residuals from LPS (upper left), suggested (upper right) and Photoscan (down) orthophotos.
LPS Point
cloud to ortho
Photosca n
# of check points 30 30 30
RMS [cm] 7.50 4.39 6.55
Std dev of RMS [cm] 3.85 2.58 6.61
# Outliers (>2σο) 1 2 2
RMS after outlier
removal [cm] 7.10 4.00 5.13
Table 1. Orthophoto accuracy comparison
5. CONCLUSSION AND SUGGESTIONS
A new method for direct creation of orthophotos from color point clouds is suggested and tested against traditional photogrammetric process and a hybrid computer-vision and photogrammetric method. Results were compared against surveying measurements.
In terms of visual results, methods based on surface creation and differential rectification perform better that the proposed method. On the other hand the proposed method, where no interpolation through a triangulated surface is taking place, performs better in accuracy assessment. Keeping in mind accuracy expectancy based on pixel size from original photos, the only method that fulfils the standards is the proposed one. Usage of the full resolution images with the proposed method might have lead to better photographic quality product but not better than the other methods. Simple improvements on the color attribution from points to pixels, based on point distance from the center of the pixel, could improve the image quality, which is the main problem of the proposed method.
AKNOWLEDGEMENTS
Part of the authors would like to thank Cyprus University of Technology for the starting research grant titled "More Information".
REFERENCES
Vozikis, E.: Differential rectification of oblique photographs of plane objects. Photogrammetria, 35(3), 81--91 (1979)
Skarlatos D.: Orthophotograph production in urban areas. Photogrammetric Record, 16(94), 643—650 (1999)
Rüther, H., Chazan, M., Schroeder, R., Neeser, R., Held, C., Walker, S., J., Matmon, A., Horwitz, L., K.: Laser scanning for conservation and research of African cultural heritage sites: the case study of Wonderwerk Cave, South Africa. Journal of Archaeological Science, 36(9), 1847—1856 (2009)
Remondino, F., El-Hakim, S.: Image-Based 3D modeling: A review. Photogrammetric record 21(115), 269—291 (2006)
Skarlatos, D., Demestiha, S., Kiparissi, S.: An 'open' method for 3D modelling and mapping in underwater archaeological sites. International Journal of Heritage in the digital era. 1(1) (2012)
El-Hakim, S., Gonzo, L. Voltolini, F., Girardi, S., Rizzi, A., Remondino, F., Whiting, E., 2007: Detailed 3D Modelling of Castles. International Journal of Architectural Computing, 5(2), 199—220 (2007).
Lambers, K., Eisenbeiss, H., Sauerbier, M., Kupferschmidt, D., Gaisecker, T., Sotoodeh, S., Hanusch, T.: Combining photogrammetry and laser scanning for the recording and modelling of the Late Intermediate Period site of Pinchango Alto, Palpa, Peru. Journal of Archaeological Science, 34(10), 1702—1712 (2007)
Shan, J., Toth, C., K.: Topographic laser ranging and scanning: Principles and Processing. CRC Press, (2009)
Vosselman, G.: Airborne and terrestrial laser scanning.. Taylor & Francis, (2010)
Tournas, L., Tsakiri, M.: Orthophoto generation from unorganized point clouds. Photogrammetric Engineering & Remote Sensing, 73(11), 1277-1283 (2007)
Natsis, S.: Software development for an alternative method for orthophoto production. Diploma thesis, National Technical University of Athens (2008)
OpenCV (Open Source Computer Vision),
http://opencv.willowgarage.com/wiki/ (last assessed 2012)
Furukawa, Y., Curless, B., Seitz, S., M., Szeliski, R.: Towards Internet-scale Multi-view Stereo. CVPR, 1434-1441 (2010).
Snavely, N., Seitz, S., M., Szeliski, R..: Photo tourism: Exploring image collections in 3D. ACM Transactions on Graphics (Proceedings of SIGGRAPH 2006).
Lowe, D.: Object Recognition from Local Scale- Invariant Features. Proceedings of the International Conference on Computer Vision, Corfu, Greece, 1150–-1157. (1999)
Lourakis, M. I. A., Argyros, A. A.: SBA: A software package for generic sparse bundle adjustment. ACM Transactions on Mathematical Software, 36(1), 1--30. (2009)