A SPATIO-TEMPORAL DISAGGREGATION METHOD TO DERIVE TIME SERIES OF
NORMALIZED DIFFERENCE VEGETATION INDEX AND LAND SURFACE
TEMPERATURE AT FINE SPATIAL RESOLUTION
V.M. Bindhu a, *, B. Narasimhan b a
Associate Professor, SMBS, VIT University Chennai campus, bindhu.vm@vit.ac.in b
Associate Professor, EWRE Division, Department of Civil Engineering, IIT Madras, Chennai-36, India , nbalaji@iitm.ac.in
KEY WORDS: Disaggregation, NDVI, LST, Evapotranspiration, phenology, water management
ABSTRACT:
Estimation of evapotranspiration (ET) from remote sensing based energy balance models have evolved as a promising tool in the field of water resources management. Performance of energy balance models and reliability of ET estimates is decided by the availability of remote sensing data at high spatial and temporal resolutions. However huge tradeoff in the spatial and temporal resolution of satellite images act as major constraints in deriving ET at fine spatial and temporal resolution using remote sensing based energy balance models. Hence a need exists to derive finer resolution data from the available coarse resolution imagery, which could be applied to deliver ET estimates at scales to the range of individual fields. The current study employed a spatio-temporal disaggregation method to derive fine spatial resolution (60m) images of NDVI by integrating the information in terms of crop phenology derived from time series of MODIS NDVI composites with fine resolution NDVI derived from a single AWiFS data acquired during the season. The disaggregated images of NDVI at fine resolution were used to disaggregate MODIS LST data at 960 m resolution to the scale of Landsat LST data at 60 m resolution. The robustness of the algorithm was verified by comparison of the disaggregated NDVI and LST with concurrent NDVI and LST images derived from Landsat ETM+. The results showed that disaggregated NDVI and LST images compared well with the concurrent NDVI and LST derived from ETM+ at fine resolution with a high Nash Sutcliffe Efficiency and low Root Mean Square Error. The proposed disaggregation method proves promising in generating time series of ET at fine resolution for effective water management.
* Corresponding author. This is useful to know for communication with the appropriate person in cases with more than one author.
1. INTRODUCTION
Studies related to water resources management necessitate continuous monitoring and evaluation of the various components of water balance, among which evapotranspiration (ET) is significant. Information regarding the various water balance components including ET could be obtained based on field measurements. The major handicap of field based measurements is that they are localized measurements; representative of only a small area surrounding the instrument set up and hence fails to capture the spatial and temporal variation of ET. In this context, estimation of ET from remote sensing based energy balance models have evolved as a promising tool in the field of irrigation and water resources management. Remote sensing based measurements can provide spatially as well as temporally distributed information regarding the hydrological conditions of the area. Remote sensing based approaches for estimating ET are mainly based on the principle of surface energy balance.
Performance of the energy balance models and reliability of the ET estimates is decided by the availability of remote sensing data at high spatial and temporal resolutions. Coarse resolution satellites like MODIS-Terra/Aqua (Moderate Resolution Imaging Spectrometer), GOES (Geostationary Operational Environmental Satellite) and NOAA-AVHRR (National Oceanic and Atmospheric Administration-Advanced Very High Resolution Radiometer) provide data in the visible, near
infrared and thermal regions of the spectrum at a fine temporal frequency, free of charge unlike the fine resolution satellites whose revisit frequency is in the order of weeks. But the huge tradeoff between the temporal and spatial resolution of data provided by coarse resolution satellites restrict its applicability to regions mostly characterized by homogeneous land covers.
Among the input variables required for determining ET, LST and NDVI are the decisive components that determine the rate and scale of ET estimates. LST provides an indication of the net effect of land-atmosphere interactions, which results in the process of ET (Moran et al., 2004), whereas NDVI has the distinct ability to provide information regarding the characteristics of vegetation in terms of its vigor, distribution and growth stage. In this context spatial and temporal disaggregation of data available from coarse resolution satellites have evolved as a feasible option towards estimating ET at finer scales.
Studies related to disaggregation of NDVI can be traced to traditional data fusing approaches like intensity-hue-saturation transformation (Carper et al., 1990) Principal component analysis (Shettigara., 1992) and Wavelet transformation (Yocky, 1996) which were used to generate high resolution multispectral imagery, but failed to capture the temporal variation in surface reflectance caused by phenology (Gao et al., 2006; Zhu et al., 2010) which in-turn decides the dynamics of vegetation. Meteorological satellites provide data at high temporal frequency, but the spatial resolution is too coarse to The International Archives of the Photogrammetry, Remote Sensing and Spatial Information Sciences, Volume XL-8, 2014
identify the pixels with distinct heat flux properties which in-turn decides the performance of the model. Conversely, the satellites with high spatial resolution have low repeat cycles. Spatial and Temporal Adaptive Reflectance Fusion Model (STARFM) and Spatial Temporal Adaptive Algorithm for Mapping Reflectance Change (STAARCH) simulated reflectance data at fine spatial and temporal resolution by combining the spatial information from fine resolution imagery integrated with the temporal information acquired from coarse resolution imagery (Gao et al., 2006; Hilker et al., 2009). Moreover, assumption of linearity in the rate of change of reflectance across a period cannot be valid in the case of pixels representing agriculture, which has a unique non linear crop phonological cycle. Hence, methods that integrate change in crop phenology within the disaggregation scheme will be effective in capturing the temporal variability across a season in spatial disaggregation.
Several studies in the past have focused on disaggregating the coarse resolution thermal data based on the fine resolution visible and the NIR data available from the same satellite. Most of these studies use the negative correlation between NDVI and LST. In general, these methods do a statistical regression between NDVI or its derivatives (aggregated to the resolution of LST), and the actual LST, and use the developed regressive relationship to disaggregate the coarse resolution LST into a fine resolution LST (Agam et al., 2007; Kustas et al., 2003; Yang et al., 2010). The residuals which are generated at coarse resolution are added back to the simulated temperatures based on the assumption that across the set of fine resolution pixels which constitute the original coarser pixel, the residuals remain constant and is equal to the value generated at the coarser level. But adding back constant residuals fails to account for the spatial variability that occurs at the finer level and this in turn
results in creating a “boxy artifact” in the disaggregated
temperature under situations when the residual associated with a given pixel is exceptionally different from the neighboring pixels (Agam et al., 2007). Hence, a method that would disaggregate the residuals to a finer scale would be desirable in the context of heterogeneous terrain.
In order to achieve this aim, the objective of the current study is to develop a methodology to improve the spatial and temporal scales of NDVI and LST data acquired from satellites to derive estimates of ET. The area selected for the study is Gadana subbasin, located in the southern part of Tamil Nadu, India, and forms a part of the Thamiraparani River basin. The area is dominated by rice paddy agricultural fields, which is one of the major consumers of irrigation water across the basin. Hence, an accurate assessment of the water consumption in the form of ET in these fields is critical for managing the available water resources within the basin in a sustainable manner.
2. METHODOLOGY 2.1 Disaggregation of NDVI
The primary datasets employed in this study are: (1). Twelve, 16 day composites of 240 m NDVI acquired from MODIS Terra sensor (MOD13Q1) spanning the period November 2011 to March 2012. (2). MODIS reflectances (MOD09GQ-v005) in the visible and near infrared bands at a spatial resolution of 240 m (3) Visible and near infrared data acquired from IRS-P6 AWiFS sensor on January 19, 2012.
The MODIS datasets were obtained through the online Datapool at the NASA Land Processes Distributed Active Archive Center (LPDAAC), USGS/ Earth Resources
Observation and Science (EROS) Center
(https://lpdaac.usgs.gov/get_data). The IRS-P6 AWiFS image corresponding to January 19, 2012 was obtained from National Remote Sensing Center (NRSC) (www.nrsc.gov.in). The images were georeferenced to the common projection UTM-WGS 84 zone 43N before estimating the NDVI values from the red and near infrared reflectances. The acquired images of MODIS, and AWiFS were processed to obtain the corresponding NDVIs using standard calibration equations and coefficients.
.
2.2 Disaggregation model (DisNDVI)
The proposed disaggregation method, DisNDVI aims at generating fine spatial resolution (60m) images of NDVI, with
sensors of different characteristics, in order to make the NDVI’s
derived from MODIS and AWiFS sensors comparable, the Agriculture, Scrub, Forest, Fallow, Urban, and Water bodies.
2.2.1 Agriculture
The temporal NDVI data were used to generate the variation in phenological profiles of the pixels representing agriculture. The NDVI series was plotted against the normalized growth period of the crop. The growth stage was plotted as a sinusoidal fit covering the transplanting, reproductive stage, and harvest as shown in fig.1. The profile of NDVI derived from the denotes the growth fraction of the pixel in its phenologic cycle. The International Archives of the Photogrammetry, Remote Sensing and Spatial Information Sciences, Volume XL-8, 2014
Figure 1. Temporal profiles of NDVI derived for the pixels representing agriculture
DisNDVI disaggregates pixels represented by agriculture based on the assumption that the crop phenology traced from MODIS NDVI composites at the resolution of 240 m is applicable at the finer resolutions also. Based on this hypothesis, given the NDVI temporal profile, a fine resolution image of NDVI acquired within the growing season could be used to estimate the growth fractions of the individual pixels depending upon its stage of development. The fine resolution AWiFS (MODIS equivalent) image acquired on January 19, 2012 represents pixels at a growth stage within the rising phase of the phenological cycle. The growth fraction of the pixels represented by agriculture was determined using an inverse modeling approach based on eqn. 1. Given the growth fraction of the pixels at fine resolution corresponding to a given date, the NDVI corresponding to another date (expressed in terms of growth fraction) can be derived. Inorder to derive the NDVI for another date, the difference in growth fractions between the two dates is accounted, and the growth fraction corresponding to the date of prediction is determined. The sinusoidal expression for NDVI is applied to determine the NDVI at fine resolution, corresponding to the new set of growth fractions. The method was applied to generate NDVIs at fine resolution for the concurrent MODIS NDVI images acquired on different dates spanning the period December, 2011 to March, 2012.
2.2.2 Forest
The land use map of the study area showed that, almost 20 % of the region is covered by evergreen forest. The phenological variation indicated that, temporal variation in NDVI was relatively insignificant during the growing season (fig. 2).
Figure 2. Temporal profiles of NDVI derived for the pixels representing forest
Hence a constant fraction approach, based on the hypothesis that ratio of NDVI of a given fine resolution pixel to the averaged NDVI (4 x 4 pixels constituting a 240 m MODIS pixel) remains a constant within the season. The assumption remained the same in the case of pixels representing urban and barren land, since the NDVI remained a constant through the period. The methodology adopted in the case of agriculture pixels was adopted to disaggregate pixels representing scrub/ brushland which also exhibited distinct phenology.
The methodology was adopted to disaggregate the NDVI corresponding to the dates 25.12.2011, 19.01.2012, 20.02.2012, 19.03.2012, and 21.03.2012. The NDVI images at fine resolution form input to the model employed for disaggregation of LST.
2.3 Disaggregation of LST
The datasets employed for the study include disaggregated NDVI at 60 m along with MODIS Land Surface Temperature products (MOD11A1). NL-DisTrad is a hybrid model developed by combining the hot edge model, that describes the relationship between NDVI and LST of dry pixels and the ANN model that captures the influence of neighbourhood pixels on LST. The hot edge model used the relationship between the NDVI and LST data from MODIS, captured at the hot edge of the feature space plot, to disaggregate the MODIS LST from 960 m to 60 m, corresponding to the scale of AWiFS data (Fig. 3).
Figure 3. Scatter plot of LST and NDVI derived from MODIS at 960 m along with the polynomial fit for the pixels comprising
the hot edge.
Inorder to obtain the hot edge, the NDVI values were binned at an interval of 0.05 and top 5 % of the LST pixels were identified to fit the polynomial relation. The variation of the residuals derived at 960 m was captured using an ANN model, with the NDVI from the surrounding pixels as the input and the LST residual at the coarse resolution as the corresponding output. The hypothesis is that the LST of a pixel will not only be affected by the vegetation within the pixel but also by the vegetation of surrounding pixels. The nine NDVIs, which were derived from a 3 x 3 moving window formed the input neurons and the corresponding MODIS temperature residual at 960 m of the centre pixel, formed the output neuron for the ANN model.
NL-DisTrad is based on the assumption that, the polynomial relation at the hot edge captured at the scale of 960 m is valid at finer resolutions also. The polynomial fit for the hot edge that was derived at the resolution of 960 m was applied to the MODIS equivalent of AWiFS NDVI. The 3 x 3 moving window of MODIS equivalent NDVI data was used with the calibrated ANN model, which was developed in the previous step, to simulate the corresponding LST residuals that must be added at the finer scale. The simulated residuals from the ANN were added back into the simulated temperatures from the polynomial model. NL- DisTrad was applied to disaggregate LST at 960 m to the scale of 60 m corresponding to the dates 25.12.2011, 19.01.2012, 20.02.2012, 19.03.2012, and 21.03.2012.
3. RESULTS AND DISCUSSION 3.1 Evaluation of disaggregated NDVI
The robustness of the model was assessed by scatter plot comparison between the observed and modeled NDVIs for the major land cover classes. Fig. 4 display the scatter plots of the averaged disaggregated NDVI against the observed MODIS NDVI at 240 m for the land cover classes represented by agriculture and forest.
Figure 4. Scatter Plot comparison between the disaggregated NDVI spatially averaged to 240 m and the concurrent MODIS NDVI at 240 m for a representative date a. Agriculture b.
Forest,
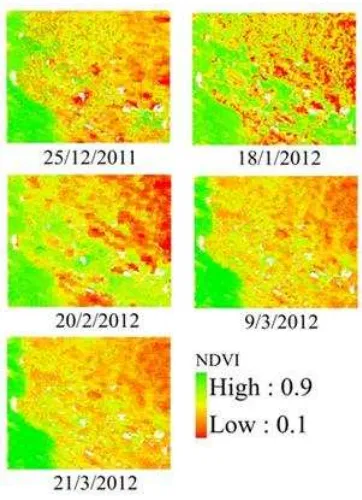
The scatter plots show that the slope of the lines fitted to the MODIS NDVI at 240 m and spatially averaged disaggregated NDVIs did not differ significantly from one, indicating the good predictive ability of the model. The predictive ability of the model was further assessed by a visual comparison of the disaggregated NDVI at 60 m (Fig.5). The disaggregated images show that DisNDVI was able to capture the spatio temporal evolution in NDVI across the growing season. The NDVI images were able to capture the seasonal variation in NDVI with high values of NDVI towards the mid season and low values towards the end of the season. The disaggregated images of NDVI for the season are given in fig. 5.
Figure 5. MODIS NDVI at 240 m disaggregated to 60 m for the season December 2011- March 2012.
The disaggregated images of NDVI at 60 m effectively captured the sub pixel variability which is difficult to detect at the native resolution of 240 m which indicates the robustness of the model.
3.2 Evaluation of disaggregated LST
An initial assessment to evaluate the ability of NL-DisTrad to preserve the statistical properties of the observed Landsat LST (January 19, 2012) data based on the minimum, maximum, mean and standard deviation statistics indicated that for the subset of images chosen for validation, the LST that were derived from NL-DisTrad were able to reproduce the statistical properties. The RMSE value, a measure of the error in model prediction, was low and within 2 K. The NSE, which assesses the capability of the model to predict values far from the mean, was found to be 0.80 for the image subset. The statistical indices provide an assessment of the proposed NL-DisTrad’s predictive ability. Although the statistical analyses provided relevant information about the effectiveness of the model, they were further supplemented by the error histogram of LST that was obtained using the observed Landsat temperature (Fig. 6) The International Archives of the Photogrammetry, Remote Sensing and Spatial Information Sciences, Volume XL-8, 2014
Figure 6. Histogram of residuals plotted for the disaggregated LST corresponding to NL-DisTrad and observed Landsat LST. The error histogram indicated that the majority of the errors reported were within the range of -2 to +2 K. Based on these results, the proposed model can be recommended as a viable alternative for disaggregating coarse resolution LST data.
4. CONCLUSIONS
A novel disaggregation method (DisNDVI and NL-DisTrad) for improving the spatial and temporal resolution of NDVI and LST was developed by blending the satellite data from different sensors of distinct spatial and temporal characteristics (MODIS and LANDSAT/AWiFS). Statistical performance measures indicated that the disaggregation model was able to effectively capture the phenological variation of NDVI as well as the spatio temporal variation in LST at a finer resolution of 60m. The proposed disaggregation methods hold good promise to generate a time series of NDVI and LST for use in the assessment of crop growth and estimation of actual evapotranspiration for effective irrigation water management.
REFERENCES
Agam, N., Kustas, W. P., Anderson, M. C., Li, F., and Colaizzi, P. D., 2007. Utility of thermal sharpening over Texas high plains irrigated fields. Journal of Geophysical Research, 112, D19110, doi:19110.11029/12007JD008407.
Carper, W. J., Lillesand, T. M., and Kiefer, R. W., 1990. The use of intensity-hue-saturation transformations for merging SPOT Panchromatic and Multispectral image data. Photogrammetric Engineering and Remote Sensing, 56, 459 – 467.
Gao, F., Masek, J., Schwaller, M., and Hall, F., 2006. On the blending of the Landsat and MODIS surface reflectance: Predicting daily Landsat surface reflectance. IEEE Transactions on Geoscience and Remote Sensing, 44, 2207−2218.
Hilker, T., Wulder, M. A., Coops, N. C., Linke, J., McDermid, G., and Masek, J., 2009. A new data fusion model for high spatial- and temporal-resolution mapping of forest based on Landsat and MODIS. Remote Sensing of Environment, 113, 1613−1627.
Kustas, W. P., Norman, J. M., and Anderson, M. C., 2003. Estimating sub-pixel surface temperature and energy fluxes from the vegetation index-radiometric temperature relationship. Remote Sensing of Environment, 85(4), 429-440.
Moran, M. S., Peters-Lidard, C. D., Watts, J. M., and McElroy, S. (2004). Estimating soil moisture at the watershed scale with satellite-based radar and land surface models. Canadian Journal of Remote Sensing, 30, 805-826.
Shettigara, V. K. (1992). A generalized component substitution technique for spatial enhancement of multispectral images using a higher resolution data set. Photogrammetric Engineering and Remote Sensing, 58, 561−567.
Yocky, D. A., 1996. Multiresolution wavelet decomposition image merger of Landsat Thematic Mapper and SPOT panchromatic data. Photogrammetric Engineering and Remote Sensing, 62, 1067−1074.
Yang, G., Pu, R., Huang, W., Wang, J., and Zhao, C., 2010. A novel method to estimate subpixel temperature by fusing solar-reflective and thermal-infrared remote-sensing data with an artificial neural network. IEEE Transactions on Geoscience and Remote Sensing, 48, 2170-2178.
Zhu, X. L., Chen, J., Gao, F., Chen, X. H., and Masek, J. G., 2010. An enhanced spatial and temporal adaptive reflectance fusion model for complex heterogeneous regions. Remote Sensing of Environment, 114(11), 2610 – 2623.