IN-SEASON ASSESSMENT OF RABI CROP PROGRESSION AND CONDITION
FROM MULTI SOURCE DATA
B Sahay* ([email protected]), KV Ramana, K Chandrasekar, A Biswal, MVR Sesha Sai, SVCK Rao ASAG, RSAA, National Remote Sensing Centre, Hyderabad 500037, India
KEY WORDS: NDVI, INDVI, NDWI, GDD, Crop Progression, Crop Condition Assessment, Crop Simulation Model
ABSTRACT:
Timely and accurate information on periodic crop progress and condition is essential to an agricultural country like India. The current study has been carried out with the objective of monitoring the timelines of the sowing of rabi crops viz. wheat and mustard, their progression and condition assessment using data from multiple sources viz. a set of indices derived from remote sensing, meteorological parameters and crop simulation modeling. The study area consists of six districts with significant wheat and mustard crops namely Patiala, Bhiwani, Agra, Bharatpur, Morena and Rohtas, and has been done for three years (2008-09, 2012-13 and 2013-14). The methodology consists of analysis of multi-temporal AWiFS and MODIS datasets of historical and current seasons for the period October to March covering rabi season. Crop simulation for wheat was carried out using DSSAT-CERES crop growth model for assessing crop growth. The results were discussed in terms of crop progression, start-of-the-season and crop condition. As a future scope of this study, thermal indices can be incorporated for further refinement and the same can be extended to larger areas.
1. INTRODUCTION
Timely and accurate information on periodic crop progress and development is essential to an agricultural country like India. Currently, no operational mechanism exists for generating periodic crop progress and development reports at district and sub-district levels. However, some surveys are conducted by state and district level agricultural officials at the beginning of sowing period during every season (kharif and rabi), research teams for crop monitoring and trade associations, and such survey-based reports have limitations of subjectivity, lack spatial coverage and are labor-intensive. There has been limited use of remote sensing data in these surveys. In the ongoing FASAL project being carried out by Mahalanobis National Crop Forecast Centre (MNCFC), Ministry of Agriculture, Government of India, only single-time crop statistics are being generated before harvest at district level.
Maps depicting the spatial distribution of crops along with in-season information on the crop condition will be of more significance for crop forecasting as well as for extension services. A pilot study, which has a scope for up-scaling, has been undertaken towards realization of this objective. Wheat and mustard – two of the major rabi crops of the country in terms of their importance and areal extent - have been chosen, covering six districts in the northern India plains.
India ranks second in the principal wheat producing and consuming countries in the world. The importance of wheat in Indian agriculture is second to only rice. In India, wheat is largely grown in contiguous area of north and northwest part during rabi season from October to April. However, the wheat crop taken up after the kharif rice is generally sown late during mid-November and harvested during end of March. The pulses and potato are sown during October and are harvested in early February. Thus, the phenological differences with reference to acquisition period of AWiFS data enable identification and discrimination of major rabi crops viz., wheat, potato, gram etc.
The major states that are involved in the cultivation of wheat are those located in the plains like Uttar Pradesh, Bihar, Punjab and Haryana. The total area under wheat crop is about 29.8 million hectares in the country.
Rapeseed-mustard crops in India are grown in diverse agro climatic conditions ranging from north-eastern/north western hills to down south under irrigated/rain-fed, timely/late sown, saline soils and mixed cropping. Indian mustard accounts for about 75-80% of the 6.8 M ha under these crops in the country during 2012-13 crop season.
2. OBJECTIVE
The main objective of the study is to monitor the crop growing areas of selected crops from sowing to harvesting during the growing season with a set of indicators derived from geospatial analysis of remote sensing and ground data sets and generating information on the crop prospects during the season, in the form of maps. Thus, the spectral and ground information are supplemented to achieve synergy in the overall in-season crop assessment procedure. During the sowing period, the focus is on detecting the progression of crop sowing from time to time and the extent of reduction in sown area. During the growing and maturity periods, emphasis is put on the progression of crop growth compared to normal, extent of anomalies and its impact on crop prospects.
This pilot study envisages development, evaluation and operationalization of an in-season crop prospects monitoring system which will integrate IRS satellite images, model-derived land surface parameters from MODIS, weather data from IMD and process-based crop simulation model. Apart from these, other data sources available with various state and central agencies will be used to monitor the health/in-season crop progress and condition. The system, using geospatial technologies, will produce and disseminate temporal national crop progress maps and associated data, as well as summary reports to support the decision-making process. It will provide overall and specific crop progress for individual crops such as wheat, mustard at district level, to meet different users’ needs.
The specific objectives of the current pilot study are as follows: • Study the progression of rabi sowings
• Monitor the progression and timeliness of wheat and mustard crops
• Study the wheat crop performance using crop simulation model - Decision Support System for Agrotechnology Transfer (DSSAT- CERES)
3. STUDY AREA
Six districts covering the major wheat and mustard growing zones have been selected for the study - Patiala, Punjab; Bhiwani, Haryana; Agra, Uttar Pradesh; Bharatpur, Rajasthan; Morena, Madhya Pradesh and Rohtas, Bihar. The selection is based on the distribution of at least one district in each of the major wheat growing states, contiguous nature of the districts for ease of ground truth collection and optimization of data sets. Patiala and Rohtas districts have very little area under mustard crop, and hence they are being considered as pure wheat areas for this study. In the other four districts, both wheat and mustard crops have been studied.
4. METHODOLOGY
Essentially, the study utilizes multi-temporal AWiFS and MODIS datasets of historical and current seasons, to generate different geo-physical parameters that are of relevance to in-season crop monitoring. Along with these, point-based modeling crop simulation has been carried out using DSSAT-CERES crop growth model for wheat crop. Details are depicted in the form of a flow chart (Figure.1).
Figure.1 Rabi Crop Prospect Mapping – Approach The broad methodology is as follows:
• Use of multi-temporal AWiFS data to classify rabi cropped area for the current season and also for generation of potential crop mask from historical data sets
• Discriminate rabi wheat, mustard and other crops
• Generate NDVI profiles of wheat and mustard for entire growing season
• Extract the NDVI, NDWI, LST from the MODIS data for the crop mask
• Integrate the NDVI over crop season (iNDVI)
• Generate surface temperature from Automatic Weather Station (AWS) data and compute the Growing Degree Days (GDD)
• Assess the crop condition with reference to historical years
• Calibration and validation of DSSAT-CERES crop model for wheat crop in the study areas using weather data from 1998 to 2009
• Simulating wheat growth using the remote sensing derived start-of-season information
4.1 Remote sensing derived indices/parameters
One of the most widely used vegetation indices is the Normalized Difference Vegetation Index (NDVI) whose values range from +1.0 to -1.0. Areas of barren rock, sand, or snow usually show very low NDVI values (0.1 or less). NDVI is especially useful for continental to global-scale vegetation monitoring because it can compensate for changing illumination conditions, surface slope, and viewing angle. NDVI values can be averaged over time to establish ‘normal’ growing conditions in a region for a given time of year. When analyzed through time, NDVI can reveal where vegetation is thriving and where it is under stress, or changes in plants’ phenological stage. The NDVI is defined as (Rouse et al. 1973):
NDVI = λNIR - λRed/ λNIR + λRed (1)
where λNIR = spectral reflectance in near infrared region λRed = spectral reflectance in red region
Integrated Normalized Difference Vegetation Index (iNDVI) offers key remote-sensing-derived information on interactions between vegetation growth, climate and soil conditions. The iNDVI from sowing to harvesting has been computed.
Normalized Difference Water Index (NDWI) uses information from the spectral regions near infrared (NIR) and short wave infrared (SWIR). These spectral regions give information on the condition of the vegetation considering the amount of water present in the vegetation. Absorption by vegetation liquid water in NIR is negligible while weak liquid absorption is present in SWIR. As a result, NDWI is sensitive to changes in liquid water content of vegetation canopies (Gao, 1996). The NDWI is calculated as:
NDWI = λNIR - λSWIR/ λNIR + λSWIR (2)
where λNIR = spectral reflectance in near infrared region λSWIR = spectral reflectance in shortwave infrared region
Land Surface Temperature (LST) is a good indicator of both the energy equilibrium of the Earth’s surface and greenhouse effects, and is also one of the key variables controlling the fundamental biospheric and geospheric interactions between the Earth’s surface and its atmosphere. The MODIS LST products (Land Surface Temperature/Emissivity 8-Day L3 Global 1km MYD11A2) have been used in the current study to assess the start of the crop season. The day and night LST products generated by MODIS have been used to compute the diurnal LST (modis.gsfc.nasa.gov).
4.2 Meteorological parameters
providing an indication of the energy available for plant growth. GDD totals are used for comparing the progress of a growing season to the long-term average and are useful for estimating crop development stages and maturity dates. GDD are calculated by taking the average of the daily maximum and minimum temperatures compared to a base temperature.
GDD = [(Tmax + Tmin)/2] - Tbase (3)
where Tmax = maximum daily temperature Tmin = minimum daily temperature
Tbase= the temperature below which plant growth is zero. For wheat and mustard, it has been taken as 5°C.
4.3 Crop growth model
Process based crop simulation models have been used extensively to evaluate the potential effects of environmental, biological and management changes on crop growth and development (Hoogenboom, 2000). Important model state variables such as above-ground biomass, leaf area index and specific canopy characteristics such as chlorophyll or nitrogen content can be estimated from remote sensing observations and can therefore be used for calibration and validation purposes.
Remote sensing information allows identification of the timing of phenological events such as maximum vegetative phase, flowering and maturity etc. which can be used to adjust simulation models (Dadhwal et al, 2002; Nain et al, 2002). Crop growth simulation models may provide information to support interpretation of remote sensing data. Interpretation of the results of complex, process-based simulation models may on the one hand benefit from remote sensing imagery, and on the other hand, where remote sensing images are missing, model-derived information on soil and crop temporal and spatial variability may prove useful to fill observation gaps. Estimates of the dynamics of soil characteristics such as soil moisture content and crop characteristics (i.e. biomass, leaf area index, canopy structure and chlorophyll contents) can be provided by simulation models. This feature has great potential in filling in missing remote sensing data due to unfavourable climatic conditions such as clouds or due to technical problems. Although remote sensing and crop growth simulation modelling each has proven its usefulness and applicability in various areas, such uses have in principle been separately, and not in combination. An attempt has been made to use remote sensing derived information with crop simulation model to monitor wheat growth in rabi 2013 in the six wheat growing districts. The CSM-CERES-Wheat, a part of Decision Support System for Agrotechnology Transfer (DSSAT) Cropping System Model V4.5 (Hoogenboom et al., 2010), has been used in this study. The model has been documented extensively since its initial development and evaluation (Ritchie and Otter-Nacke, 1985; Ritchie et al., 1998). It simulates the effects of weather, genotype, soil properties and management on wheat growth and development, yield, soil and plant water and nitrogen dynamics. The crop growth model considers phase-wise development with nine growth stages, from pre-sowing to harvest, in relation to thermal time. The model calculates biomass accumulation as the product of radiation use efficiency and photo-synthetically active intercepted radiation. The number of growing leaves is a function of leaf appearance rate (phyllochron interval, degree days) and duration of grain filling. Organ extension depends on potential organ growth and is limited by sub-optimal temperature and water and nitrogen stresses. Partitioning
coefficients of dry biomass in plant parts are influenced by phase-wise development. Grain yield is modeled as a product of grain number, plant population, and grain mass at physiological maturity. Daily soil water balance is modeled in relation to rainfall/irrigation, runoff, infiltration, transpiration and drainage from the soil profile.
Soil input – Layer-wise soil attributes like texture, sand (%), silt (%), clay (%), bulk density (g/ cm3), field capacity (cm3/cm3), permanent wilting point (cm3/cm3), saturated soil water content (cm3/cm3), saturated hydraulic conductivity (cm/h), organic carbon (%), pH and electrical conductivity (dS/m) are required to run the model. The NBSSLUP soil map and secondary information from district database maintained by CRIDA (Central Research Institute for Dry Land Agriculture) and WISE global soil database (Gijsman et al. 2007) have been used for preparing the respective district soil input files.
Weather input - Daily average maximum, minimum temperature (0C), rainfall (mm/day) and solar radiation (MJ/m2) are the prerequisites for running DSSAT CERES model. For model calibration and validation, historical weather data from 1998 to 2013 were used, while for rabi 2013-14, IMD AWS data have been used.
Calibration and validation of CERES-DSSAT - Required weather and soil files were prepared according to DSSAT format and crop simulation was carried out for the six above mentioned districts. Standard management practices were followed to simulate the wheat yield. As district level yield was compared, the simulated yield was averaged over a number of sowing dates and soil conditions. Simulations were iterated taking three sowing dates for each location. The soil condition was also varied in different simulations taking the major soil of the district as the representative one. Thus, the simulated yield was averaged over a district and compared with the observed average yield for the corresponding year.
The growth and development modules of the CERES model use different sets of species, ecotype and cultivar coefficients (P1V, P1D, P5, G1, G2, G3 and PHINT) which define the phenology and crop growth in time domain. The DSSAT-CERES wheat model was calibrated and validated for HD 2329 variety (one of the most popular varieties of the region) from 1998 to 2009. For calibration, the cultivar coefficients were obtained sequentially, starting with the phenological development parameters related to flowering and maturity dates (P1V, P1D, P5 and PHINT) followed by the crop growth parameters related with kernel filling rate and kernel numbers per plant (G1, G2 and G3) (Hunt and Boot, 1998; Hunt et al., 1993). The trial and error method was used to determine genetic coefficients manually for all the six districts (Godwin and Singh, 1998). These parameters were adjusted to minimize root mean square error (RMSE) between simulated and measured data.
5. DATA USED
Data used for the study comprised of satellite data from IRS and MODIS, meteorological data from IMD and ancillary data.
5.1 Satellite Data
5.1.1 IRS Resourcesat-AWiFS
2008-09, historical database from FASAL project was used. The data was subjected to Top-of-Atmosphere (TOA) correction by using the saturation radiance values of the four AWiFS bands along with the sun elevation angle as on the date of pass.
Multi-temporal FCCs and corresponding NDVI images were used as inputs for classification using hierarchical decision rules (NRSA, 2007). Total rabi cropped area was estimated by January end. With the availability of February and March data, the different major crops viz. wheat and mustard could be identified and classified after analysis of the NDVI profiles and date of sowing information. The AWiFS data of the historical years (2008-09 and 2012-13) for the rabi period were also analyzed in the current study.
5.1.2 Terra/Aqua MODIS
The MODIS Terra 16 days Vegetation Index (MOD13Q2) product (http://LPDAAC.usgs.gov) starting from first fortnight of October 2013 was used in the analysis. The layers used from the vegetation index product were NDVI, quality assurance flag for NDVI, reflectance of NIR and SWIR. These products were computed from atmospherically corrected bi-directional surface reflectance that have been masked for water, cloud, heavy aerosols and cloud shadows. NDWI was derived from the NIR and SWIR reflectance.
With reference to the thermal data, MODIS Aqua 8 days LST (MYD11A2) product starting from first fortnight of October 2013 was used in the analysis. For land cover types with variable emissivity, surface temperature is derived from daytime and night time observations in seven MODIS thermal infrared (TIR) bands using a statistical regression approach, a least-squares fit approach, or both. The data were processed to derive the daytime and nighttime LST. In order to analyze with the MOD13A2 16 day NDVI product, the 8 day LST products were averaged to derived 16 day LST product which is co-terminus with the MOD13A2 product. Diurnal LST (DLST) was derived by differencing the daytime and nighttime 16 day LST product. Using the quality assurance flag layer, the cloud contaminated pixels were identified and excluded in both the sets of products.
5.2 Meteorological data
The maximum and minimum temperatures from Automatic Weather Station (AWS) of IMD were used in the study. The weekly averages were generated for the test sites. Since the historical data from AWS is not available, the nearby meteorological observatory data is being used.
In addition, ancillary datasets viz., historical data of crop statistics, crop calendar of the district, soil and land degradation and irrigation infrastructure were also used for analysis.
6. RESULTS
6.1 Crop Progression
Decision tree classifier has been used on temporal AWiFS data for generation of Rabi Cropped Area (RCA) mask. The rabi crop area estimates at the end of January and February 2014 are provided in Table 1. No significant changes could be seen in the RCA compared to previous year.
With February and March data, the wheat and mustard crops could be delineated based on their temporal NDVI profiles.
Table 2 indicates the extent of wheat, mustard and other crops in the six districts.
District
2008-09 2012-13 2013-14 2013 vs.
2014 2013-14 2012-13 2013 vs.
2014
Agra 267402 224448 238556 6% 261116 267061 -2%
Bharatpur 335719 344974 334232 -3% 350332 346711 1%
Bhiwani 163855 108959 193696 78% 317527 320251 -1%
Morena 233163 207208 NA NA 211639 213599 -1%
Patiala 283205 203403 215464 6% 258696 251947 3%
Rohtas 196131 141169 NA NA 200559 213247 -6%
Table 1 Extent of Rabi Cropped Area (in ha)
District Wheat Mustard Other Crops Total
2014 2013 2014 2013 2014 2013 2014 2013
Agra 123628141240 95355 74267 42133 51554 261116 267061
Bharatpur145845117505182379214977 22108 14229 350332 346711 Bhiwani 136535125220154022154911 26970 40120 317527 320251 Morena 120671 49036 83627 158321 7340 6242 211639 213599
Patiala 237099233467 0 0 21597 18480 258696 251947
Rohtas 214587206834 0 0 5432 7709 220019 214543
Table 2 Crop-specific area for rabi season (in ha) It is evident from the table that the sowing progression in Agra, Bharatpur, Morena, Bhiwani and Patiala are comparable to the previous year, varying from -6% to 3%. In Rohtas district, a sharp decrease was seen in the RCA at the end of December when compared to previous rabi season but by the month of February, the normal area has been reported.
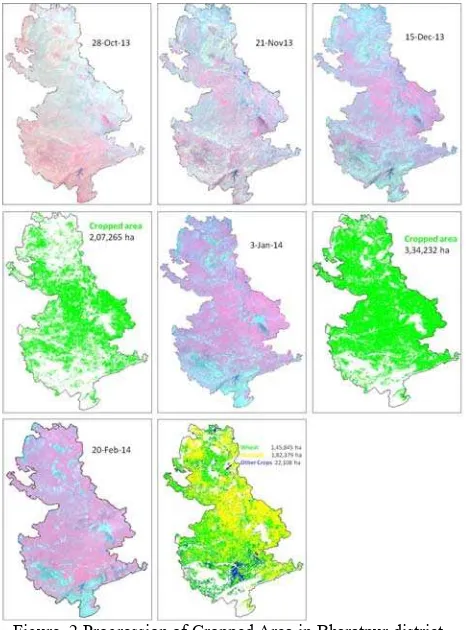
The FCC of AWiFS data for Bharatpur district for the months from October through February, and the corresponding rabi cropped area distribution as well as wheat and mustard crop area extents are seen in Figure 2.
6.2 Start of the Season
Start of the Season (SoS) is a very critical event in the crop phenology. Identification of SoS will help in the management of water, nutrition and pest during the season. To identify the SoS, the first derivative of a water sensitive index called the Normalized Difference Water Index (NDWI) coupled with the diurnal temperature has been used. Figure.3 shows the scaled first derivative of NDWI plotted along with diurnal temperature for wheat and mustard crop for the districts under study.
Figure.3 Start of the Season for wheat crop as identified by 1st derivative of NDWI and DLST
Figure.4 Start of the Season for mustard crop as identified by 1st derivative of NDWI and DLST
The scaled 1st derivative of NDWI greater than 100 coinciding with the highest Diurnal Land Surface Temperature (DLST) during the sowing window is a good indicator of the SoS. Using this criterion, it can be seen from Figure.3 that the SoS for wheat crop was during 2nd fortnight of November in the districts of Patiala, Agra, Morena and Bhiwani. At Bharatpur, it was during 1st fortnight of November and in Rohtas it was during 2nd fortnight of December. In the case of mustard growing districts, the SoS was during 1st fortnight of November in all the four districts of Agra, Bharatpur, Bhiwani and
Morena, as seen in Figure.4. There is no significant mustard crop in the district of Patiala and Rohtas. Comparing the start of the season with the normal year 2008, all the districts had normal SoS except Rohtas which was delayed by a fortnight.
Figure.5 and Figure.6 show the progression of NDWI of wheat and mustard crop during 2013-14 compared with 2008 and 2012 rabi cropping season respectively. The plot of NDWI gives an idea of the current crop moisture status of the crop compared to the normal; whether NDWI is above or below the normal, or is tending to be positive or negative and its the deviation from the normal.
Figure.5 Progression of wheat NDWI for current and historical years
Figure.6 Progression of mustard NDWI for the current and historical years
except in Bhiwani, where mustard crop reached its peak during February, as seen in Figure.6.
6.3 Crop condition assessment
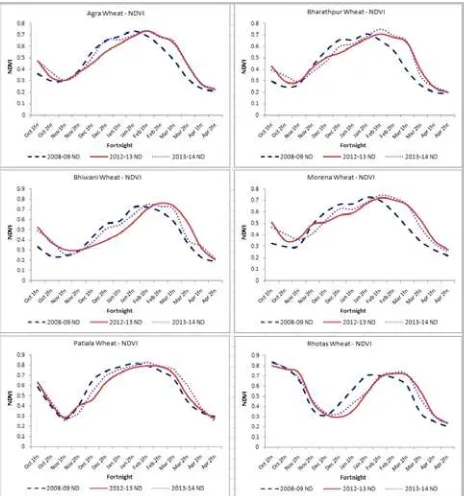
Figure.7 and Figure.8 show the NDVI curve for mustard and wheat crops respectively, compared with 2008 and 2012. Crop condition assessment has been attempted with the progression of NDVI. The relative deviation of the current season NDVI with the normal (2008) and the previous year (2012) up to first fortnight of April 2014 has been considered.
Figure.7 Progression of mustard NDVI for current and historic years
Figure.8 Progression of wheat NDVI for current and historic years
It can be observed that the current years’ NDVI closely followed the 2013 NDVI for most part of the season. For wheat crop, the peak NDVI was attainted during second fortnight of February except in Rohtas. Since the season begins late in Rohtas, its peak NDVI was attainted during March. With respect to the performance of mustard crop, the NDVI closely followed the normal curve indicating normal crop condition in all four districts viz. Agra, Bhiwani, Bharatpur, and Morena.
It can be concluded after studying both the NDVI and NDWI seasonal profiles till April 2nd fortnight that all the districts have a normal agricultural progression and crop condition for both wheat and mustard crop.
Table 3 shows the NDVI integrated over the season (Integrated NDVI or iNDVI) of wheat and mustard crops. In case of wheat crop, the table indicates that Patiala has the maximum potential for high yield, while Rohtas and Bhiwani have the lowest yield potential. In case of mustard crop, Morena has the highest yield potential, followed by Agra, Bharatpur and Bhiwani.
District 2008-09 2012-13 2013-14
Wheat Mustard Wheat Mustard Wheat Mustard
Agra 84.177 94.108 85.828 96.584 86.141 97.472
Bharatpur 79.172 88.749 84.168 96.375 81.537 92.907
Bhiwani 81.813 84.65 81.726 89.839 76.213 81.204
Morena 86.108 91.94 91.251 99.652 88.702 100.722
Patiala 101.202 NA 97.408 NA 102.697 NA
Rohtas 72.473 NA 70.792 NA 68.745 NA
Table 3 iNDVI values for wheat and mustard crops
The GDD was calculated for wheat and mustard crops using IMD AWS data, starting from the beginning of the crop emergence. The values did not show any particular trend. However, for both the crops, Bhiwani showed the lowest values in tune with NDVI and iNDVI. Table 4 shows the cumulative GDD calculated for wheat and mustard crops.
District GDD
Wheat Mustard
Bharatpur 1972 1585
Bhiwani 1538 1520
Agra 2040 1536
Patiala 1654 NA
Rohtas 2258 NA
Morena 2084 1626
Table 4 Cumulative GDD for wheat and mustard
6.4 Wheat growth simulation
The Root Mean Square Error (RMSE) and correlation coefficients r2 values for observed vs. simulated district average wheat yield are presented in Table 5.
District Patiala Bhiwani Rohtas Morena Bharatpur Agra RMSE
(kg/Ha) 283 249 277 204 317 267
r2 0.65 0.61 0.56 0.65 0.64 0.66
Table 5 RMSE and r2 values for observed vs. simulated district average wheat yield
Figure.9 Progression of LAI, Yield and TDM for wheat crop in 2013-14
Maximum LAI was observed in Bhiwani at around 81 days after planting where as minimum LAI was observed in Morena and Agra. In Rohtas, LAI reaches the maximum value about one week before and the duration of the crop is shorter than other districts. Although in Rohtas, grain formation starts a bit earlier than other districts but the yield is significantly low. Maximum yield is observed in Bhiwani followed by Patiala whereas minimum was observed in Rohtas followed by Agra and Morena. TDM also shows a similar trend as of yield.
It is observed that in rabi 2013, simulated wheat LAI and yield were lower than the simulated long term normals in Agra and Morena. In Patiala, the simulated wheat growth for 2013 is at par with the long term average with respect to LAI, TDM and yield. Simulated growth attributes for wheat crop in 2013 at Bharatpur, Rohtas and Bhiwani were found to be better than the long term average values.
7. SUMMARY AND CONCLUSIONS
The temporal AWiFS data has been used for estimating the rabi cropped area. MODIS NDWI and LST were used for establishing the start of the season and the NDVI and NDWI. These parameters from the in-season satellite data along with the historical satellite data and limited field data in the study area districts have been observed towards assessing the in-season progression of the spatial distribution and growth condition of wheat and mustard crops, indicating the scope for up-scaling as well.
Remote sensing derived start-of-season has been used to initialize the point based crop simulation model for rabi wheat. The growth progression in 2013 was compared with the long term averages. Simulated wheat LAI and yield were lower than the simulated long term normals in Agra and Morena. In Patiala, the simulated wheat growth for 2013 is at par with the long term average with respect to LAI, TDM and yield. Simulated growth attributes for wheat crop in 2013 at Bharatpur, Rohtas and Bhiwani were found to be better than the long term average values. Spatialisation of the model and assimilation of remote sensing derived state and driving variables is in progress.
Towards studying crop progression, the rabi cropped area appears to be normal or better than the previous year in Agra, Bharatpur, Morena, Bhiwani and Patiala districts. At Rohtas there was a delay in crop sowing of rabi crop, and hence the manifestation was delayed. The sowings of wheat were normal and comparable with that of previous year (2012-13) in Patiala. In case of Bharatpur, Bhiwani, Morena and Rohtas, there was an increase in wheat cropped area when compared to last year. There was a reduction in Agra compared to last year. However, the crop distribution of mustard was seen to have increased in Agra. In Bharatpur and Morena districts, there was a decrease in Mustard cropped area, while it is same as that of previous year in Bhiwani district.
Start of the season information indicated that the wheat sowings were mostly in the second fortnight of November in Patiala, Agra, Morena and Bhiwani districts, and advanced (first fortnight of November) in Bharatpur and delayed upto 2nd fortnight of December in Rohtas district, Bihar. The sowings of mustard crop were all coinciding with the first fortnight of November in all the four districts of Agra, Bharatpur, Morena and Bhiwani.
The wheat crop condition information inferred from NDVI, iNDVI and NDWI suggests that in Agra, Bhiwani and Patiala districts, the condition is comparable to that of last year and to the best of the historical years (2008). At Bharatpur and Morena, the crop condition is better compared to the historical year (2008). At Rohtas, a delay was observed in wheat sowing. However, subsequently the crop is found to be better than the last year. In case of mustard crop, Agra, Morena and Bharatpur were found to be performing better than previous year as well as the reference year 2008. Only in case of Bhiwani, the senescence appears to be faster than that compared with previous year.
The simulated wheat LAI and yield were lower than the simulated long term normals in Agra and Morena. In Patiala, the simulated wheat growth for 2013 is at par with the long term average with respect to LAI, TDM and yield. Simulated growth attributes for wheat crop in 2013 at Bharatpur, Rohtas and Bhiwani were found to be better than the long term average values.
These finding are in tune with the crop condition assessment from NDVI and iNDVI except for Agra and Morena districts. However, the comparisons were made with one of the good rabi season (2008-09) with the remote sensing inputs while the normals have been compared with the modeled output.
case of mustard crop, the yield prospects appear better than the historical years in the districts of Agra, Morena, and Bharatpur. In Bhiwani, although the senescence appears to have set early when compared with previous year, there is no reduction in the peak NDVI. Hence the yield prospects are good. The improvements in the crop models in terms of spatialization may give better comparison.
8. REFERENCES
Batjes, N.H. 2002. A Homogenized Soil Profile Data Set for Global and Regional Environmental Research (WISE, version 1.1) 2002/01. International Soil Reference and Information Centre, Wageningen, The Netherlands.
Dadhwal, V.K., Sehgal, V.K., Singh, R.P., and Rajak, D.R.,2002. Wheat yield modelling using satellite remote sensing with weather data: Recent Indian experience, Mausam.
Gao, B.C., 1996, (NDWI—a normalized difference water index for remote sensing of vegetation liquid water from space. Remote Sensing of Environment, 58, pp. 257–266.
Gijsman, A.J., P.K. Thornton, and G. Hoogenboom. 2007. Using the WISE database to parameterize soil inputs for crop simulation models. Computers and Electronics in Agriculture 56:85-100.
Hoogenboom, G., J.W. Jones, P.W. Wilkens, C.H. Porter, K.J. Boote, L.A. Hunt, U. Singh, J.L. Lizaso, J.W. White, O. Uryasev, F.S. Royce, R. Ogoshi, A.J. Gijsman, and G.Y. Tsuji. 2009. Decision Support System for Agro-technology Transfer (DSSAT) Version 4.5 [CD-ROM]. University of Hawaii, Honolulu, Hawaii.
Hoogenboom, G. 2000. Contribution of agrometeorology to the simulation of crop production and its application. Agric. Forest Meteorol.103:137–157
Jones, J.W., G. Hoogenboom, C.H. Porter, K.J. Boote, W.D. Batchelor, L.A. Hunt, P.W. Wilkens, U. Singh, A.J. Gijsman, and J.T. Ritchie. 2003. The DSSAT cropping system model. European Journal of Agronomy 18:235-265.
modis.gsfc.nasa.gov/data/dataprod/dataproducts.php?MOD_N UMBER=11
Nain AS, Dadhwal VK and Singh TP. 2002. Real time wheat yield assessment using technology trend and crop simulation model with minimal dataset. Current Science, Vol. 82, No.10, 1255-1258
NRSA, 2007. National Wheat Acreage Estimation – Procedure Document (NRSA/RSGIS-AA/ FASAL/NWPF/TECHMAN/ APRIL-07)
Ritchie, J.T., U. Singh, D.C. Godwin, and W.T. Down. 1998. Ceres growth, development and yield. p. 79–98. In G.Y. Tsuji et al. (ed.) Understanding options for agricultural production. Kluwer Academic, Dordrecht, The Netherlands.
Romero, C.C., G. Hoogenboom, A. Gijsman, G.A. Baigorria, and J. Koo. 2010. Strengthening soil quality databases: A new global soil database for crop and environmental modeling. Environmental Modeling & Software (Submitted).
Rouse, J.W., R.H.Haas, J.A.Schell, and D.W.Deering, 1973: Monitoring vegetation systems in the great plains with ERTS, Third ERTS Symposium, NASA SP-351 I: 309-317.
Wang, J.Y., 1960. A critique of the heat unit approach to plant response studies. Ecology 41, 785-790.