Chapter
221
7
Domestic Work and Employment
in Africa: What Is the Trade-Off for
Women?
Javier Herrera and Constance Torelli
One of the keys to understanding the low labor force participation rate among women and their weaker ties with the labor market is the breakdown of domes-tic work and market-related work by gender. How do inequalities in the distri-bution of domestic work aff ect the type of employment integration (informal) for women and their level of participation (number of hours worked) on the labor market?1 What are the links between inequalities in the distribution of
domestic work time and employment in the informal sector? Th is chapter addresses these questions.
As domestic work is not considered work in offi cial labor force indicators, activity rates are underestimated, especially for women. As defi ned by Inter-national Labour Organization (ILO) standards, the labor force participation rate covers only work associated with the production of goods and services included in the system of national accounts. Domestic work to produce services consumed by the household is not included; an individual in full-time domestic work is therefore considered “inactive.” Th e time spent producing goods for domestic consumption (gathering fi rewood, fetching water, caring for the sick, and performing voluntary community services) is not generally considered to be work either.
Th is chapter focuses on the links between domestic labor and labor mar-ket participation. Th e fi rst section reviews the literature on the distribution of domestic time and market time by gender in developing countries. Th e second section describes the databases in the 10 Sub-Saharan African coun-tries included in the study. Th e third section presents the main stylized facts derived from a number of comparative fi ndings and analyzes the determinants of the allocation of time between domestic activities and market work within the framework of family reproduction. It concludes by briefl y examining the
eff ects of the distribution of domestic work on labor market participation and household incomes. Th e fourth section puts forth hypotheses, describes the econometric models employed to test them, and analyzes the results of the estimates. Th e last section draws conclusions and discusses implications for future research.
To our knowledge, no other study has conducted a comparison of this kind across a large number of Sub-Saharan African countries. Th is study is also the fi rst to link inequalities in the distribution of domestic work time and employ-ment on the labor market (especially the informal sector).
Review of the Literature
Empirical studies of household allocations of time are based on Becker (1965, 1981) and Gronau (1977), who propose a unitary model of the household in which the ratio of each member’s relative productivity to his or her expected wage dictates specialization in domestic or market activities. Th e variables con-sidered are the individuals’ human capital and the opportunity cost of domestic activities (generally measured by proxies such as the number of children, house-hold wealth, and spouse’s level of education).
Most empirical studies examine developed countries and focus on the intra-household division of labor and its link with the determinants of the labor sup-ply (of married women, for example). One of the focal points of this literature is to test the hypothesis of the unitary household, which posits that the cross-eff ect of a balanced increase in income from the wife’s wage on the husband’s labor supply is identical to the eff ect of an increase in the husband’s wage on the wife’s labor supply (see, for example, Browning and others 1994; Alderman and others 1995; Browning and Chiappori 1998; Bourguignon and Chiuri 2005).
Empirical studies reject the “shared or common preferences” hypothesis underlying the unitary model of the household (Ilahi 2000). Quisumbing and Maluccio (2000) show the importance (to varying extents) of women’s bargain-ing power in the allocation of household spendbargain-ing in four developbargain-ing countries (Bangladesh, Ethiopia, Indonesia, and South Africa). But very few studies have looked into intrahousehold time use.
In developing countries, a major feature of the studies based on surveys com-bining time use with labor market participation is the exploration of the links between child labor (domestic and market work) and children’s education (see chapter 12). Th is work has qualifi ed the idea that work and education are two incompatible activities. Canagarajah and Coulombe (1998) do not include the time children spend on domestic work in their econometric estimates (a bivari-ate probit model) of the probability of children working as opposed to studying. As Ilahi (2001) shows in his panel study of Peruvian households, failing to do so
DOMESTIC WORK AND EMPLOYMENT IN AFRICA 223
underestimates the time children, especially girls, spend working. He shows that changes in the household’s level of wealth (ownership of assets), the employ-ment of women, and sickness of a household member have a stronger impact on time spent at school and work for girls than for boys (Ilahi 2001). Ritchie, Lloyd, and Grant (2004) consider the impact of adolescents’ schooling on the gender division of labor in India, Kenya, Pakistan, and South Africa.
A number of authors point out that part of the household production (mainly produced by women) is not counted. Th ey seek to include domestic work in the system of national accounts and to incorporate female participation in domestic production into the measurement of the labor force participation rate in order to accurately measure women’s economic contribution.
Diff erent classifi cations and breakdowns of working time have been pro-posed, but the distinction between work and nonwork remains hazy. For example, Kes and Swaminathan (2006) posit that individuals’ time use can be classifi ed as market and nonmarket work. Nonmarket work covers subsistence production, reproductive work, and volunteer work. Reproductive work com-prises domestic work and care work. Domestic activities include activities such as preparing meals, doing laundry, cleaning, maintaining the household, and providing personal care. Th is misclassifi cation clearly illustrates the confusion over the distinction between work and nonwork: although personal care is an essential activity, like leisure and sleep, none of these activities is defi ned as work for the purpose of national accounts.2
Few empirical household time use studies have been conducted on develop-ing countries. In Sub-Saharan Africa, surveys do not collect enough economic and demographic data for an in-depth analysis of time use by men and women. Kes and Swaminathan (2006) update the review by Brown and Haddad (1995) to summarize the fi ndings of 17 studies on time use by gender. Th ey fi nd that diff erent instruments are used to collect the data (simplifi ed diaries, prelisting of 77 activities classifi ed and not classifi ed as in a system of national accounts, participant observation, seven-day recall, two-day recall, 24-hour diary, and so forth). Sample sizes range from 44 women to 5,938 households and cover diff erent age ranges.
In a move to overcome these shortcomings, the United Nations Develop-ment Programme (UNDP) supported four surveys on time use in Sub-Saharan Africa, in Benin (1998), South Africa (2000), Madagascar (2001), and Mauri-tius (2003). Th e fi ndings are summarized in a report titled Gender, Time Use and Poverty in Sub-Saharan Africa (World Bank 2006). Th is report merely describes the working time included in and excluded from the system of national accounts. Except for gender and country variables, the fi ndings are not broken down by age bracket, level of education, household demographic structure, household poverty status, income level, occupational status, or type of employment.3
Empirical studies agree on three stylized facts:
• Women spend more time working than men in nearly all regions.4
• Th e distribution of tasks is very diff erent for men and women, with women performing virtually all domestic tasks and men specializing in income-earning activities (Ilahi 2000).
• Th ere is very little total specialization. Fafchamps and Quisumbing (2003) show that less than 2 percent of people in Pakistan perform all the domestic work in their household and less than 8 percent perform no work at all.
Description of the Data
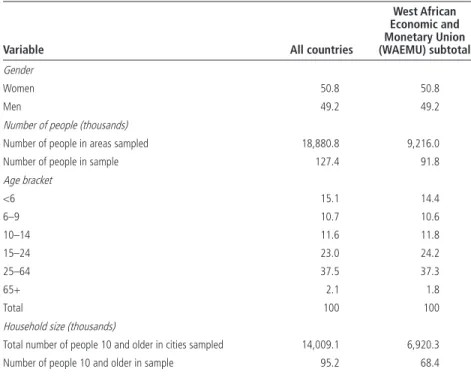
Th e data used in this chapter combine samples from 1-2-3 surveys conducted in seven West African Economic and Monetary Union (WAEMU) capitals; Antananarivo, Madagascar; Kinshasa, Democratic Republic of Congo; Douala and Yaoundé, Cameroon (for a description of these surveys, see box O.1 in the overview).5 Th e sample covers 95,220 individuals 10 and older, including 68,428
in WAEMU cities (table 7.1). Th e 1-2-3 surveys share the same methodological
Table 7.1 Sample Characteristics and Descriptive Statistics (percentage of total, except where indicated otherwise)
Variable All countries
West African Economic and Monetary Union (WAEMU) subtotal Gender Women 50.8 50.8 Men 49.2 49.2
Number of people (thousands)
Number of people in areas sampled 18,880.8 9,216.0 Number of people in sample 127.4 91.8
Age bracket <6 15.1 14.4 6–9 10.7 10.6 10–14 11.6 11.8 15–24 23.0 24.2 25–64 37.5 37.3 65+ 2.1 1.8 Total 100 100
Household size (thousands)
Total number of people 10 and older in cities sampled 14,009.1 6,920.3 Number of people 10 and older in sample 95.2 68.4
DOMESTIC WORK AND EMPLOYMENT IN AFRICA 225
Household type
One person 12.4 14.4
Couple without children 4.3 4.4
Couple with children 32.6 27.5
Nuclear single parent 8.4 7.9
Extended single parent 9.9 10.7
Extended household 32.4 35.1
Total 100 100
Number of households (thousands)
Number of households in cities sampled 3,635 1,770 Number of households in sample 25.5 17.8 Percentage of households headed by a woman 20.5 20.5
Average household size 5.1 5.1
Relation to head of household
Head of household 19.3 19.2
Spouse 12.4 12.3
Child 47.5 45.3
Father/mother 0.6 0.5
Other relative 18.5 19.9
Other unrelated member 1.1 1.7
Servant 0.6 1.1
Institutional sector
Administration 8.3 6.7
Public enterprise 2.6 1.8
Formal private sector 16.4 14.1
Informal sector 71.0 76.2
Association, nongovernmental organization 1.7 1.2
Religion Muslim 28.7 58.7 Catholic 32.4 24.4 Protestant 16.8 5.0 None 2.7 3.6 Other 19.4 8.3
Number of years of education (people 10 and older)
Women 6.3 4.3
Men 7.8 6.3
All 7.0 5.3
Sources: Based on Phase 1 of the 1-2-3 surveys of selected countries in the West African Economic and Monetary Union (WAEMU) conducted in 2001/02 by the Observatoire économique et statistique d’Afrique Subsaharienne (AFRISTAT); Développement, Institutions et Mondialisation (DIAL); and national statistics institutes.
Table 7.1 (continued)
Variable All countries
West African Economic and Monetary Union (WAEMU) subtotal
approach to their measurement of working weeks for people 10 and older in the 11 cities. Th is means that the harmonized data taken from these surveys can be used to conduct the fi rst ever rigorously comparable assessment.
Household members were asked to recall the time spent on each activity over the reference period. Th e information obtained is not as accurate as the infor-mation obtained from journals fi lled in by household members. Th is method was used because it is less expensive and because the one-week period has the advantage of covering activities that are not daily, which prevents underestima-tion of their weight.
Six types of activities are defi ned: • Studying
• Unpaid domestic work in own house and caring for children, the elderly, and the sick
• Fetching water or wood and going to the market • Building own house
• Performing voluntary community services
• Spending time in employment (in main and second job).
Time spent on leisure, family time, and sleeping was not collected directly but can be estimated residually (table 7.2). Th e sample covers urban households only; it thus largely avoids seasonality issues.
Th e other recurring problem with empirical studies on time use is that the sum of the time spent on diff erent activities is sometimes greater than the maximum number of hours available in a day (because two activities, such as caring for children and performing domestic tasks and even market activities, can be per-formed simultaneously). In our sample, this risk is limited (albeit not eliminated) because caring for children, the elderly, and the sick is grouped with domestic activities. In order to correct for the overestimation of time spent on diff erent activities and hence deal with the double counting problem, we placed a ceiling on the maximum time individuals could spend on activities, so that the sum of weekly activity time does not exceed 112 hours ([24–8] * 7). When the total time individuals reported spending on diff erent activities exceeded the maximum, we applied a correction factor (total time/112) to each of the components, so that the sum does not exceed 112 hours.6
Stylized Facts on Time Use by Gender
We fi rst look at the breakdown of working time spent producing domestic goods and services, in order to examine the links between the distribution of
227
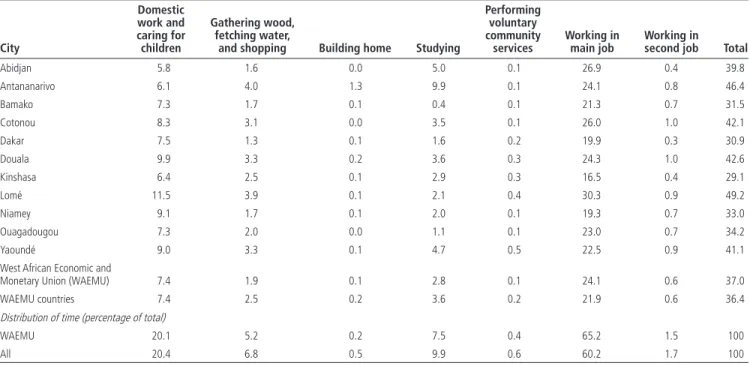
Table 7.2 Allocation of Time in 11 Cities in Sub-Saharan Africa, by Type of Activity (weekly hours, except where otherwise indicated)
City Domestic work and caring for children Gathering wood, fetching water,
and shopping Building home Studying
Performing voluntary community services Working in main job Working in second job Total
Abidjan 5.8 1.6 0.0 5.0 0.1 26.9 0.4 39.8 Antananarivo 6.1 4.0 1.3 9.9 0.1 24.1 0.8 46.4 Bamako 7.3 1.7 0.1 0.4 0.1 21.3 0.7 31.5 Cotonou 8.3 3.1 0.0 3.5 0.1 26.0 1.0 42.1 Dakar 7.5 1.3 0.1 1.6 0.2 19.9 0.3 30.9 Douala 9.9 3.3 0.2 3.6 0.3 24.3 1.0 42.6 Kinshasa 6.4 2.5 0.1 2.9 0.3 16.5 0.4 29.1 Lomé 11.5 3.9 0.1 2.1 0.4 30.3 0.9 49.2 Niamey 9.1 1.7 0.1 2.0 0.1 19.3 0.7 33.0 Ouagadougou 7.3 2.0 0.0 1.1 0.1 23.0 0.7 34.2 Yaoundé 9.0 3.3 0.1 4.7 0.5 22.5 0.9 41.1
West African Economic and
Monetary Union (WAEMU) 7.4 1.9 0.1 2.8 0.1 24.1 0.6 37.0
WAEMU countries 7.4 2.5 0.2 3.6 0.2 21.9 0.6 36.4
Distribution of time (percentage of total)
WAEMU 20.1 5.2 0.2 7.5 0.4 65.2 1.5 100
All 20.4 6.8 0.5 9.9 0.6 60.2 1.7 100
domestic and market time and the female labor market participation rate and defi ne the relative weight of the activities not counted by the national accounts. We then focus on the extent and determinants of intrahousehold inequalities, an aspect rarely studied in the developing countries.
Time Spent on Domestic and Market Work
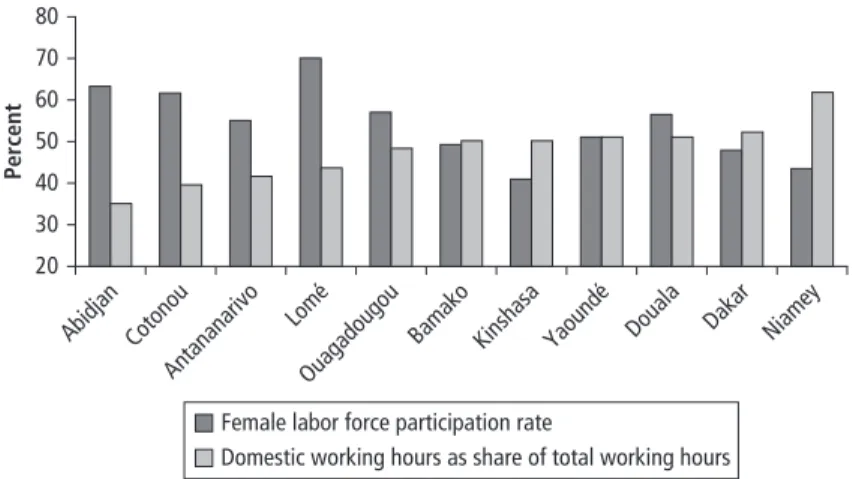
One of the keys to understanding low female labor force participation rates and the marginal nature of female employment on the labor market (mainly in the informal sector) is the allocation of time between domestic and market work. Th e more women are taken up with domestic tasks, the less time they spend on the labor market (fi gure 7.1). Th is notion suggests that a trade-off exists between domestic and market-based work. A diff erent picture emerges from examination of the cities individually.
Time Spent on Domestic Work as a Percentage of Total Working Time
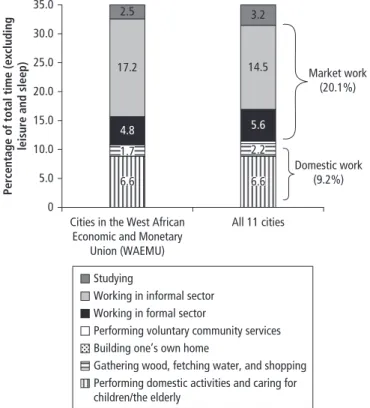
Across all 11 cities, nearly one-third (31 percent) of total working time is spent performing domestic activities not included in national accounts (28 percent for WAEMU cities) (fi gure 7.2). Offi cial per capita gross domestic product (GDP) fi gures therefore underestimate the real standard of living. It is impossible to quantify the amount by which GDP is underestimated without assigning a monetary value to the time spent on domestic work. Imputing such a value is diffi cult, however, because there is little if any market for household services in
Figure 7.1 Female Labor Force Participation Rate and Share of Working Time Spent on Domestic Activities in 11 Cities in Sub-Saharan Africa
Sources: Based on Phase 1 of the 1-2-3 surveys of selected countries (see table 7.1 for details).
Percent 80 70 60 50 40 30 20 Abidjan Cotonou Antananarivo Lomé Ouagadougou
Bamako Kinshasa Yaoundé Douala Dakar Niamey
Domestic working hours as share of total working hours Female labor force participation rate
DOMESTIC WORK AND EMPLOYMENT IN AFRICA 229
Sub-Saharan Africa. However, given that productivity for domestic production tasks is probably lower than it is for market-based work, GDP cannot be under-estimated by more than 30 percent.
Working in the formal sector (oft en the only working time visible to labor market statistics) accounts for just one-quarter of “market-based” work in both the WAEMU cities and all 11 cities in the sample (the other three-quarters is in the informal sector).7 On average, more time is spent on domestic
activi-ties than on production-related activiactivi-ties in the formal sector. Th e time-use survey approach provides another way of assessing the extent to which activi-ties outside the formal sector are excluded from both GDP and labor market indicators.
Th e populations studied spend nearly 70 percent of their time on leisure, sleep, studying, and other activities counted as nonwork. In the WAEMU cit-ies, the time spent studying (2.5 percent) is below the average for all 11 cities (Antananarivo, 7.9 percent; Yaoundé, 4.2 percent; Douala, 3.3 percent). Figure 7.2 Allocation of Time in 11 Cities in Sub-Saharan Africa
Sources: Based on Phase 1 of the 1-2-3 surveys of selected countries (see table 7.1 for details). Cities in the West African
Economic and Monetary Union (WAEMU)
All 11 cities
Percentage of total time (excluding
leisure and sleep)
35.0 30.0 25.0 20.0 15.0 10.0 5.0 0 Market work (20.1%) Domestic work (9.2%) 3.2 14.5 5.6 2.2 6.6 2.5 17.2 4.8 1.7 6.6
Working in informal sector Studying
Working in formal sector
Performing voluntary community services Building one’s own home
Gathering wood, fetching water, and shopping Performing domestic activities and caring for children/the elderly
Cross-Country Diff erences
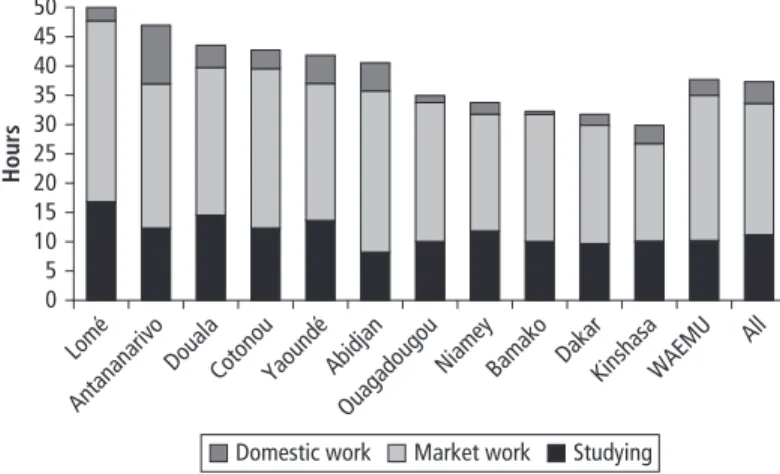
Th e cities display sharp variations around an average working week of 34.2 hours within WAEMU and 32.8 hours for all 11 cities considered. In the capitals of Benin, Côte d’Ivoire, and Togo; Cameroon’s two main cities; and Madagas-car’s capital, people spend more time working (domestic or market-based) than do people in the capitals of Burkina Faso, the Democratic Republic of Congo, Mali, Niger, and Senegal (fi gure 7.3).
One explanation for the diff erences in time allocation across cities could be diff erences in demographic structures and household types. Extended house-holds, polygamy, and the prevalence of child labor may all have an impact on the observed heterogeneity in working hours across countries.
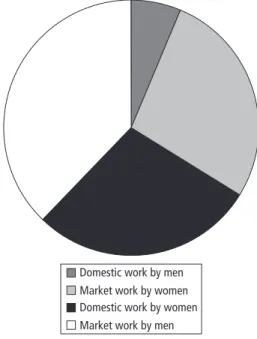
For the sample as a whole, women account for 56 percent of the household’s total working time (fi gure 7.4). Domestic working time is more unevenly spread by gender than market-based work. Women perform 82 percent of domestic work in the household. Th ey also account for 42 percent of the household’s market-based working time.
In every city considered, women account for more than half of the house-hold’s working time, but there are large diff erences across countries. Gender dif-ferences are greatest in Cotonou and Lomé, where the rates of female specializa-tion in domestic activities are lowest. Gender inequalities occur not principally because women specialize in domestic work but rather because they perform both domestic and market work (fi gure 7.5).
Figure 7.3 Time Spent on Domestic Work, Market Work, and Studying in 11 Cities in Sub-Saharan Africa
Sources: Based on Phase 1 of the 1-2-3 surveys of selected countries (see table 7.1 for details).
Note: WAEMU = West African Economic and Monetary Union. 5 0 10 15 20 25 30 35 40 45 50 Hours Lom é Antananarivo DoualaCotonouYaound é Abidjan Ouagadougou
NiameyBamako DakarKinshasaWAEMU All
Market work
DOMESTIC WORK AND EMPLOYMENT IN AFRICA 231
Figure 7.4 Division of Labor within Households by Gender in 11 Cities in Sub-Saharan Africa
Sources: Based on Phase 1 of the 1-2-3 surveys of selected countries (see table 7.1 for details). Domestic work by men
Domestic work by women Market work by men Market work by women
Figure 7.5 Percentage of Total Working Time Men and Women in 11 Cities in Sub-Saharan Africa Spend Performing Domestic and Market Work
Sources: Based on Phase 1 of the 1-2-3 surveys of selected countries (see table 7.1 for details).
Percentage of total working time
Antananarivo Kinshasa Douala Yaoundé Lomé Dakar Niamey Bamako Abidjan Ouagadougou Cotonou 0 10 20 30 40 50 60 70 80 90 100
Domestic work by men Market work by women
Market work by men Domestic work by women
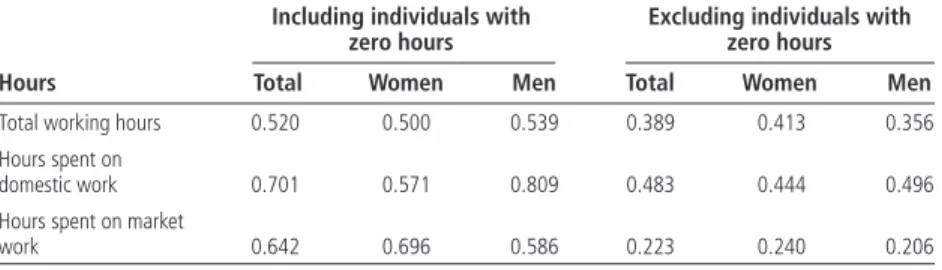
Given the small contribution to domestic work by men and the sizable participation of women in market work, it comes as no surprise to fi nd that inequalities (measured by the Gini coeffi cient) are greater in domestic work than in market work, although both are signifi cant (table 7.3). Th is result holds when individuals who do not take part in domestic tasks or market tasks are excluded. However, the inequalities are sharper for women in the distribution of market work and for men in the distribution of domestic work. Inequalities in the breakdown of domestic working time are largest for both men and women when zero values are excluded. When we decompose the Th eil inequality index, intragroup (male/female) inequalities account for virtually all the inequalities in the distribution of working time (88.7 percent for domestic work, 98.3 percent for market work, and 99.9 percent for total working time).
Women’s Double Days
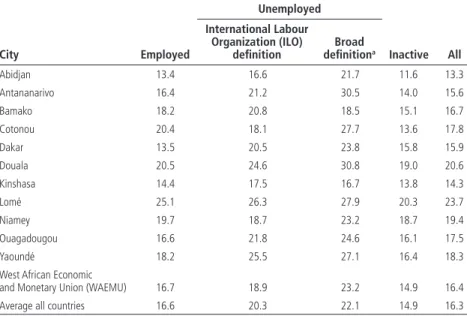
Th e data in table 7.4 bluntly refute the notion that inequality in domestic work refl ects specialization, in which women who participate in the labor market spe-cialize solely in market work, leaving the domestic workload to women defi ned by the International Labour Organization as economically inactive. Women employed in the labor market spend an average of 16.6 hours a week on domes-tic tasks, compared with 14.9 hours for women out of the labor force (11 percent more time). Th is domestic working time is in addition to their market work-ing time. Many African women thus work a double day. Th eir involvement in domestic work does not appear to be an obstacle to their participation in the labor market.
Th ese average fi gures mask cross-county diff erences. Th e double day is a signifi cant phenomenon in the capitals of Benin, Côte d’Ivoire, Mali, Mada-gascar, and Togo; the time working women spend on domestic tasks does not diff er greatly among women out of the labor force in the other African capitals in our sample.
Table 7.3 Gini Coefficients for Differences in Working Time by Men and Women in 11 Cities in Sub-Saharan Africa
Hours
Including individuals with zero hours
Excluding individuals with zero hours
Total Women Men Total Women Men
Total working hours 0.520 0.500 0.539 0.389 0.413 0.356 Hours spent on
domestic work 0.701 0.571 0.809 0.483 0.444 0.496 Hours spent on market
work 0.642 0.696 0.586 0.223 0.240 0.206
Sources: Based on Phase 1 of the 1-2-3 surveys of selected countries (see table 7.1 for details).
DOMESTIC WORK AND EMPLOYMENT IN AFRICA 233
Table 7.4 Employment, Unemployment, and Inactivity of Women in 11 Cities in Sub-Saharan Africa, according to Different Definitions
(weekly hours) City Employed Unemployed Inactive All International Labour Organization (ILO) defi nition Broad defi nitiona Abidjan 13.4 16.6 21.7 11.6 13.3 Antananarivo 16.4 21.2 30.5 14.0 15.6 Bamako 18.2 20.8 18.5 15.1 16.7 Cotonou 20.4 18.1 27.7 13.6 17.8 Dakar 13.5 20.5 23.8 15.8 15.9 Douala 20.5 24.6 30.8 19.0 20.6 Kinshasa 14.4 17.5 16.7 13.8 14.3 Lomé 25.1 26.3 27.9 20.3 23.7 Niamey 19.7 18.7 23.2 18.7 19.4 Ouagadougou 16.6 21.8 24.6 16.1 17.5 Yaoundé 18.2 25.5 27.1 16.4 18.3
West African Economic
and Monetary Union (WAEMU) 16.7 18.9 23.2 14.9 16.4 Average all countries 16.6 20.3 22.1 14.9 16.3
Sources: Based on Phase 1 of the 1-2-3 surveys of selected countries (see table 7.1 for details).
a. Includes workers defined by the International Labour Organization (ILO) as unemployed and discouraged.
Th is observation comes with two reservations. First, unemployed women spend more time than working women on domestic work (3.7 hours more a week using the ILO defi nition of unemployment, 5.5 hours more using a broader defi nition of unemployment). Th e gap in time devoted to domes-tic activities between inactive and active women narrows when unemployed women (broadly defi ned) are included (17.5 versus 14.9 hours per week).
Second, the diff erences between employed and economically inactive females occur mainly because of large diff erences among girls 10–14: girls 10–14 who work devote very little time (1.5 hours a week) compared with economically inactive girls the same age (8.5 hours a week). In fact, working girls perform more domestic work (16.1 hours) a week than girls who are not in the labor force (9.4 hours). Th e diff erences are insignifi cant among women 15 and older (0.3 hours). All in all, however, working women work fi ve hours more on average (market and domestic working time) than their male counterparts.
Th e explanatory models of Becker and Gronau focus on economic factors (the opportunity cost associated with diff erent human capital endowments). Another approach concentrates on the importance of social standards. In this
approach, the household is seen as a unit in which members share the same preferences or as a group led by a “benevolent dictator” (Ilahi 2000).
Many authors have pointed to the importance of social standards and roles, overlooked by the Becker-Gronau approach. Women, they suggest, specialize in domestic activities and men in market activities because of culturally deter-mined social standards and roles rather than economic factors. Th ese social standards depend on religion, ethnicity, position in the household hierarchy, and other factors. For example, in their study on Pakistan, Fafchamps and Quisumbing (2003) highlight the importance of the position in the household hierarchy. Th ey fi nd that the wife accounts for the bulk of domestic work and that daughters-in-law take on a heavier load in the domestic activities than the daughters of the head of household. If social standards predominate, diff erences in human capital may have a minor eff ect on the gender-based division of labor.
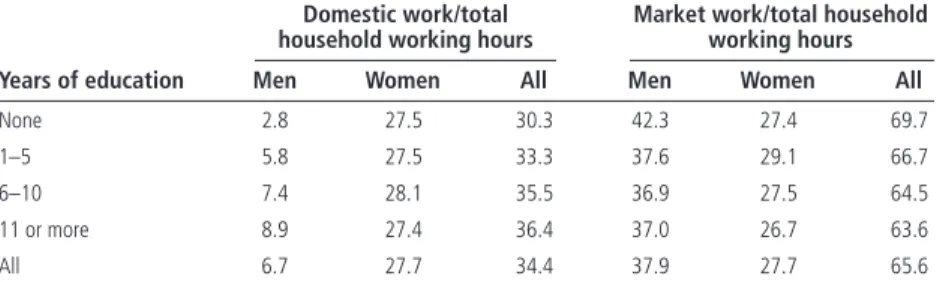
A higher level of education is associated with a larger male contribution to domestic work (table 7.5). Women’s contribution, however, remains virtually the same for both domestic tasks and market work regardless of their level of education. Th is fi nding tends to support the hypothesis of the minor role played by economic factors in the gender-based division of labor between market and domestic work.
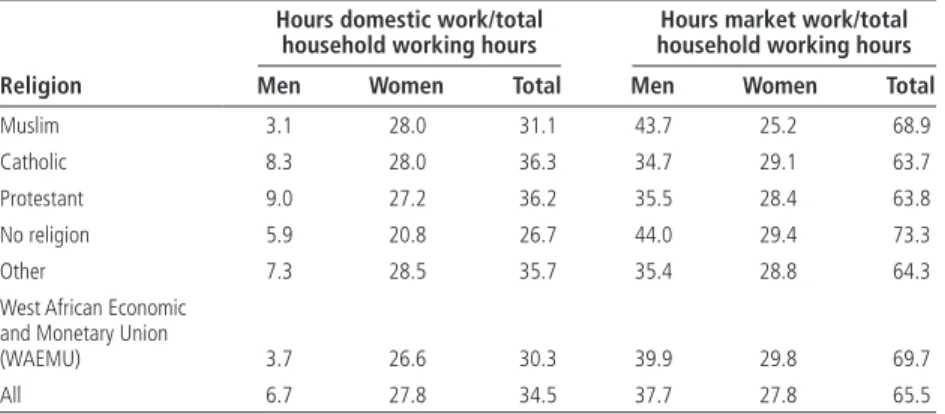
One of the distinguishing factors in the cities in the sample is the pre-dominance of Islam in some and Christianity in others. Religion aff ects the demographic composition of households; in some countries, it dictates a more traditional role for women. Islam is associated with greater task specializa-tion by gender (table 7.6). Th e proportion of hours devoted to market work is slightly lower for Muslim women; much larger inequalities are found in the tiny contribution made by Muslim men to domestic activities, an area “reserved” for Muslim women.
Table 7.5 Weekly Hours Men and Women in 11 Cities in Sub-Saharan Africa Spend Performing Domestic and Market Work, by Level of Education
(percent)
Years of education
Domestic work/total household working hours
Market work/total household working hours
Men Women All Men Women All
None 2.8 27.5 30.3 42.3 27.4 69.7
1–5 5.8 27.5 33.3 37.6 29.1 66.7
6–10 7.4 28.1 35.5 36.9 27.5 64.5
11 or more 8.9 27.4 36.4 37.0 26.7 63.6
All 6.7 27.7 34.4 37.9 27.7 65.6
DOMESTIC WORK AND EMPLOYMENT IN AFRICA 235
Social standards are also expressed through the roles assigned to individuals at diff erent stages in their lives. School-age (10–14) children concentrate mainly on their studies, while providing considerable assistance with domestic tasks and working in the labor market. Th e gender-based division of labor is forged from a very young age: girls spend twice as much time on domestic activities as boys. Although the domestic work time curve is relatively fl at for men over their life cycle (it dips slightly when they marry, before stabilizing), it takes the form of a bell curve for women, reaching its peak in the 26–35 age bracket before gradually falling off as the household grows and children are able to contribute (fi gure 7.6).
Th e market work curve is more concave for men than for women. Gender diff erences start to widen in adolescence, reaching their peak in adulthood, the most productive period (36–45). Women withdraw more gradually from work-ing life than men. Entry into the labor market is problematic for young people (16–25), judging from the small number of hours of market work. Schooling beyond secondary education accounts for only a smart part of the low level of market work (the average number of years of education for this age bracket is just eight for all 11 cities and six for the WAEMU cities).
Two factors are probably at work here, in diff erent proportions for men and women. Men suff er from a lack of wage employment opportunities because of the low level of private and public sector recruitment and their low skill levels. Women are held back by domestic tasks, related in part to the presence of young children, who are cared for exclusively by women in the household. Table 7.6 Weekly Hours Men and Women in 11 Cities in Sub-Saharan Africa Spend
Performing Domestic and Market Work, by Religion (percent)
Religion
Hours domestic work/total household working hours
Hours market work/total household working hours
Men Women Total Men Women Total
Muslim 3.1 28.0 31.1 43.7 25.2 68.9
Catholic 8.3 28.0 36.3 34.7 29.1 63.7
Protestant 9.0 27.2 36.2 35.5 28.4 63.8
No religion 5.9 20.8 26.7 44.0 29.4 73.3
Other 7.3 28.5 35.7 35.4 28.8 64.3
West African Economic and Monetary Union
(WAEMU) 3.7 26.6 30.3 39.9 29.8 69.7
All 6.7 27.8 34.5 37.7 27.8 65.5
When domestic working time is added to market working time, the inequali-ties narrow for the population over 25. Th ese fi gures indicate that women work more than men at all ages.
Th e position in the household plays a minor role in women’s specializa-tion in domestic activities (fi gure 7.7). Female heads of household, wives, and daughters all spend more of their working time on domestic activities than their male counterparts. Household position comes into play for women only marginally, in the breakdown of domestic and market working time. Other rela-tives, who are more specialized in domestic work, make signifi cant contribu-tions to the household’s market and domestic work. Th is category may include disguised forms of forced labor, such as foster children acting as servants for the households.
Table 7.7 sums up the diff erences found in the female participation rate; women’s contribution to total working time; and their contribution to house-hold income, with and without the inclusion of domestic work. Th e fi rst two Figure 7.6 Average Weekly Hours Worked by Men and Women in 11 Cities in Sub-Saharan Africa, by Age
Sources: Based on Phase 1 of the 1-2-3 surveys of selected countries (see table 7.1 for details).
a. Domestic work b. Market work
Age range 0 5 10 15 20 25 0 10 20 30 40 50 10–15 16–25 26–35 36–45 46–55 56–65 66
and over Age range
10–15 16–25 26–35 36–45 46–55 56–65 66 and over
Age range
10–15 16–25 26–35 36–45 46–55 56–65 66 and over
c. Domestic and market work
0 10 20 30 40 50 60 Women Men
Average weekly hours worked
Average weekly hours worked
DOMESTIC WORK AND EMPLOYMENT IN AFRICA 237
Figure 7.7 Household Position and Division of Time between Domestic and Market Work in 11 Cities in Sub-Saharan Africa
Sources: Based on Phase 1 of the 1-2-3 surveys of selected countries (see table 7.1 for details). 100 90 80 70 60 Percent 50 40 30 20 10 0
Head of household Spouse Son/daughter Father/mother, other relatives Domestic work by women Market work by women
Domestic work by men Market work by men
indicators were built using data collected in the 1-2-3 surveys; values had to be imputed for the contribution of domestic work to household incomes. Given the absence of markets for goods and services to substitute for domestic work, we imputed the equivalent of each country’s minimum hourly wage for domestic work.
If account were taken of hours worked producing domestic goods and ser-vices, the female labor force participation rate would increase 70 percent (from 52 percent to 88 percent) on average, and the wide disparities in female par-ticipation rates across cities would narrow considerably. Female parpar-ticipation would be higher than male participation in all 11 cities (13 percent higher in WAEMU cities and 11 percent higher across the full sample). Th is fi nding holds when considering women’s contribution to total working time. Inclu-sion of domestic working time in total household working time reveals the predominant contribution of women to working hours in the African cities in the sample.
If total income from the main and second job alone is considered, women account for 28 percent of total household income. Imputing a wage for domes-tic work (based on the minimum hourly wage) raises women’s contribution to 38 percent. Looking at absolute amounts, the potential income from domestic activity is greater than the income from market activity in all WAEMU coun-tries but not in Cameroon and Madagascar.
Model and Econometric Estimation of Determinants of
Allocation of Time
Th is section examines the breakdown of time spent on domestic and market work. We postulate that the division of labor within the household (domestic work versus market work) is determined more by social standards than economic factors. Economic factors related to human capital play a marginal role because of the very low level of formal education and lack of formal job opportunities.
We adopt the approach proposed by Hersch and Stratton (1994) in their study of working couples in the United States, used by Anxo, Flood, and Koco-glu (2002) in their comparative study of couples in France and Sweden. One important diff erence between our analysis and these studies is that we focus on the gender-based division of labor of all household members, not just adults, as children in developing countries perform domestic work and sometimes par-ticipate in the labor market. Th e prevalence of extended families (42 percent of households in our sample) and the existence of polygamy (3 percent of house-holds) also justifi es considering all members 10 and older in the analysis.8
Table 7.7 Women’s Economic Contribution to Economic Activity in 11 Cities in Sub-Saharan Africa
(percent)
City
Labor force participation rate
Total working time
of household Household income
Without domestic work With domestic work Without domestic work With domestic work Without domestic work With domestic work Abidjan 62.1 84.4 43.7 53.7 26.7 35.2 Antananarivo 54.5 94.6 44.2 52.3 35.9 41.9 Bamako 49.0 79.7 35.2 51.7 23.0 34.1 Cotonou 61.1 89.4 51.0 59.8 30.9 42.9 Dakar 48.0 82.8 35.5 52.7 26.9 42.6 Douala 57.6 96.2 37.2 49.5 26.7 34.7 Kinshasa 41.0 86.5 43.1 55.9 33.1 45.3 Lomé 69.1 95.3 49.8 59.3 32.1 43.2 Niamey 43.7 83.2 30.1 51.6 22.5 38.1 Ouagadougou 57.2 84.6 37.6 52.8 25.7 42.1 Yaoundé 51.2 95.7 37.2 49.0 30.6 37.1
West African Economic and Monetary Union
(WAEMU) 56.4 84.9 41.5 54.4 26.7 38.2
All 51.5 88.0 41.2 53.5 27.9 38.1
DOMESTIC WORK AND EMPLOYMENT IN AFRICA 239
Th e dependent variable in the fi rst equation is women’s relative contribu-tion to domestic (market) work. Th e dependent variable in the next two equa-tions is total working time for men and working time for women in domestic (market) activities. Th e values of the dependent variables (relative male/female share and weekly working hours in domestic and market work) are left censored and range from 0 to 100 percent and 0 to 113 hours (leisure time is estimated residually). Hence the ordinary least squares (OLS) procedure produces biased results.9
A more suitable approach would therefore appear to be left - and right-cen-sored Tobit estimates. Th e Tobit model assumes that the same variables deter-mine both the probability of an observation being censored and the values of the noncensored observations. Moreover, the marginal eff ect of a variable is constrained to the same sign for both types of observations. Given that indi-viduals with a zero value present particular characteristics (their nonparticipa-tion is not random), the estimated coeffi cients present biases, even when taking account of the censored values.
Heckman’s model (“Heckit”) relaxes these assumptions by taking account of the possible selection bias (estimating the probability of observing a value diff erent from zero) and the determinants of values above zero. In the model estimated below, the number of young children in the household is negative correlated with participation in market activities (and positively correlated with hours of domestic work); it is not necessarily correlated with the number of hours of market work. Th e merits of the Heckit model can be appreciated from the value of the Mills ratio coeffi cient. A value statistically diff erent from zero indicates the presence of a selection bias that invalidates the Tobit estimation.
Th ree equations are estimated for each work aspect (domestic and market based). In the fi rst equation, the dependent variable is the relative contribu-tion of each woman (man) to domestic work. Th e other two equations seek to identify the determinants of domestic (market) working time separately for men and women. Th e fi rst equation hence explains the gender-based division of labor; the other two equations are required to interpret how this division varies depending on the characteristics of individuals and their households. For example, an increase in the contribution to domestic work by the most educated men could refl ect a decrease in absolute time spent on domestic work by edu-cated women, without an increase in total domestic working time.
Table 7.8 reports the marginal eff ects estimated using the Tobit model. Although the residual normality and heteroskedasticity tests reject the residual normality hypothesis, and the Mills ratio coeffi cients are signifi cant in most cases, our comments concern only the results of the Tobit model, because of problems encountered with the specifi cation of the selection equation and implausible estimated coeffi cient values. Th ese results should therefore be seen as initial estimations only.
Variable women’s domestic working hours/total household domestic working hours (1) Women’s domestic working hours (2) Men’s domestic working hours (3) working hours/ total household market working hours (4) Women’s market working hours (5) Men’s market working hours (6) Age (reference = 26–45) 10–15 –3.92*** –3.27*** 1.17*** –21.48*** –19.44*** –28.71*** 16–25 6.24*** 0.78*** 0.94*** –9.16*** –7.71*** –9.01*** 46–55 –10.06*** –2.41*** –0.28*** –0.79** –0.35 –2.56*** 56+ –19.33*** –7.12*** –0.11 –12.44*** –9.63*** –18.88***
Relation to head of household (reference = head of household)
Spouse 6.43*** 3.37*** 1.86*** –11.41*** –1.99*** –3.39*
Son or daughter –17.08*** –2.19*** 0.16 –15.74*** –5.37*** –11.07***
Father or mother –15.22*** –5.66*** –1.53** –16.64*** –8.63*** –17.26***
Other relative –10.93*** –0.64** 0.45*** –11.97*** –3.07*** –6.96***
Unrelated person –1.52 1.86*** 1.00*** –9.51*** –0.43 –4.16***
Level of education (reference ≥11 years)
No education 2.42*** 3.30*** –0.45*** 0.33 3.23*** 8.54***
1–5 years 2.08*** 2.33*** –0.22*** 0.74** 2.64*** 8.73***
6–10 years 1.51*** 1.53*** –0.15** –1.16*** 0.12 3.36***
Labor market
Predicted hourly earnings 0.00 0.00 0.00 0.00*** 0.00*** 0.00***
Employed worker (equations 1–3) Domestic worker (equations 4–6)
–3.05*** –1.61*** –0.31*** –0.71*** –1.01*** –1.93***
Religion (reference = other religion)
241
Catholic –0.18 –0.03 –0.01 –0.32 –0.25 –0.56
Protestant –0.27 0.31 0.03 –0.46 –0.44 –0.67
No religion –1.72 –0.85 –0.02 0.09 0.67 1.55**
Dominant ethnic group –0.22 –0.19 –0.23*** 0.12 0.25 0.39*
Household’s demographic structure
Number of children 0–5 1.03*** 0.41*** 0.00 –0.29*** –0.39*** 0.64***
Number of children 6–9 0.30** 0.15** –0.02 0.18 0.03 0.07
Number of male children 10–17 –2.09*** 0.05 0.03 –0.19* 0.12 –0.30***
Number of female children 10–17 –5.49*** –0.40*** –0.14*** –0.26*** 0.31*** –0.03
Number of men 18–25 –0.68*** –0.07 –0.15*** –0.97*** 0.06 0.68*** Number of women 18–25 –5.24*** –0.89*** –0.21*** –0.10 0.88*** –0.21* Number of men 26–55 0.09 0.18** 0.04 –1.90*** –0.30*** –0.32*** Number of women 26–55 –3.70*** –0.62*** –0.22*** –1.31*** –0.03 –0.65*** Number of men 56+ 1.01*** 0.28* 0.10 1.57*** 0.26 1.68*** Number of women 56+ –0.58* –0.13 –0.10 0.72*** 0.20 –1.45***
Household type (reference = couple with children)
Couple without children 18.19*** –0.63* –0.04 0.18 –1.32*** 0.90*
Nuclear single parent 1.75*** 0.27 –0.09 5.91*** 0.97** 0.64
Extended single parent –6.28*** 0.18 –0.11 –0.49 0.37 1.08**
Extended couple –6.63*** –0.15 0.16** 0.55** 1.31*** 0.38
Number of spouses in the household
–2.69*** –0.51*** –0.47*** –0.95*** –1.04*** –0.06
With servants –0.22 –2.25*** –0.65*** 1.44*** 1.10*** –0.77
Access to public services (reference = has access)
Electricity 0.08 –0.31** –0.24*** –1.05*** –1.25*** –0.81***
Water –0.01 –0.53*** –0.23*** –0.33 –1.13*** –1.53***
Electric, gas, or oil stove 0.07 0.09 0.11 –0.34 –0.62*** –0.48*
Number of rooms in dwelling –0.06 0.01 0.04*** –0.06 –0.16*** –0.13**
Household with car –0.41 –1.51*** –0.52*** –1.58*** –1.13*** 0.65**
Household with bicycle or motorbike
–0.13 0.21 0.09 –0.28 0.92*** 1.43***
Household with refrigerator –0.61* –0.48*** –0.08 0.41* 0.20 –0.75***
City (reference = Antananarivo)
Abidjan 5.92*** –3.33*** –4.72*** 0.95* 0.20 –3.67*** Bamako 5.61*** –2.73*** –4.80*** –1.25** –4.30*** –6.08*** Cotonou 5.67*** 0.46 –2.01*** 2.88*** 1.99*** –2.92*** Dakar 2.66*** –0.96*** –4.09*** –3.74*** –6.23*** –2.97*** Douala 1.95*** 2.37*** –0.27* –0.60 –1.05** 0.76 Kinshasa 2.43*** –2.06*** –2.73*** –0.26 –2.25*** –10.66*** Lomé 4.90*** 3.98*** –0.79*** 2.85*** 2.51*** –1.13** Niamey 3.86*** –0.58* –3.80*** –5.00*** –8.26*** –5.60*** Ouagadougou 4.22*** –1.60*** –4.54*** –1.79*** –4.72*** –5.62*** Yaoundé 1.89** 1.84*** –0.10 –1.67 –2.51*** –0.44 Number of observations 42,522 45,311 42,980 42,189 45,311 42,980
Number of uncensored observations 28,359 34,247 14,346 15,984 18,323 22,746
Sources: Based on Phase 1 of the 1-2-3 surveys of selected countries (see table 7.1 for details).
Note: Figures show results of right- and left-censored Tobit models (marginal effects evaluated with respect to the average value for the explanatory variables). * significant at the 10 percent level, ** significant at the 5 percent level, *** significant at the 1 percent level.
Variable women’s domestic working hours/total household domestic working hours (1) Women’s domestic working hours (2) Men’s domestic working hours (3) working hours/ total household market working hours (4) Women’s market working hours (5) Men’s market working hours (6)
DOMESTIC WORK AND EMPLOYMENT IN AFRICA 243
Eff ect on Domestic Labor
Age has a strong impact on the division of domestic labor by gender. Women 16–25 work 0.8 hours a week more than women 26-45, a period during which they have left school, married, and have young children. Women 46–54 reduce the time spent on domestic work slightly (2.4 hours less than women 24–45); women 56 and older spend 7.1 hours less a week than women 26–45. Aft er 55, women are oft en heads of their household or members of extended households.
Th e relative contribution of women to domestic work is similar to the absolute number of domestic working hours. Men perform very few hours of domestic work throughout their life cycle. Th ey perform the most domestic work when they are children (10–15). Th e reverse is true of women, who put in fewer hours of domestic work at each end of their life cycle.
Position in the household also plays a very important role in the division of labor by gender. Women who are married to the household head devote the most time to domestic work; daughters and mothers contribute less time. Th is pattern would seem to suggest a hierarchy in which domestic working time decreases from the outer rim of the household circle (nonrelatives) inward toward the center (children). Consequently, the daughters and mother of the head of household spend fewer hours on domestic work (2.2 fewer for daugh-ters and 5.7 fewer for mothers) than other female relatives (0.64 hour less) and nonrelatives (1.9 more hours). Sons contribute virtually as much time (0.16 hours) as household heads; other male relatives spend half an hour more on domestic work than the household head (males nonrelatives dedicate one hour more than the household head to domestic work). Qualitative studies are needed to determine whether this work is being performed by foster children or refl ects payment for accommodations (see chapter 12).
Th e type of household also plays an important role in the division of labor within the household. Women make smaller contributions in extended house-holds than in other types of househouse-holds, probably because domestic work is distributed among a larger number of people and individuals on the outer rim of the household circle make a larger contribution to domestic tasks. Women in polygamous households also make smaller relative and absolute contributions to domestic working time. Th e presence of servants in the household signifi -cantly decreases the number of domestic working hours performed by women (–2.3 hours) and moderately reduces the number worked by men (–0.65 hour). Th e decrease in women’s contribution to domestic work compared with the share of men (–0.22 percentage points) is small and not signifi cant.
Having a larger number of women in the household reduces the contribu-tion of each woman, especially for women 10–25. Having a larger number of children under 10 increases women’s contribution to domestic work; it has no
eff ect on the domestic workload of men. Th e division of domestic labor by gen-der changes very marginally with the arrival of adult men in the household.
Relative to non-Muslim women, Muslim women account for a larger share of the household’s total time spent on domestic activities, because Muslim men spend less time on domestic activities. Islam therefore appears to be one of the channels, albeit a secondary one, through which social standards and practices concerning men’s role are crystalized.
Belonging to the dominant ethnic group has no eff ect on either the division of domestic labor by gender or the time women spend on domestic work. How-ever, it contributes to a modest reduction (0.21 hour) in the time men spend on domestic work. Th e ethnic group variable could be said to be a proxy for social standards, already partly taken into account by religion. Men in the dominant ethnic group may therefore be thought to have more power in the household, enabling them to reduce the time spent on domestic work.
Contrary to expectations, access to public services has no signifi cant eff ect on the domestic division of labor by gender. Th is result can be explained by the fact that access to water and electricity reduces the domestic tasks performed by men and women in similar proportions. Access therefore reduces total domestic working time for the household as a whole rather than redistributing labor by gender.
Household appliances do not change the household’s division of labor by gender or aff ect the absolute working time of men or women. Household wealth, measured by vehicle ownership and the number of rooms in the dwell-ing, also has no impact on the division of labor. Dwelling size has a positive eff ect on the time men spend working, as they generally are responsible for house repairs, but no impact on women’s working time. However, ownership of a car reduces women’s domestic working time by 1.5 hours and men’s by 0.5 hour. Th e eff ect gives rise to a slightly more female-friendly division of domestic labor (0.4 percentage point reduction in women’s share of domestic labor), but the impact is not statistically signifi cant.
Women’s education increases equality in the division of domestic work, tip-ping the balance more than proportionally in women’s favor at each level of education. However, as with religion, the reduction in inequalities in the distri-bution of domestic work comes from adjustment in the hours of domestic work by women only. Women with higher education spend 2.4 hours less on domes-tic work than women who did not attend school; this reduction narrows to 2.1 hours for women with 1–5 years of education and 1.5 hours for women with 6–10 years of education. Th e opposite trend is observed for men: the more educated they are, the more they participate in domestic tasks. However, the marginal eff ects are fairly small: men with no education perform less than half an hour less domestic work a week than men with more than 10 years of educa-tion (0.22 hour less for men with primary educaeduca-tion and 0.15 hour less for men
DOMESTIC WORK AND EMPLOYMENT IN AFRICA 245
with secondary education). Education thus makes only a modest contribution to improving equity in the division of labor by gender, and its eff ect works more by reducing women’s working time than by increasing men’s working time.
Labor market participation implies a decrease in the share of domestic work performed by women, because of fewer hours of domestic work performed by women (–1.61) and men (–0.31). Households in which women participate in the labor market post lower total domestic working time. Th e predicted level of hourly earnings has no signifi cant impact on the division of domestic labor by gender or the domestic working time worked by men and women.
Eff ect on Market Labor
Th e results on the division of market work are similar to the results for labor. Larger deviations are found for women 10–15 and 56 and older (that is, at the two ends of the life cycle). Spouses of the household head contribute just two hours less than the head of household to market work; nonrelatives come in third place aft er household heads and spouses, making a valuable contribution to the household’s income.
Th e gradient for the level of education is always negative: the higher the level of education, the fewer hours people work in the market. Men with no educa-tion work 3.2 hours more and women work 8.5 hours more than people with 11 years or more of education. Th e level of education therefore has a strong eff ect for men and a moderate impact for women. Participation in domestic work reduces the relative participation of women in total market hours worked as well as the absolute number of market hours worked by men and women (–1.0 hour for men and –1.9 hours for women).
Muslim women contribute less than non-Muslim women to the house-hold’s market work, both because they work fewer hours than non-Muslims and because Muslim men work more hours. Belonging to the dominant ethnic group has no signifi cant eff ect on the division of labor.
Th e household’s demographic structure aff ects the gender-based division of market work. An increase in the number of young dependent household members (children under fi ve) reduces women’s relative and absolute contri-bution to market work. An increase in the number of dependent elderly mem-bers (people 56 and over) is associated with an increase in working hours for elderly men and a decrease for elderly women. Th e number of hours worked in the market decreases for both men and women as the number of male adults in the household increases. Th e increase in the number of adult women and adolescent girls enables women to increase the number of market hours worked, probably as a result of the lightening of their domestic workload. At the same time, the increase entails a very slight reduction in hours worked in the market for adult men (0.2 hour less for men 18–25 and 0.7 hour less for men 26–55).
Turning to specifi c geographic eff ects, Cotonou and Lomé stand out for the much larger contribution of women to market work. Men in these cities work more hours than men in the other cities (except in Cameroon and Madagascar).
Conclusion
On average, domestic work—which remains invisible in national accounts and labor market indicators—represents nearly one-third of total working time in the 11 cities examined. It consumes more time than employment in the formal sector. Large diff erences are observed across cities in both total working time and the breakdown between domestic and market work. Despite their lower labor market participation rate, women account for 56 percent of household working time (62 percent in WAEMU cities).
Unlike in other regions, women in Sub-Saharan Africa do not “specialize” in domestic activities. Women account for 43 percent of household hours spent working in the labor market (as well as 89 percent of hours spent on domestic work). Women spend 60 percent of their working hours in the labor market and the remaining 40 percent on domestic work.
A number of factors are correlated with gender-based inequalities in the division of labor. Social standards appear to play a decisive role: relative posi-tion in the household, age, and Muslim religion all have a signifi cant impact on the gender-based division of both domestic and market-based work. Dif-ferences in education are also signifi cant, but their impact is modest and the gradient by level of education is not very steep. Extended households, polyga-mous households, and households with a large number of adults have a dif-ferent gender-based division of labor than households made up of couples with young children and monogamous households. Contrary to expectations, access to public services (electricity, water) has no apparent eff ect on the divi-sion of domestic labor by gender. Diff erences across cities remain signifi cant when account is taken of the observable characteristics of individuals and their households.
Th e analysis presented in this chapter takes a fi rst step toward including domestic work in GDP estimates and labor market indicators. It sheds light on the question of intrahousehold inequalities, a central aspect in the role and place of women in African societies. Other aspects of intrahousehold inequali-ties have not yet been explored. Future research could examine time use and other aspects of intrahousehold inequalities, such as gender diff erences in edu-cation and healthcare. It could also take individual heterogeneity into account. Another interesting avenue would be to link the perception of well-being with intrahousehold inequalities in the division of working time, in order to shed light on why such inequalities persist.
DOMESTIC WORK AND EMPLOYMENT IN AFRICA 247
Notes
1. Th e level of household welfare is underestimated when the production of goods
and services produced and consumed by the household is not taken into account. As cities and incomes grow, these goods and services are increasingly incorporated into the market sphere, causing gross domestic product (GDP) growth to be overes-timated (Stiglitz, Sen, and Fitoussi 2010). In addition to this material welfare dimen-sion, some authors have defi ned a new form of poverty among households that spend an excessive number of hours working: time poverty (Blackden and Wodon 2006). Although work (market and nonmarket) is the main source of household income and hence welfare, too much time spent working takes away from leisure, rest, family life, and studying and therefore reduces quality of life.
2. Th e United Nations Statistics Division defi nes “nonwork” as time spent in
“per-sonal care and free time,” which includes “bathing, sleeping, eating, time related to personal medical attention, resting, organizational participation, sports and games, socializing and media related activities (reading, television…” UN 1991). All other
activities are classifi ed as work. Th is classifi cation attempts to make visible the
eco-nomic value of unpaid work in society and to capture the relative work burdens of men and women” (Whitehead 1999, p. 52).
3. Th e references include administrative reports published by statistics institutes,
sometimes jointly with UNDP.
4. Working time is defi ned here as the counterpart to leisure time. It does not take into account productivity diff erences, which would have to be considered if the
pur-pose were to study gender-based income disparities. Th e focus is the distribution of
domestic and market time by diff erent household members and its implications for the labor market participation rate.
5. Although Abidjan and Cotonou are not administrative capitals, we refer to them as capitals because they are the most important economic centers in their countries (Cotonou is also the seat of government).
6. Th is correction aff ected less than 1 percent of individuals.
7. Th is term actually covers production for the market and for own consumption (in
agricultural produce). It would be more relevant to talk about activities included in the System of National Accounts.
8. Skoufi as (1993) also adopts this approach, in a study of the determinants of the divi-sion of labor in rural households in India.
9. Nearly half (52 percent) of individuals declare zero market working hours, 44 percent declare zero domestic working hours, and 22 percent declare zero total working hours.
References
Alderman, H., P. A. Chiappori, L. Haddad, J. Hodinott, and R. Kanbur. 1995. “Unitary
Versus Collective Models of the Household: Time to Shift the Burden of Proof?” World
Bank Research Observer 10 (1): 1–19.
Anxo, D., L. Flood, and Y. Kocoglu. 2002. “Off re de travail et répartition des activités domestiques et parentales au sein du couple: une comparaison entre la France et la
Becker, G. S. 1965. “A Th eory of Allocation of Time.” Economic Journal 75: 493–517.
———. 1981. Treatise on the Family. Cambridge, MA: Harvard University Press.
Blackden, C. M., and Q. Wodon. 2006. Gender, Time Use, and Poverty in Sub-Saharan
Africa. Washington, DC: World Bank.
Bourguignon, F., and M. C. Chiuri. 2005. “Labor Market Time and Home Production: A New Test for Collective Models of Intra-Household Allocation.” CSEF Working Paper 131, Centre for Studies in Economics and Finance, Naples.
Brown, L., and L. Haddad. 1995. “Time Allocation Patterns and Time Burden: A Gen-dered Analysis of Seven Countries.” International Food Policy Research Institute (IFPRI), Washington, DC.
Browning, M., F. Bourguignon, P. A. Chiappori, and V. Lechene. 1994. “Income and
Out-comes: A Structural Model of Intrahousehold Allocation.” Journal of Political Economy
102 (6): 1067–96.
Browning, M., and P. A. Chiappori. 1998. “Effi cient Intra-Household Allocations: A
Gen-eral Characterization and Empirical Tests.” Econometrica 66 (6): 1241–78.
Canagarajah, S., and H. Coulombe. 1998. “Child Labor and Schooling in Ghana.” Policy Research Working Paper 1844, World Bank, Washington, DC.
Fafchamps, M., and A. Quisumbing.2003. “Social Roles, Human Capital, and the
Intra-household Division of Labor: Evidence from Pakistan.” Oxford Economic Papers 55
(1): 36–80.
Gronau, R. 1977. “Leisure, Home Production and Work: Th e Th eory of Time Allocation
Revisited.” Journal of Political Economy 85 (6): 1099–123.
Hersch, J., and L. Stratton. 1994. “Housework, Wages, and the Division of Housework
Time for Employed Spouses.” American Economic Review 84 (2): 120–25.
Ilahi, N. 2000. “Th e Intra-household Allocation of Time and Tasks: What Have We
Learnt from the Empirical Literature?” Policy Research Report on Gender, and Devel-opment, Working Paper 13, World Bank, Washington, DC.
———. 2001. “Gender and the Allocation of Adult Time: Evidence from the Peru LSMS Panel Data.” Policy Research Report Working Paper 2744, World Bank, Washington, DC.
Kes, A., and D. Swaminathan. 2006. “Gender and Time Poverty in Sub-Saharan Africa.” In Gender, Time Use, and Poverty in Sub-Saharan Africa, ed. C. M. Blackden and Q. Wodon, 13–32. Washington, DC: World Bank.
Quisumbing, A., and J. Maluccio. 2000. “Intrahousehold Allocation and Gender Rela-tions.” FCND Discussion Paper 84, International Food Policy Research Institute, Washington, DC.
Ritchie, A., C. Lloyd, and M. Grant. 2004. “Gender Diff erences in Time Use Among Ado-lescents in Developing Countries: Implications of Rising School Enrollment Rates.” Working Paper 193, Population Council, Policy Research Division, New York. Skoufi as, E. 1993. “Labor Market Opportunities and Interfamily Time Allocation in
Rural Households in South Asia.” Journal of Development Economics 40 (2): 277–310.
Stiglitz, J. E., A. Sen, and J.-P. Fitoussi. 2010. Mismeasuring Our Lives: Why GDP Doesn’t
DOMESTIC WORK AND EMPLOYMENT IN AFRICA 249
UN (United Nations). 1991. Th e World’s Women: Trends and Statistics. New York: Centre
for Social Development and Humanitarian Aff airs.
Whitehead, A. 1999. “‘Lazy Men,’ Time Use, and Rural Development in Zambia.” Gender
and Development 7 (3): 49–61.
World Bank. 2006. Gender, Time Use and Poverty in Sub-Saharan Africa. Washington,
© 2013 International Bank for Reconstruction and Development / Th e World Bank 1818 H Street NW, Washington DC 20433
Telephone: 202-473-1000; Internet: www.worldbank.org Some rights reserved
1 2 3 4 16 15 14 13
Th is work is a product of the staff of Th e World Bank with external contributions. Note that Th e World Bank and the Agence Française de Développement do not necessarily own each component of the content included in the work. Th e World Bank and the Agence Française de Développement therefore do not warrant that the use of the content contained in the work will not infringe on the rights of third parties. Th e risk of claims resulting from such infringement rests solely with you.
Th e fi ndings, interpretations, and conclusions expressed in this work do not necessarily refl ect the views of Th e World Bank, its Board of Executive Directors, or the governments they represent, or the Agence Française de Développement. Th e World Bank does not guarantee the accuracy of the data included in this work. Th e boundaries, colors, denominations, and other information shown on any map in this work do not imply any judgment on the part of Th e World Bank concerning the legal status of any territory or the endorsement or acceptance of such boundaries.
Nothing herein shall constitute or be considered to be a limitation upon or waiver of the privileges and immunities of Th e World Bank, all of which are specifi cally reserved.
Rights and Permissions
Th is work is available under the Creative Commons Attribution 3.0 Unported license (CC BY 3.0) http:// creativecommons.org/licenses/by/3.0. Under the Creative Commons Attribution license, you are free to copy, distribute, transmit, and adapt this work, including for commercial purposes, under the following conditions:
Attribution—Please cite the work as follows: De Vreyer, Philippe, and François Roubaud, Editors. 2013.
Urban Labor Markets in Sub-Saharan Africa. Africa Development Forum series. Washington, DC: World
Bank. doi:10.1596/978-0-8213-9781-7. License: Creative Commons Attribution CC BY 3.0
Translations—If you create a translation of this work, please add the following disclaimer along with the attribution: Th is translation was not created by Th e World Bank and should not be considered an offi cial World Bank translation. Th e World Bank shall not be liable for any content or error in this translation. All queries on rights and licenses should be addressed to the Offi ce of the Publisher, Th e World Bank, 1818 H Street NW, Washington, DC 20433, USA; fax: 202-522-2625; e-mail: [email protected]. ISBN (paper): 978-0-8213-9781-7
ISBN (electronic): 978-0-8213-9782-4 DOI: 10.1596/978-0-8213-9781-7
Cover image: ©Michelle Saint-Léger, IRD, 2013.
Cover design: Debra Naylor, Naylor Design, Inc. Library of Congress Cataloging-in-Publication Data Vreyer, Philippe De.
Urban labor markets in sub-Saharan Africa/Philippe De Vreyer and François Roubaud. p. cm.
Includes bibliographical references and index.
ISBN 978-0-8213-9781-7 — ISBN 978-0-8213-9782-4 (electronic)
1. Labor market—Africa, Sub-Saharan. 2. Africa, Sub-Saharan—Economic conditions. 3. City dwellers—Employment—Africa, Sub-Saharan. I. Roubaud, François. II. World Bank. III. Title. HD5837.A6V74 2013
331.120967—dc23
2012050217
Th e French translation of this book is copublished by Agence Française de Développement and Institut de Recherche pour le Développement (IRD). Th e IRD, a French public research institute emphasizing interdisciplinarity, has focused its research for more than 65 years on the relationship between man and its environment in Africa, Asia, Latin America, the Mediterranean, and the French tropical overseas ter-ritories. Its research, training, and innovation activities are intended to contribute to the social, economic, and cultural development of southern countries. For further information: www.editions.ird.fr.