Levels of polychlorinated biphenyls in human milk
samples in European countries
Nataša Brajenović, Irena Brčić Karačonji, and Andreja Jurič
Institute for Medical Research and Occupational Health, Zagreb, Croatia [Received in February 2018; Similarity Check in February 2018; Accepted in June 2018]Polychlorinated biphenyls (PCBs) are persistent pollutants, harmful to human health, which enter the human body mainly through food and bind to body fat. For these reasons their use in most countries is prohibited. Human milk has an advantage over other types of human samples in measuring human exposure to PCBs, as it is obtained with non-invasive sampling methods. In Europe, including Croatia, PCB levels have been monitored for many years. This review summarises PCB trends in human milk across Europe. The trend is generally downward, with higher levels prevailing in urban areas near industrial plants. The highest PCB levels were reported in the Czech Republic and Slovakia.
KEY WORDS: breast milk, organochlorine compounds, PCBs, persistent pollutants Persistent organic pollutants (POPs) have been a serious
threat to the environment and human health for a long time. POPs such as 1,1’-(2,2,2-trichloroethane-1,1-diyl)bis(4-chlorobenzene) (DDT) and polychlorinated biphenyls (PCBs) were prohibited in many industrialised countries as early as the 1960s and 1970s. Yet even today these compounds can be found in places as remote as Arctic, where they have never been utilised but have been transferred there owing to their physical-chemical properties, semi-volatility, and persistence (1, 2). Due to lipophilicity, they accumulate in the adipose tissue and accumulate along the food chain. This is why the highest levels are found in the top marine predators such as seals, whales, polar bears, sea birds, and humans (1).
To protect human health and the environment, the international community has responded to the POP threat with the Stockholm Convention on POPs, which was signed in 2001, became effective in May 2004, and has been ratified by more than 170 countries (2-4). Generally, the levels of polychlorinated biphenyls (PCBs) in human milk are higher in the more industrialised areas of Europe and Northern America than in Africa and Asia (4). In European countries the most abundant PCB, PCB-153, has been detected in the lowest levels in Belgium, Latvia, Italy, Norway, Poland and Sweden, while its highest levels were found in Czech Republic, and Slovak Republic (4).
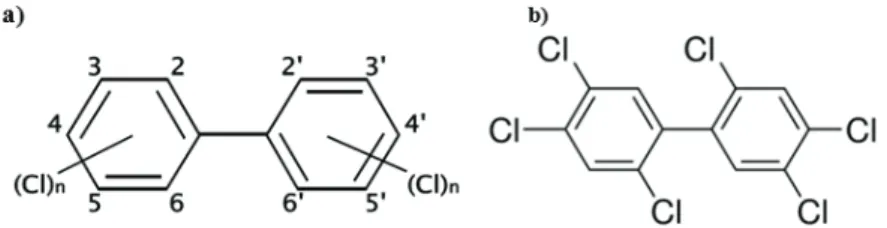
PCBs are aromatic organic compounds, which consist of two benzene rings with 1 to 10 chlorine atoms (Figure 1) (6, 15). Their chemical formula is C12H10-nCln (5, 15), where n is the number of chlorine atoms. Considering the
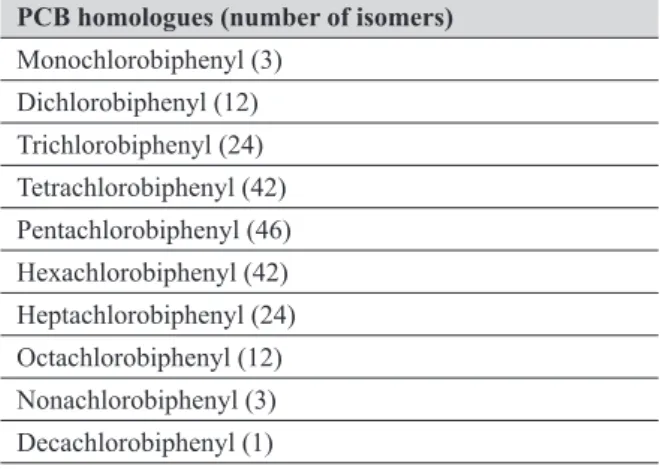
number and position of chlorine atoms, there are 209 isomers and PCB homologues, which are called congeners. All PCBs with the same number of chlorines are called homologues. A homologue with different substitution is called isomer. Table 1 lists the PCB homologues and the number of their isomers (5, 6). International Union of Pure and Applied Chemistry (IUPAC) has designated all PCBs with numbers from 1 to 209 (5-9).
In environmental samples, six indicator PCBs (PCB-28, PCB-52, PCB-101, PCB-138, PCB-153, and PCB-180) are most often determined due to their presence in commercial mixtures (Table 2). The toxicity of PCB congeners depends on the number and position of chlorine atoms in the molecule (7, 10). The most toxic congeners (Table 2) are
non-ortho PCBs, which include 77, 81,
PCB-126, and PCB-169. Other toxic PCBs are the mono-ortho 105, 114, 118, 123, 156, PCB-157, PCB-167, and PCB-189. PCB-60 and PCB-74 are also
Correspondence to: Nataša Brajenović, PhD, Analytical Toxicology and Mineral Metabolism Unit, Institute for Medical Research and Occupational Health, Ksaverska cesta 2, HR-10000 Zagreb, Croatia
E-mail: nbrajen@imi.hr
Table 1 Homologues of PCBs with corresponding number of isomers (5, 6)
PCB homologues (number of isomers) Monochlorobiphenyl (3) Dichlorobiphenyl (12) Trichlorobiphenyl (24) Tetrachlorobiphenyl (42) Pentachlorobiphenyl (46) Hexachlorobiphenyl (42) Heptachlorobiphenyl (24) Octachlorobiphenyl (12) Nonachlorobiphenyl (3) Decachlorobiphenyl (1)
very often analysed due to their presence in environmental samples (7).
To have greater uniformity in risk assessment and comparability of findings in different samples, the scientific community introduced toxic equivalency (TEQ). A TEQ of a particular PCB congener is calculated by multiplying PCB level with the Toxic Equivalent Factor (TEF) of that PCB. If TEQ is calculated for a mixture of PCBs, all individual TEQs are summed up. TEF expresses the toxicity of a PCB congener in relation to the most toxic form, dioxin, 2,3,7,8-tetrachlorodibenzo-p-dioxin (TCDD), whose TEF is set at 1 (5, 10-13).Table 2shows the TEFs of the most toxic PCBs congeners and 2,3,7,8-TCDD (12, 13).
The production and commercial use of PCBs began in the USA in 1929, and about at the same time in Europe (Germany and France) (7, 9). PCBs were applied for many years in various fields of industry as heat-exchanges fluid in electric transformer and capacitors, additives in paints, carbonless copy paper, and plastics production due to their chemical stability, low flammability, and high dielectric constant (7, 9, 10, 14). In the European Union, the production of PCBs is prohibited, and waste disposal is regulated by law. Russia ended their production in 1993 (7).
These compounds are very toxic to fish. While higher doses can cause death, lower PCB doses were reported to
interfere with spawning. PCBs also cause reproductive failure and suppression of the immune system in various wild animals. Humans are mainly exposed to PCBs through contaminated food (14). The adverse effects of PCB on human health have been addressed by a number of studies, which have shown that PCBs can act as endocrine disruptors, disturb homeostasis, and cause reproductive, immuno-, neuro-, and genotoxicity (6, 15–17).
Monitoring of organochlorine compounds in the Croatia started in 1975. At first, it was focused on analysing pesticides and later extended on determining total PCB levels (10). The most serious soil contamination with PCBs was recorded during the Croatian Homeland War in 1991 due to the damage of condenser batteries in the Zadar electric power substation (18).
PCBs released in the environment are very resistant to physicochemical and biological degradation and do not break down easily. They persist in the air, water, and soil and have a tendency to spread through the food chain and accumulate in all living organisms (2, 15, 17). In humans, PCBs mostly accumulate in the fat tissue, blood, and milk.
Human milk is a popular and reliable matrix for the determination of exposure levels in the human population (2) due to its availability and non-invasive sampling. PCB levels in human milk are usually expressed per amount of milk fat (lipid base; lipid weight), which allows comparison Figure 1 Structure of: a) polychlorinated biphenyls and b) PCB-153 (2,2′,4,4′,5,5′-hexachlorobiphenyl) (6, 15)
Table 2 Six indicator PCBs and the Toxic Equivalent Factors (TEF) for the most toxic PCBs and dioxin (6, 7, 12, 13)
Six indicator PCBs PCB-28 (2,4,4'-Trichlorobiphenyl) PCB-52 (2,2',5,5'-Tetrachlorobiphenyl) PCB-101 (2,2',4,5,5'-Pentachlorobiphenyl) PCB-138 (2,2',3,4,4',5'-Hexachlorobiphenyl PCB-153 (2,2',4,4',5,5'-Hexachlorobiphenyl) PCB-180 (2,2',3,4,4',5,5'-Heptachlorobiphenyl)
PCB congeners WHOTEF1 2005
non-ortho PCBs PCB-77 (3,3',4,4'-Tetrachlorobiphenyl) PCB-81 (3,4,4',5-Tetrachlorobiphenyl) PCB-126 (3,3',4,4',5-Pentachlorobiphenyl PCB-169 (3,3',4,4',5,5'-Hexachlorobiphenyl 0.0001 0.0003 0.1 0.03 mono-ortho PCBs PCB-105 (2,3,3',4,4'-Pentachlorobiphenyl) PCB-114 (2,3,4,4',5-Pentachlorobiphenyl) PCB-118 (2,3',4,4',5-Pentachlorobiphenyl) PCB-123 (2',3,4,4',5-Pentachlorobiphenyl) PCB-156 (2,3,3',4,4',5-Hexachlorobiphenyl) PCB-157 (2,3,3',4,4',5'-Hexachlorobiphenyl) PCB-167 (2,3',4,4',5,5'-Hexachlorobiphenyl) PCB-189 (2,3,3',4,4',5,5'-Heptachlorobiphenyl) 0.00003 0.00003 0.00003 0.00003 0.00003 0.00003 0.00003 0.00003 Dioxin (2,3,7,8-Tetrachlorodibenzo-p-dioxin (TCDD) 1
other method, however, determination of PCBs in human milk has its limitations. The samples can only be obtained from lactating women, which excludes other population groups. In addition, PCB levels in human milk depend on many factors. The most important are eating habits, as PCBs mostly enter the human organism through consumption of animal food. Then there is the mother’s age, and lactation duration (7).
Thanks to the development of analytical methods, gas chromatography coupled with mass spectrometry in particular, their validation, and intra- and inter-laboratory quality controls, today it is possible to compare the measured levels of PCBs with a high degree of reliability (7, 10).
Over the last decades, human milk has been used as an important medium for measuring PCBs contamination in humans. Among the most important contaminants, there are six indicator PCBs (28, 52, 101, PCB-138, PCB-153 and PCB-180), which are the most abundant in commercial PCB mixtures such as AROCLOR (6).
In this paper we present an overview of the current knowledge about PCBs levels determined in human milk samples across Europe. We have also included some representative data from Russian studies, which were interesting for the comparison.
Levels of PCBs in human milk in European countries
The World Health Organization (WHO) has been running global surveys of polychlorinated dibenzo-p-dioxin (PCDD), polychlorinated dibenzofurans (PCDFs), and PCBs in human milk since 1987 (19). The latest among them, covering 52 countries, have shown that the highest levels of these compounds are associated with intense industrialisation. The highest levels of PCBs were recorded in Eastern and Western Europe. Europe reported high levels of the six indicator PCBs, and the highest were found in the Czech Republic and Slovakia. Although many Western and Eastern European countries also reported high levels of dioxin-like PCBs (dl-PCBs), the highest level was reported for Ukraine.
Globally, lower PCB levels were reported in the southern hemisphere. Elevated PCB levels in these countries were associated with closeness to industrial plants. The surveys also established a strong relationship between dl-PCBs and the six indicator dl-PCBs (19). Table 3 shows the levels of the six indicator PCBs and the most toxic non-ortho PCBs in human milk in some European countries and the European part of Russia.
The monitoring of organochlorine compounds in human milk started in Sweden in 1967. According to Noren and Meironyte (20), they have shown a decreasing trend over 20 to 30 years. In the sixties they PCB levels increased, but their drop was visible in 1972. From then till 1997 total PCB levels dropped further by 30 %. Lignell et al. (21)
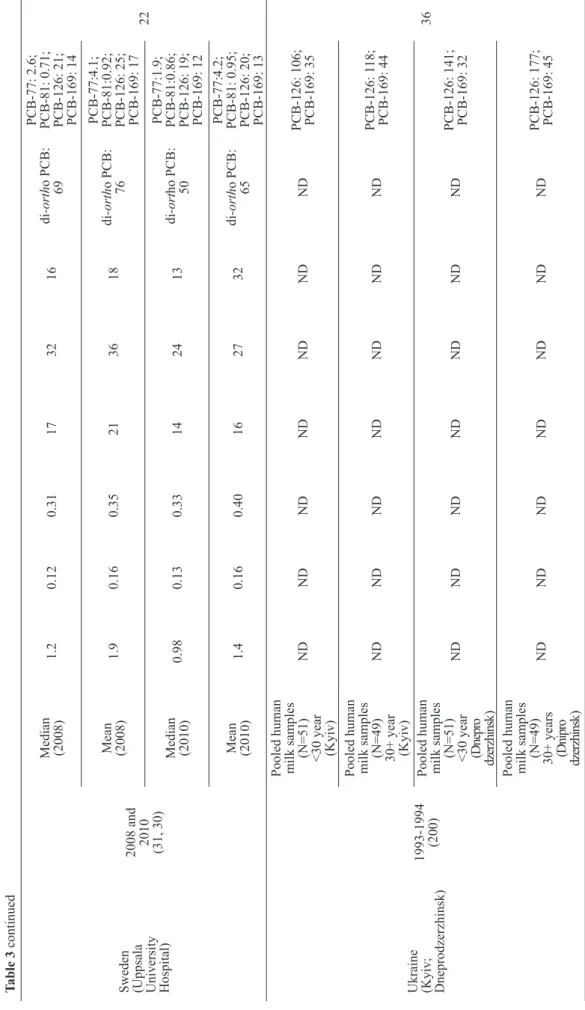
human milk samples (N=335) collected in the Uppsala County between 1996 and 2006. In another study (22), the same authors reported that the highest levels in the human milk samples collected from 2008 to 2010 were those of PCB-153, followed by PCB-138 and PCB-180. The highest levels of a non-ortho congener were those of PCB-126.
Glynn et al. (23) reported small differences in median organohalogen pollutant levels in human milk samples collected from 204 primiparas from four Swedish regions in 2000-2004. PCB-153, PCB-138, and PCB-180 had the highest levels. The lowest levels of mono- and di-ortho PCBs were determined in a rural area of the northern part of Sweden.
A statistically significant decline in dl-PCB levels in human milk samples from Sweden were also reported from 1972 to 2011. The decrease ranged from 5.8 to 7.6 % a year. Over the last ten years these levels decreased by 8.1-12 % (24).
Similar investigations were conducted in other countries in northern Europe (25, 26). In Denmark, human milk dl-PCB and the six indicator dl-PCB levels (WHO-TEQ2005 dl-PCB=6.6 pg g-1 milk fat, six ndl-PCB=162.8 ng g-1 milk fat) were significantly higher than in Finland (WHO-TEQ2005 dl-PCB=4.6 pg g-1 milk fat, sum of six ndl-PCB=104.0 ng g-1 milk fat) (26). In France, median dl-PCB and the six ndl-PCBs (WHO-TEQ 2005 dl-PCB=4.3 pg g-1 milk fat, sum of six ndl-PCB=85.2 ng g-1 milk fat) were lower than in Danish and Finnish women (26).
Between 2002 and 2009, 612 human milk samples were collected in Norway (27). Forns et al. (27) analysed the association between 13 PCBs and behavioural problems in children during the first two years of life and found none.
Polder et al. (28) investigated PCBs levels in human milk samples collected from primiparas from northern (Tromsø) (N=10) and southern Norway (Oslo) (N=19) in 2000 and 2001. Tromsø is a town located in Northern Norway 400 km north of the Arctic Circle, while Oslo is 2000 km south. In Oslo two locations were included, one in the city centre and the other to the south-east of the city. The median of sum PCBs20 (PCB-28, PCB-52, PCB-74, 99, 101, 105, 114, 118, PCB-123, PCB-128, PCB-138, PCB-153, PCB-156, PCB-157, PCB-167, PCB-170, PCB-180, PCB-187, PCB-189 and PCB-94) was the highest in the Oslo centre. The long-term temporal trend (1970–2002) of PCBs in Norwegian human milk showed an increase in PCBs since the restrictions in 1972 until PCB ban in 1979. After that, PCB levels decreased 65 % between 1982 and 1991.
In two Norwegian and one Lithuanian region sixteen PCBs (PCB-28, PCB-52, PCB-77, PCB-101, PCB-105, 114, 118, 126, 138, 153, PCB-156, PCB-157, PCB-169, PCB-170, PCB-180, PCB-189) were measured in human milk samples pooled from 10-12 women. Their results showed no significant differences
dietary habits of their residents (29).
Between 1939 and 1990, Russia produced about 180,000 t of PCBs (30, 31) in two European cities: Novomoskovsk and Dzerzhinsk. These products were used as dielectrics in transformers and capacitors or paint additives and lubricants. Used PCB-containing oils were then burned in furnaces (such as the blast furnace of the Novolipetsk metallurgical combine). In the cities and their surroundings where PCBs were produced, high levels of these compounds were released into the environment and ended in the local food products. Women from Serpukhov, who worked in the plant or lived near it, had high levels of PCBs in their milk (30, 32). TheBaikal region had two sources of PCB pollution: chlorine production industrial waste and (possibly) the transformer plant in Usolie-Sibirskoye. Human milk was monitored there in nine cities and one village from 1998 to 2004. The sum of twenty-eight PCB congeners ranged from 91 to 5,300 ng g-1 milk fat. Women from Irkutsk (regional capital) stood out with very high levels of PCBs in their milk (30).
Bobovnikova et al. (32) reported that an important source of environmental pollution in Serpukhov (Russia) over 35 years was a plant which used PCBs for filling capacitors. Their Institute of Experimental Meteorology monitored PCBs concentrations in the air, snow cover, soil, water, and biological materials (vegetation and breast milk). Human milk of women who worked at the plant and living near to it had extremely high PCB levels ranging from 1,000 to 2,400 µg L-1. Women who lived 2 km from the plant but did not work in it had much lower PCB levels: 22–35 µg L-1.
Polder et al. (33) analysed twenty-three PCBs (PCB-28, PCB-52, PCB-66, PCB-74, PCB-99, PCB-101, PCB-105, 110, 114, 118, 128, 138, PCB-141, PCB-149, PCB-153, PCB-156, PCB-157, PCB-170, PCB-180, PCB-187, PCB-194, PCB-206, and PCB-209) in thirty human milk samples collected in Murmansk and Monchegorsk (north-western part of Russia) in 1993. All samples were collected fourteen days after delivery. In Monchegorsk they found significantly higher levels of 28, 66, 74, 105, 110, and PCB-118 than in Murmansk. In Murmansk they measured significantly higher levels of PCB-52, PCB-128, PCB-206, and PCB-209 than in Monchegorsk. No significant differences were discovered in the levels of non-ortho PCBs between the cities. PCB-74, PCB-99, PCB-118, PCB-138, PCB-153, and PCB-180 were the main congeners and accounted for 82 % of the sum of all PCB levels. The authors concluded that the significant difference in the PCB pattern between the two cities may suggest that the population of Monchegorsk was exposed to a mixture of PCBs with lower chlorine content.
Polder et al. (34) issued a very detailed report about 30 PCBs and other POPs in 140 human milk samples of primiparas and multiparas collected within three days after delivery at four sub-arctic and arctic locations in Russia
PCB-153, PCB-138, PCB-118, and PCB-180. Hexa-chlorinated PCBs accounted for more than 47 % of the sum of all measured PCBs. The levels of higher chlorinated PCBs and the PCB profile in human milk samples were explained with living conditions and dietary habits of the women who lived in these areas. The highest mean level of sum-PCBs (458 ng g-1 milk fat) was determined in the multiparas of Narayan-Mar and in one primipara it was as high as 1090 ng g-1 milk fat. POP levels varied significantly across the locations, which was also explained by differences in dietary habits between individuals and groups.
Polder et al. (31) also reported on spatial and temporal changes in PCB levels in human milk samples (N=42) in the north-western part of Russia characterised by heavy industry (the Kola peninsula and the area enclosing the White Sea) from 2000 and 2002 by comparing them with the corresponding levels determined between 1993 and 1996 (N=58). The median levels of ΣPCBs12 (PCB-28, PCB-52, PCB-74, PCB-99, PCB-101, PCB-128, PCB-138, PCB-153, PCB-170, PCB-180, PCB-187 and PCB-194), Σmono-ortho PCBs4 (PCB-105, PCB-118, PCB-156, and PCB-157), and ΣPCBs16 (sum of PCB12 and mono-ortho PCBs4) were the highest in Murmansk (median 316 ng g-1 milk fat) and Kargopol (303 ng g-1 milk fat) and the lowest in Arkhangelsk (175 ng g-1 milk fat). Between 1993 and 2002, ΣPCBs12, Σmono-ortho PCBs4, and ΣPCBs16 dropped 29, 34, and 30 % in Murmansk and 40, 53, and 43 % in Arkhangelsk, respectively. In Kargopol, however, the mean levels of ΣPCBs12, Σmono-ortho PCBs4, and ΣPCBs16 increased 40, 16, and 36 %, respectively.
Bake et al. (35) were the first to assess levels of POPs in human milk in Latvia. They analysed 15 samples from the town of Olaine, with chemical industry, and compared their PCB levels with 15 control samples. The level of the six indicator PCBs in pooled samples of the Olaine group was higher than in control (141.8 ng g-1 milk fat
vs.110.9 ng g-1 milk fat). Even so, these are the lowest levels of the six indicator PCBs in Central Europe. The authors also observed that the level of sum PCBs correlated with body weight gain during pregnancy.
Gleden et al. (36) analysed PCB levels in human milk samples collected from 200 women from the cities of Kyiv (capital) and Dneprodzerzhinsk (a highly industrialised city) in Ukraine. The milk samples were analysed for two dl-PCBs (PCB-126 and PCB-169). The milk samples were pooled in four groups: by city and age (under 30 and 30 years and above). The results are shown in the Table 3. Individual samples from these women have been analysed for some PCB congeners in an earlier investigation (37).
Among other European regions, the Faroe Islands stand out with high POP and particularly high PCB levels in human milk (38).In fact, the PCBs levels were higher than in some European countries such as Sweden and Belgium. Samples were taken from 10 women, and total PCBs
(PCB-PCB-153, PCB-156, PCB-170, PCB-180, PCB-183, and PCB-187) varied from 2300 ng g-1 milk fat in 1987 to 1600 ng g-1 milk fat in 1997 and 1800 ng g-1 milk fat in 1999, which could be explained by a high seafood intake, which includes pilot whale blubber, flumars, and flumar eggs contaminated with PCBs.
Čechova et al. (39) reported the median levels of the six indicator PCBs in 545 human milk samples from Slovakia (37 samples collected from 2010 to 2012), the Netherlands (120 samples collected between 2011 and 2014), and Norway (388 samples collected between 2001 and 2006). Slovakia reported the highest levels (144 ng g−1 milk fat), followed by Norway (62.02 ng g−1 milk fat) and the Netherlands (39.09 ng g−1 milk fat).
In another study, Čechova et al. (40) analysed a total of 120 human milk samples collected between 2011 and 2015 in the Netherlands. The highest median level was obtained for PCB-153 (16.0 ng g−1 milk fat), followed by PCB-180 and PCB-138 (10.7 ng g−1 milk fat for both). In samples collected from 2009 to 2012 the levels and profiles of PCBs were comparable with other European countries such as Sweden, Belgium, or Croatia. Compared to the Czech Republic, however, these levels were about six to eight times lower.
Chovancova et al. (41) analysed the milk of primiparas (N=33) living near industrial areas in Slovakia, collected from 2006 to 2007 and determined twelve dl-PCB congeners. The highest levels were reported for the mono-ortho substituted PCB congeners PCB-118 and PCB-156, followed by PCB-167 and PCB-105. One of the reasons why the Slovakian PCB levels in milk were similar to those recorded in the Czech Republic could be that more than 11,600 t of PCBs were used as dielectric and heat exchanger fluids and paint additives in the former Czechoslovakia from 1959 to 1984 (41, 42).
The Czech Republic is one of the most PCB-polluted countries in the world. Long-term POP data suggest a trend toward decline in human milk in industrial and urban regions as well as in rural areas located near industrial zones (43). The authors also found the levels of monitored chlorinated compounds correlated with mother’s age.
Černá and Bencko (44) also reported high PCB levels in human milk samples from the Czech Republic. The highest were found for PCB-153, while total PCBs ranged from 0.5 to 3.45 mg kg-1 fat milk.
In a study of 90 human milk samples collected in seven urban areas of the Czech Republic from 1999 to 2000, Černá et al. (45) found the six indicator PCBs in all analysed samples. Uherske Hradište stood out as a risk area because of its closeness to an old industrial plant which produced PCB paints in the 1970s and 1980s (45, 46).
Long-term trends of POPs, in human milk, PCBs in particular, continued to be monitored in the Czech Republic after the prohibition, between 1996 and 2011. Banyiova et al. (47) calculated daily PCB intakes from the levels of
Biomonitoring (CZ-HBM) study (48) and compared them with the food-derived daily intakes for PCBs reported by the National Institute of Public Health (49). The calculated daily intake was in good agreement with the reported dietary PCB intake data, which confirms food as the main source of PCB exposure. Yet, even though the long-term trends in daily PCB intake were decreasing since the ban, some years showed increased PCB levels in human milk, which points to a more recent food contamination. The authors therefore stressed the need for continuous monitoring of POP levels in the Czech Republic.
In Poland, Jaraczewska et al. (50)analysed human milk samples collected from 22 women in the second half of the 2004. In spite of the limited sample size, it was safe to assume that the PCB levels were at the low end of the European range.
Szyrwinska et al. (51) analysed the levels of seven PCBs (the six indicator PCBs and PCB-118) in 27 human milk samples collected from Polish women living in the Wielkopolska province from 2000 to 2001 (51). They also reported relatively low mean and median levels of the sumPCBs7 (114.8 and 90.3 ng g-1 milk fat in primiparas, and 101.8 and 71.7 ng g-1 milk fat in secundiparas) in comparison with the Czech Republic, Slovakia, and Spain.
Hernik et al. (52) analysed the levels of 77, PCB-101, PCB-118, PCB-126, PCB-138, PCB-153, PCB-170, and PCB-180 in 28 human milk samples collected in the Warsaw region. The highest levels were obtained for PCB-153 (39.8 ng g-1 milk fat), PCB-180 (26.1 ng g-1 milk fat), and PCB-138 (23.6 ng g-1 milk fat). These were comparable with the levels reported for Poland by other authors and with other European countries.
Vigh et al. (53) analysed PCBs levels in samples of human milk (N=22) collected in the Baranya Country in Hungary on days 5, 12, and 84 postpartum (53). They detected twelve dl-PCBs and seven ndl-PCBs and established an inverse correlation between the duration of lactation and the levels of several PCB congeners. The most notable decline was observed between postpartum days 5 and 12. On postpartum day 5, total ndl-PCB level (the six indicator PCBs and PCB-170) was 33.5±29.2 ng g-1 milk fat. By day 12 it dropped to 27.4±20.6 ng g-1 milk fat (18 % decrease) and by day 84 to 26.9±24.8 ng g-1 milk fat (20 % decrease). A similar decreasing trend was observed for dl-PCBs and total PCB levels.
In Germany, Furst et al. (54) analysed more than 1,400 human milk samples from 1984 to 1991 in Germany. PCBs levels had been constant for a long time, while a slight decrease was observed from 1989 to 1991, possibly due to the ban.
Zietz et al. (55) reported the results regarding a long-term biomonitoring of PCBs levels in 4314 human milk samples collected in northern Germany from 1999-2006. Median levels of total PCBs showed a clear rise with the
decline.
Still in Germany, the Bavarian Health and Food Safety Authority has been monitoring organohalogen compounds in human milk samples for more than 20 years (56). Data on indicator PCBs are accessible since 1985. Monitoring of sum PCBs (PCB-138, PCB-153, and PCB-180) showed a decreasing trend over the 1985-2005 period.
Raab et al. (57) also reported on organochlorine compounds levels in 516 human milk samples collected in seven Bavarian regions from 2007 to 2008. Median levels of the sum six indicator PCBs was 150 ng g-1 milk fat, while the median of the WHO-TEQ1998 dl-PCBs was 6.4 pg g -1 milk fat.
Wittsiepe et al. (58) in their “Duisburg birth cohort study” analysed blood and human milk samples collected from 169 participants who lived in an industrialised area of Germany between September 2000 and January 2003. They reported a good correlation between PCBs levels, expressed on lipid base, in milk and blood. The levels of WHO-TEQ (PCB) were in the range from 1.40 to 42.23 pg g -1 lipid base for blood (median: 10.81, arithmetic mean: 11.57) and from 1.21 to 50.10 pg g -1 milk fat for milk (median: 13.00, arithmetic mean: 13.43). The distribution between blood and milk depended on the molecular weight of the substances. The levels of higher chlorinated PCBs were two to four times higher in blood than in milk, while the levels of lower chlorinated PCBs were two times higher in milk than in blood.
Brucker-Davis et al. (59) found a significant positive correlation between PCB-153 and ∑PCB levels in umbilical cord blood (N=84) and milk (N=69) samples collected in a French maternity hospital in 2002-2005. The median PCB-153 content in cord blood was 0.2 ng mL-1 (range: 0.1-2.6 ng mL-1) and in milk 59.0 ng g-1 of milk fat (0.5-1395.3 ng g-1).
In a pilot study carried out in France before the start of the Elf project (French longitudinal study from childhood) Focant et al. (60) collected 44 human milk samples six to eight weeks after delivery and measured twelve dl-PCBs (eight mono-ortho PCBs and four non-ortho-PCBs), and the six indicator ndl-PCBs. The levels of dl-PCBs were at the high end of the European range and so were the ndl-PCBs but this was still significantly lower than ndl-PCB levels reported for the Slovak and Czech Republic.
Croes et al. (61) analysed PCBs in 84 human milk samples collected in the rural areas in Flanders (Belgium) in 2009-2010. The analysis included PCB-118, PCB-138, PCB-153, PCB- 170, and PCB-180, and dl-PCBs in individual samples and the pooled sample. The levels of PCB-31, PCB-52, PCB-95, and PCB-149 were below the limits of quantification (LOQ) in all individual samples. The levels of other PCBs were lower than in the WHO Human Milk Study from 2006 (61).
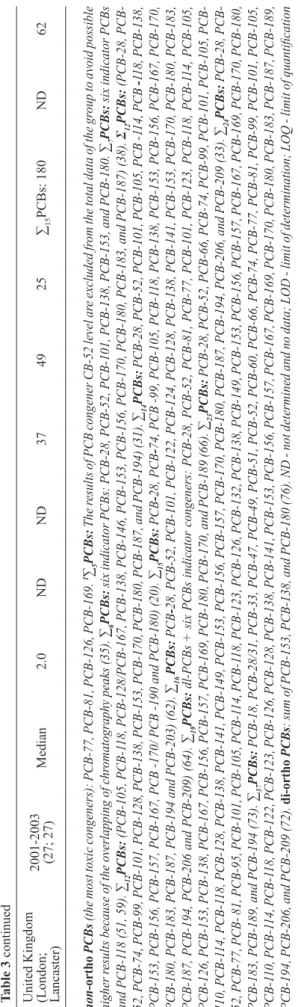
In the United Kingdom, Kalanatzi et al. (62) analysed 54 human milk samples collected between late 2001 and
consistently higher PCB levels than the 27 samples collected in Lancaster.
In Ireland, Pratt et al. (63) reported a decreasing trend in dl-PCB levels in human milk samples collected from 2002 to 2010. The total levels of the six indicator PCBs in 11 pooled samples ranged between 31.5 and 59.0 ng g-1 milk fat in 2010 and between 37.4 and 64.5 ng g-1 milk fat in 2002. The 2010 total dl-PCB levels were also generally lower than those measured in 2002. The measured levels were also lower than those found in other European countries, perhaps because Ireland had not had a history of extensive industrial development.
In Italy, a large number of studies have been carried out to determine PCBs in human milk. Ingelido et al. (64) analysed pooled milk samples collected in Venice (April 1998 – October 2000) and Rome (January 2000 – July 2001). They found ndl-PCBs (PCB-28, PCB-52, PCB-101, 122, 124, 128, 138, 141, PCB-153, PCB- 170, PCB-180, PCB-183, PCB-187, PCB-194, PCB-206, and PCB-209). The criteria for selecting congeners for analysis were relative profusion in human tissues, toxicological relevance, and distribution in the environment. Mothers from Venice were divided into three groups according to their consumption of marine food to see if there was an association between marine food and PCB exposure. The most abundant was PCB-153, followed by PCB-138 and PCB-180. There was no association between marine food consumption and PCB levels in milk.
Abballe et al. (65) also analysed organochlorine compounds in pooled human milk samples of Venetian and Roman women in 1998–2001 period. They found a decrease in dl-PCBs 77 and 126 of around 52 % compared to the 1987 measurements reported by Schecter et al. (66) and Larsen et al. (67), while dl-PCB-169 showed a small decrease (26 %). Mono-ortho dl-PCBs decreased about 39 % but the dl-PCB-114 decreased the most (62 %). These trends are in agreement with reports from other European countries.
Ulaszewska et al. (68) analysed the levels of 19 PCBs in milk samples collected from in the residents of Giugliano, Milan, and Piacenza from April 2008 to November 2009. The most abundant congeners among dl-PCBs were PCB-170, PCB-118, and PCB-156, while PCB-153, PCB-180, and PCB-138 were the most abundant among the indicator PCBs. The most represented classes on all three locations were hexa- and heptachlorines.
The areas of Caserta and Naples in the Italian region of Campania had long suffered heavy environmental contamination with dl-PCBs due to a large number illegal waste dumps and the practice of burning waste. This is why Rizzi et al. (69) reported higher levels of dioxins and dl-PCBs in human milk samples from Caserta and Naples compared to those reported for Giugliano, Milan, and Piacenza (68).
human milk samples collected in Rome in 2005-2007 and observed a decreasing trend in view of the previous two studies conducted in 1987 and 2000-2001.
In 2007, Schuhmacher et al. (71) measured PCB levels in the milk collected from women living near a waste incinerator in Catalonia, Spain. The levels of the most toxic congeners, PCB-126 and PCB-169, were 34.8 pg g-1 and 26.1 pg g-1 milk fat, respectively. The highest levels were measured for PCB-53 and PCB-180. The observed decreases in PCB levels corresponded to the reduction in the estimated dietary intake of these pollutants.
In a study with the same population in 2012, Schuhmacher et al. (72) analysed 20 milk samples, whose total PCBs ranged from 26.9 to 405 pg g-1 milk fat (WHO-TEQ 0.71-5.28 pg g-1 milk fat). The decrease in both planar and total PCBs in milk continued. They also reported that milk PCBs in women who lived in urban areas were 26 % higher than in women from the industrial areas (26 %).
In another Spanish study, Gomara et al. (73) measured the levels of 24 PCBs in human milk samples collected from nine women in 2005 and found that the PCB levels were similar to other reports since 2000 but lower than those before 2000. They were also in the range reported for other European countries.
In Croatia, the levels of PCBs in human milk have been monitored for over thirty years. Krauthacker et al. (74) reported that PCBs in samples collected from healthy mothers in urban or semi urban locations in Croatia (Jastrebarsko, Osijek, and Zagreb) decreased about 50 % between 1981 and 1989, while the decrease slowed down between 1990 and 2000. In human milk samples from the island of Krk and Croatian capital Zagreb collected in 2000 PCB levels were similar. The highest levels were reported for PCB-153, PCB-138, and PCB-180 (75).
Klinčić et al. (76) analysed the levels of 20 PCBs in human milk samples collected in Zagreb and the coastal town of Zadar from 2009 to 2011. A comparison with results obtained ten years earlier (75) showed a decreasing trend in the samples collected in Zagreb. Mothers from Zadar had higher TEQ values for mono-ortho PCB congeners. The authors associated greater PCB exposure of women in the Zadar area with the contamination outbreak in the 1990s. The Croatian TEQ values were several times lower than in the Czech Republic and Slovakia. The authors also concluded that infants consuming mothers’ milk were not at risk of adverse effects of the PCBs.
In another Croatian study (77), 20 PCBs were determined in human milk samples collected from 33 multiparas from Zadar in 2011. The most common congeners were 153, 138, 180, and PCB-170. PCB-126 was the most common non-ortho PCB. PCB-153 was the most abundant congener in the milk samples, followed by PCB-180, PCB-138, and PCB-170. These findings placed Croatia at the middle of the PCB ranges in human milk reported for other countries. As the
were below tolerable limit, they posed no risk for mothers and breastfed infants.
So far, Slovenia has not produced a report on PCBs in human milk, but has set up human biomonitoring (78).
In Greece, Costopolou et al. (79) collected human milk and blood serum samples in urban (Athens) and rural (Kozani) areas from 2002 to 2004. PCB levels in blood serum samples were significantly higher in the samples from Athens than from Kozani. Blood and milk levels showed a similar pattern. Overall, however, mean PCBs were lower than those measured in other European countries.
CONCLUSION
Due to their harmful effects on human health, PCB levels in human milk have been monitored in Europe for a long time and a lot of data have been collected during that time, especially since the Stockholm Convention.
Most of the studies focused on the six indicator PCBs because of their large contribution to the AROCLOR commercial mixtures. The most dominant are PCB-138, PCB-153 and PCB-180, while PCB-153 is the most abundant in human milk samples. The most toxic non-ortho PCBs (PCB-77, PCB-81 PCB-126 and PCB-169) have also been regularly monitored in human milk samples. The highest European levels were reported in the Czech Republic and Slovakia, most likely due to heavy industrial production. Croatia is placed somewhere in the mid-range. Thanks to the ban, PCB levels in all European countries are slowly decreasing.
Acknowledgements
This work was financially supported by the project “Organic Pollutants in Environment – Markers and Biomarkers of Toxicity” (OPENTOX), funded by the Croatian Science Foundation (grant No. 8366). We are grateful to Dr Snježana Herceg Romanić and Dr Darija Klinčić for very useful advice during the writing of this article.
Conflicts of interest
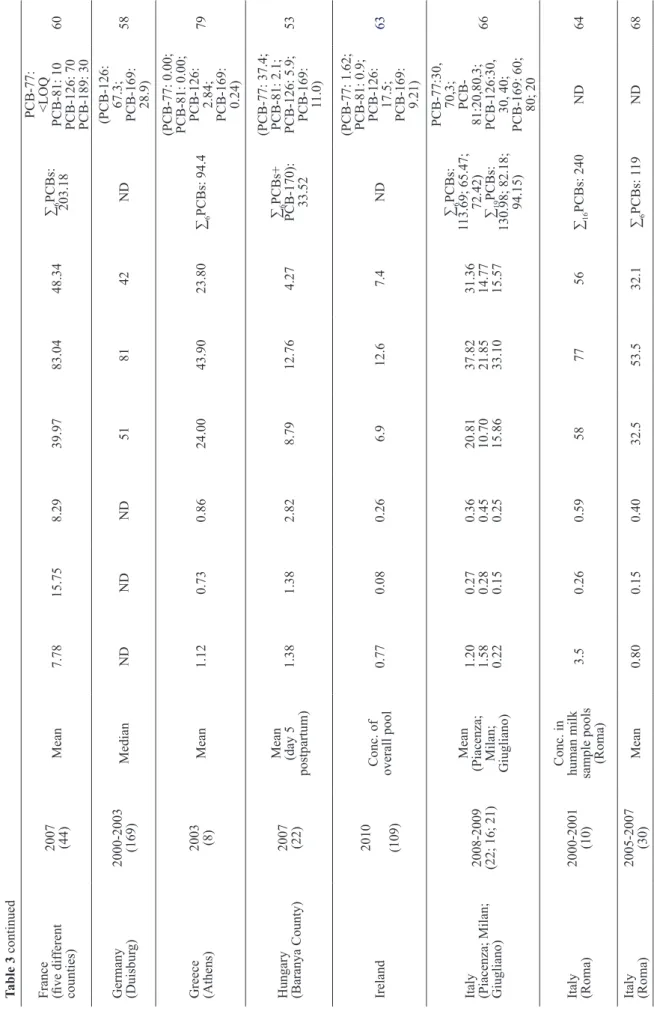
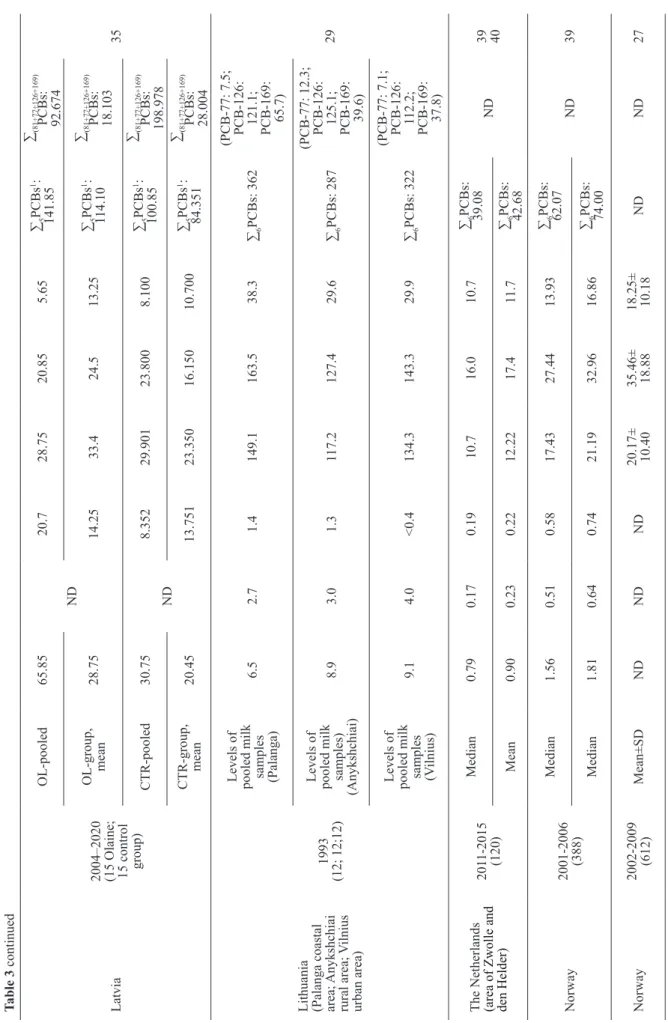
Table 3
Levels of the six indicator PCBs, ∑
n
PCBs, and non-ortho PCBs acr
oss Eur
ope
Country (Locations) Time of collection (No. of samples)
Data type Six indicator PCBs (ng g -1 milk fat) PCBs (∑n PCBs; n=number) (ng g -1 milk fat) non -orth o
PCBs [the most toxic: PCB-77; PCB-81; PCB-a126 and PCB-169; (pg g -1 milk fat)] Ref. PCB-28 PCB-52 PCB-101 PCB-138 PCB-153 PCB-180
Belgium (the rural areas in Flanders) 2009-2010 (84) Levels of pooled samples
0.88 0.23 0.39 18.7 32.8 17.2 ∑6 PCBs: 70.2 ND 61 Croatia (Zagreb) 2002-2003 (20) Median 7 8 0 26 29 13 ∑6 PCBs: 121 ND 74 Croatia (Zagreb, Krk) 2000 (29; 23) Median (Zagreb) 8.3 12.5 2.6 33.1 41.5 13.2 ∑6 PCBs: 120 <LOD 75 Median (Krk) 10.5 10.4 2.9 32.6 38.8 19.4 ∑6 PCBs: 123 <LOD
Croatia (Zagreb, Zadar)
2009-201 1 (20; 18) Median (Zagreb) 3.4 3.0 0.2 7.4 12.7 6.4 ND <LOD 76 Median (Zadar) 2.0 2.9 0.2 12.0 22.3 8.3 <LOD Croatia (Zadar) 201 1 (33) Median <LOD 1.6 <LOD 4.9 12.6 7.0 ∑6 PCBs: 27.5 (PCB-77: <LOD; PCB- 126: 13; PCB- 169: <LOD) 77
Czech Republic (various regions) 1994-2009 (4753) Median 2.5 2.5 1.5 132 182 137 ND ND 43 Mean 9.57 25.71 3.86 159.5 221.8 168.6
Czech Republic (seven urban areas) 1999-2000 (14, Uherske Hradište) Median 5.07 0.53 1.57 437 646 455 ∑6 PCBs: 1457 ND 45 Mean±SD 7.06±5.52 0.69±0.48 1.86±1.10 597±444 903±680 539±393 ∑6 PCBs: 2046±494 Faroe Islands 1987, 1994/95, 1999 (10) Parallel pooled samples ND ND ND 490/510, 380/370, 420/420 570/610, 420/410, 470/470 380/400, 250/240, 270/270 ∑11 PCBs: 2200/2400; 1600/1600; 1800/1800 ND 38
France (Southern France) 2002-2005 (69) Median 6 ND 10.2 54.1 59 35.6 ∑7 PCBs: 166.8 ND 59
Table 3
continued
France (five dif
ferent counties) 2007 (44) Mean 7.78 15.75 8.29 39.97 83.04 48.34 ∑6 PCBs: 203.18 PCB-77: <LOQ PCB-81: 10 PCB-126: 70 PCB-189: 30 60 Germany (Duisbur g) 2000-2003 (169) Median ND ND ND 51 81 42 ND (PCB-126: 67.3; PCB-169: 28.9) 58 Greece (Athens) 2003 (8) Mean 1.12 0.73 0.86 24.00 43.90 23.80 ∑6 PCBs: 94.4 (PCB-77: 0.00; PCB-81: 0.00; PCB-126: 2.84; PCB-169: 0.24) 79
Hungary (Baranya County) 2007 (22) Mean (day 5 postpartum) 1.38 1.38 2.82 8.79 12.76 4.27 ∑6 PCBs+ PCB-170): 33.52 (PCB-77: 37.4; PCB-81: 2.1; PCB-126: 5.9; PCB-169: 11.0) 53 Ireland 2010 (109) Conc. of overall pool
0.77 0.08 0.26 6.9 12.6 7.4 ND (PCB-77: 1.62; PCB-81: 0.9; PCB-126: 17.5; PCB-169: 9.21) 63
Italy (Piacenza; Milan; Giugliano) 2008-2009 (22; 16; 21)
Mean
(Piacenza; Milan; Giugliano)
1.20 1.58 0.22 0.27 0.28 0.15 0.36 0.45 0.25 20.81 10.70 15.86 37.82 21.85 33.10 31.36 14.77 15.57 ∑6 PCBs: 113.69; 65.47; 72.42) ∑PCBs: 19 130.98; 82.18; 94.15) PCB-77:30, 70,3; PCB-81:20,80,3; PCB-126:30, 30, 40; PCB-169: 60; 80; 20 66 Italy (Roma) 2000-2001 (10) Conc. in
human milk sample pools (Roma)
3.5 0.26 0.59 58 77 56 ∑16 PCBs: 240 ND 64 Italy (Roma) 2005-2007 (30) Mean 0.80 0.15 0.40 32.5 53.5 32.1 ∑6 PCBs: 1 19 ND 68
Table 3
continued
Latvia
2004–2020 (15 Olaine; 15 control group)
OL-pooled 65.85 ND 20.7 28.75 20.85 5.65 ∑5 PCBs 1: 141.85 ∑(81+77+126+169) PCBs: 92.674 35 OL-group, mean 28.75 14.25 33.4 24.5 13.25 ∑5 PCBs 1: 114.10 ∑(81+77+126+169) PCBs: 18.103 CTR-pooled 30.75 ND 8.352 29.901 23.800 8.100 ∑5 PCBs 1: 100.85 ∑(81+77+126+169) PCBs: 198.978 CTR-group, mean 20.45 13.751 23.350 16.150 10.700 ∑5 PCBs 1: 84.351 ∑(81+77+126+169) PCBs: 28.004
Lithuania (Palanga coastal area;
Anykshchiai rural area; V ilnius urban area) 1993 (12; 12;12)
Levels of pooled milk samples (Palanga)
6.5 2.7 1.4 149.1 163.5 38.3 ∑6 PCBs: 362 (PCB-77: 7.5; PCB-126: 121.1; PCB-169: 65.7) 29
Levels of pooled milk samples) (Anykshchiai)
8.9 3.0 1.3 117.2 127.4 29.6 ∑6 PCBs: 287 (PCB-77: 12.3; PCB-126: 125.1; PCB-169: 39.6)
Levels of pooled milk samples (Vilnius)
9.1 4.0 <0.4 134.3 143.3 29.9 ∑6 PCBs: 322 (PCB-77: 7.1; PCB-126: 112.2; PCB-169: 37.8)
The Netherlands (area of Zwolle and den Helder)
201 1-2015 (120) Median 0.79 0.17 0.19 10.7 16.0 10.7 ∑6 PCBs: 39.08 ND 39 40 Mean 0.90 0.23 0.22 12.22 17.4 11.7 ∑6 PCBs: 42.68 Norway 2001-2006 (388) Median 1.56 0.51 0.58 17.43 27.44 13.93 ∑6 PCBs: 62.07 ND 39 Median 1.81 0.64 0.74 21.19 32.96 16.86 ∑6 PCBs: 74.00 Norway 2002-2009 (612) Mean±SD ND ND ND 20.17± 10.40 35.46± 18.88 18.25± 10.18 ND ND 27
Table 3
continued
Norway (Tromsø; Oslo Grünnerlřkka; Oslo Sřndre Nordstrand) 2000–2001 (10, 10, 9) Median (Tromsø) 2.3 0.4 0.8 35 52 22 ∑6 PCBs: 1 12 ND 28 Mean (T romsø) 2.4 0.5 0.9 36 53 23 ∑6 PCBs: 1 15 Median (Oslo GRÜ) 2.0 0.2 0.8 40 54 26 ∑6 PCBs: 125 ND Mean (Oslo GRÜ) 2.4 0.3 0.7 39 52 26 ∑6 PCBs: 1 19 Median (Oslo SNO) 3.4 0.2 0.7 36 46 21 ∑6 PCBs: 108 ND Mean (Oslo SNO) 3.9 0.2 0.8 34 44 20 ∑6 PCBs: 102
Norway (Tromsø coastal area; Hamar rural area; Skien/ Porsgrunn industrial area) 1992-1993 (10; 10; 10) Levels of pooled milk samples (Tromsø)
7.4 4.0 0.6 88.7 127.5 44.4 ∑6 PCBs: 273 (PCB-77: 8.5; PCB-126: 150.5; PCB-169: 107.1) 29
Levels of pooled milk samples Hamar
7.6 <0.7 <0.4 86.1 127.9 42.9 ∑6 PCBs: 265 (PCB-77: 5.2; PCB-126: 70.2; PCB-169: 38.9)
Levels of pooled milk samples (Skien/ Porsgrunn)
6.7 2.9 1.1 94.4 140.8 55.7 ∑6 PCBs: 302 (PCB-77: 5.7; PCB-126: 61.7; PCB-169: 48.9)
Poland (Wielkopolska province) 2000-2001 (Primiparae 14; Secundiparae 13) Primiparae Median 0.88 1.13 0 27.0 36.3 16.6 ∑7 PCBs: 90.3 ND 51 Primiparae Mean 0.81 1.1 1 0.03 35.3 45.6 24.4 ∑7 PCBs: 114.8 Secundiparae Median 0.92 1.06 0 20.7 29.5 16.9 ∑7 PCBs: 71.7 Secundiparae Mean 0.92 1.1 0.17 28.8 42.1 21.6 ∑7 PCBs: 101.8
Table 3
continued
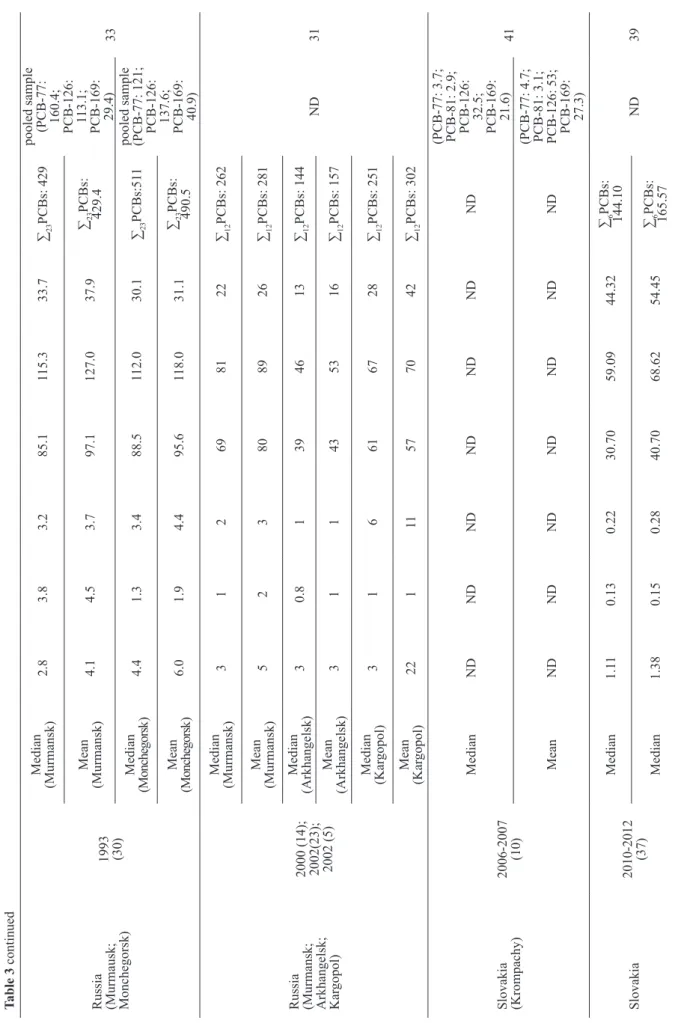
Russia (Murmausk; Monchegorsk)
1993 (30) Median (Murmansk) 2.8 3.8 3.2 85.1 115.3 33.7 ∑23 PCBs: 429 pooled sample (PCB-77: 160.4; PCB-126: 113.1; PCB-169: 29.4) 33 Mean (Murmansk) 4.1 4.5 3.7 97.1 127.0 37.9 ∑23 PCBs: 429.4 Median (Monchegorsk ) 4.4 1.3 3.4 88.5 112.0 30.1 ∑23 PCBs:51 1 pooled sample (PCB-77: 121; PCB-126: 137.6; PCB-169: 40.9) Mean (Monchegorsk ) 6.0 1.9 4.4 95.6 118.0 31.1 ∑23 PCBs: 490.5
Russia (Murmansk; Arkhangelsk; Kar
gopol) 2000 (14); 2002(23); 2002 (5) Median (Murmansk) 3 1 2 69 81 22 ∑12 PCBs: 262 ND 31 Mean (Murmansk) 5 2 3 80 89 26 ∑12 PCBs: 281 Median (Arkhangelsk) 3 0.8 1 39 46 13 ∑12 PCBs: 144 Mean (Arkhangelsk) 3 1 1 43 53 16 ∑12 PCBs: 157
Median (Kargopol)
3 1 6 61 67 28 ∑12 PCBs: 251 Mean (Kar gopol) 22 1 11 57 70 42 ∑12 PCBs: 302 Slovakia (Krompachy) 2006-2007 (10) Median ND ND ND ND ND ND ND (PCB-77: 3.7; PCB-81: 2.9; PCB-126: 32.5; PCB-169: 21.6) 41 Mean ND ND ND ND ND ND ND (PCB-77: 4.7; PCB-81: 3.1; PCB-126: 53; PCB-169: 27.3) Slovakia 2010-2012 (37) Median 1.1 1 0.13 0.22 30.70 59.09 44.32 ∑6 PCBs: 144.10 ND 39 Median 1.38 0.15 0.28 40.70 68.62 54.45 ∑6 PCBs: 165.57
Table 3 continued Spain (Madrid) 2005 (9) Median 0.51 1.6 1.1 12 33 20 ∑24 PCBs: 103 (PCB-77: 320; PCB-81:170; PCB-126: 34; PCB-169: 58) 73 Mean 0.89 1.6 1.8 16 39 22 ∑24 PCBs: 105 (PCB-77: 320; PCB-81:170; PCB-126: 52; PCB-169: 96) Spain (Catalonia) 2012 (20) Mean ND ND ND ND 121 95 ∑37 PCBs: 156 (PCB-126: 16.3; PCB- 169: 17.3) ∑(77,81,126,169) PCBs: 42.9 72
Sweden (Stockholm region) 1972-1997 (135; 40) Concentration of pooled samples
1972 34 4 11 190 215 88 ∑14 PCBs: 1090 ND 20
Concentration of pooled samples
1997 4 0 1 57 73 37 ∑14 PCBs: 324
Sweden (Stockholm region)
1972-201
1
(75; 1
1)
Concentration of pooled samples
1972 ND ND ND ND ND ND ND (PCB-77: 150; PCB-81:17; PCB-126: 240; PCB-169: 92) 24
Concentration of pooled samples
201 1 ND ND ND ND ND ND ND (PCB-77: <14; PCB-81: <1.8; PCB-126: 17; PCB-169: <9.2)
Sweden (Uppsala County) 1996–2006 (335)
Median
1.8
most samples <LOQ most samples <LOQ
26 52 25 ND PCB-126: 39; PCB-169:20 21 Mean±SD 2.8±3.9
most samples <LOQ most samples <LOQ
29±13
58±28
28±13
ND
Table 3
continued
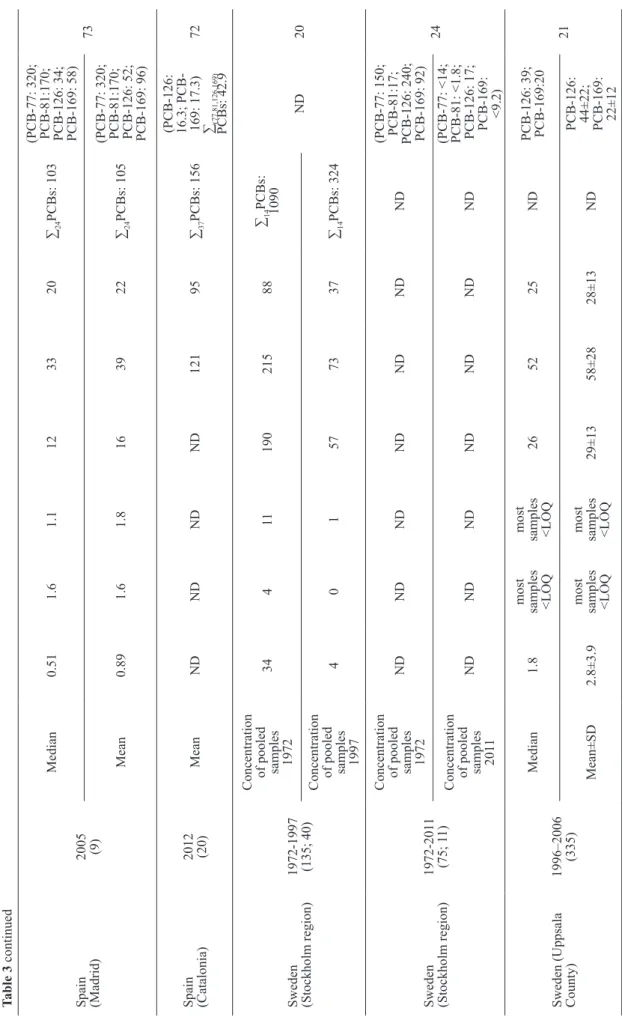
Sweden (Uppsala University Hospital) 2008 and 2010 (31, 30) Median (2008) 1.2 0.12 0.31 17 32 16 d i -orth o PCB: 69 PCB-77: 2.6; PCB-81: 0.71; PCB-126: 21; PCB-169: 14 22 Mean (2008) 1.9 0.16 0.35 21 36 18 di -orth o PCB: 76 PCB-77:4.1; PCB-81:0.92; PCB-126: 25; PCB-169: 17 Median (2010) 0.98 0.13 0.33 14 24 13 d i -ort ho PCB: 50 PCB-77:1.9; PCB-81:0.86; PCB-126: 19; PCB-169: 12 Mean (2010) 1.4 0.16 0.40 16 27 32 di -orth o PCB: 65 PCB-77:4.2; PCB-81: 0.95; PCB-126: 20; PCB-169: 13
Ukraine (Kyiv; Dneprodzerzhinsk) 1993-1994 (200) Pooled human milk samples
(N=51) <30 year (Kyiv) ND ND ND ND ND ND ND PCB-126: 106; PCB-169: 35 36
Pooled human milk samples (N=49) 30+ year (Kyiv) ND ND ND ND ND ND ND PCB-126: 1 18; PCB-169: 44
Pooled human milk samples
(N=51) <30 year (Dnepro dzerzhinsk
) ND ND ND ND ND ND ND PCB-126: 141; PCB-169: 32
Pooled human milk samples
(N=49) 30+ years (Dnipro dzerzhinsk
) ND ND ND ND ND ND ND PCB-126: 177; PCB-169: 45
Table 3
continued
United Kingdom (London; Lancaster) 2001-2003 (27; 27) Median 2.0 ND ND 37 49 25 ∑15 PCBs: 180 ND 62 non-ortho PCBs (the most toxic congeners): PCB-77, PCB-81, PCB-126, PCB-169. 1∑ 5 PCBs: The results of PCB congener CB-52 level ar e excluded from the total data of the gr oup to avoid possible higher results because of the overlapping of chr omatography peaks (35). ∑6 PCBs: six indicator PCBs: PCB-28, PCB-52, PCB-101, PCB-138, PCB-153, and PCB-180. ∑7 PCBs: six indicator PCBs and PCB-1 18 (51, 59). ∑12 PCBs: (PCB-105, PCB-1 18, PCB-128/PCB-167, PCB-138, PCB-146, PCB-153, PCB-156, PCB-170, PCB-180, PCB-183, and PCB-187) (38). Σ12 PCBs: (PCB-28, PCB-52, PCB-74, PCB-99, PCB-101, PCB-128, PCB-138, PCB-153, PCB-170, PCB-180, PCB-187, and PCB-194) (31). ∑14 PCBs: PCB-28, PCB-52, PCB-101, PCB-105, PCB -1 14, PCB -118, PCB-138, PCB-153, PCB-156, PCB-157, PCB-167, PCB -170/ PCB -190 and PCB-180) (20). ∑15 PCBs: PCB -28, PCB -74, PCB -99, PCB-105, PCB-1 18, PCB-138, PCB-153, PCB-156, PCB-167, PCB-170, PCB-180, PCB-183, PCB-187, PCB-194 and PCB-203) (62). ∑16 PCBs: PCB -28, PCB-52, PCB-101, PCB-122, PCB-124, PCB-128, PCB-138, PCB-141, PCB-153, PCB-170, PCB-180, PCB-183, PCB-187, PCB-194, PCB-206 and PCB-209) (64). ∑19 PCBs: dl-PCBs + six PCBs indicator congeners: PCB-28, PCB-52, PCB-81, PCB-77, PCB-101, PCB-123, PCB-1 18, PCB-1 14, PCB-105, PCB-126, PCB-153, PCB-138, PCB-167, PCB-156, PCB-157, PCB-169, PCB-180, PCB-170, and PCB-189 (66). ∑23 PCBs: PCB-28, PCB-52, PCB-66, PCB-74, PCB-99, PCB-101, PCB-105, PCB-110, PCB-1 14, PCB-1 18, PCB-128, PCB-138, PCB-141, PCB-149, PCB-153, PCB-156, PCB-157, PCB-170, PCB-180, PCB-187, PCB-194, PCB-206, and PCB-209 (33). ∑24 PCBs: PCB-28, PCB-52, PCB -77, PCB - 81, PCB -95, PCB -101, PCB -105, PCB -1 14, PCB -1 18, PC B-123, PCB -126, PCB -132, PCB -138, PCB -149, PC B-153, PCB -156, PCB -157, PCB -167, PCB -169, PCB -170, PCB -180, PCB-183, PCB-189, and PCB-194 (73). ∑37 PCBs: PCB-18, PCB-28/31, PCB-33, PCB-47, PCB-49, PCB-51, PCB-52, PCB-60, PCB-66, PCB-74, PCB-77, PCB-81, PCB-99, PCB-101, PCB-105, PCB-1 10, PCB-1 14, PCB-1 18, PCB-122, PCB-123, PCB-126, PCB-128, PCB-138, PCB-141, PCB-153, PCB-156, PCB-157, PCB-167, PCB-169, PCB-170, PCB-180, PCB-183, PCB-187, PCB-189, PCB-194, PCB-206, and PCB-209 (72). di-ortho PCBs : sum of PCB-153, PCB-138, and PCB-180 (76). ND - not determined and no data; LOD - limit of determination; LOQ - limit of quantification
1. Skaare JU. Distribution of persistent organic pollutants (POPs) in Arctic mammals. In: Grotmol T, Bernhoft A, Eriksen GS, Flaten TP, editors. Endocrine Disrupters. Oslo: The Norwegian Academy of Science and Letters; 2006. p.
25-8.
2. World Health Organization (WHO) European Environment and Health Information System. Persistent Organic Pollutants in Human Milk, 2009 [displayed 24 May 2018]. Available at http://www.euro.who.int/__data/assets/pdf_ file/0003/97032/4.3.-Persistant-Organic-Pollutantsm-EDITED_layouted_V2.pdf
3. Malisch K, Malisch R, Fiedler H. UNEP-coordinated Survey of Human Milk for Persistent Organic Pollutants. Guidelines for Organization, Sampling and Analysis, 2017 [displayed 24 May 2018]. Available at http://www.ua-bw.de/uploaddoc/ c v u a f r / U N E P _ G u i d a n c e _ H u m a n M i l k 2 0 1 6 _ Final_2017_01_11_corr03_02_17.pdf
4. Fång J, Nyberg E, Winnberg U, Bignert A, Bergman Å. Spatial and temporal trends of the Stockholm Convention POPs in mothers’ milk - a global review. Environ Sci Pollut Res 2015;22:8989-9041. doi: 10.1007/s11356-015-4080-z
5. Herceg Romanić S. Poliklorirani bifenili i organoklorovi pesticida s posebnim osvrtom na njihovu prisutnost u iglicama crnogoričnog drveća [Organochlorine compounds in needles of coniferous trees, in Croatian]. Arh Hig Rada Toksikol 2002;53:21-30.
6. Agency for Toxic Substances and Disease Registry (ATSDR). Toxicological Profile for Polychlorinated Biphenyls (PCBs), 2000 [displayed 24 May 2018]. Available at https://www. atsdr.cdc.gov/toxprofiles/tp17.pdf
7. Kožul D, Herceg Romanić S. Razine i raspodjela PCB-a i organoklorovih pesticide u zraku, borovim iglicama i majčinu mlijeku [Levels and distribution of pcbs and organochlorine pesticides in the air, pine needles, and human milk, in Croatian]. Arh Hig Rada Toksikol 2010;61:339-56. doi:
10.2478/10004-1254-61-2010-2007
8. Mills SA, Thal DI, Barney J. A summary of the 209 PCB congener nomenclature. Chemosphere 2007;68:1603-12. doi: 10.1016/j.chemosphere.2007.03.052
9. Ross G. The public health implications of polychlorinated biphenyls (PCBs) in the environment. Ecotox Environ Safe 2004;59:275-91. doi: 10.1016/j.ecoenv.2004.06.003
10. Krauthacker B. Koncentracije organoklorovih spojeva u biološkom materijalu u skupini ispitanika u Hrvatskoj i procjena unosa tih spojeva u organizam [Levels and daily intakes of organochlorine compounds in population groups in Croatia, in Croatian]. Arh Hig Rada Toksikol 2000;51(Suppl):75-87.
11. Srogi K. Levels and congener distributions of PCDDs, PCDFs and dioxin-like PCBs in environmental and human samples: a review. Environ Chem Lett 2008;6:1-28. doi: 10.1007/s10311-007-0105-2
12. Van den Berg M, Birnbaum Linda S, Denison M, De Vito M, Farland W, Feeley M, Fiedler H, Hakansson H, Hanberg A, Haws L, Rose M, Safe S, Schrenk D, Tohyama C, Tritscher A, Tuomisto J, Tysklind M, Walker N, Petersonq RE. The 2005 World Health Organization reevaluation of human and mammalian toxic equivalency factors for dioxins and dioxin-like compounds. Toxicol Sci 2006;93:223-41. doi: 10.1093/ toxsci/kfl055
Organization re-evaluation of TEFs for dioxins and dioxin-like compounds - What are the consequences for German human background levels? Int J Hyg Envir Heal 2007;210:335-9. doi: 10.1016/j.ijheh.2007.01.038
14. Tesar C. POPs: What they are; how they are used; how they are transported. Northern Perspect 2000;26:2-5.
15. Kmetič I, Murati T, Kvakan K, Ivanjko M, Šimic B. Poliklorirani bifenili - toksičnost i rizici [Polychlorinated biphenyls - toxicity and risks, in Croatian]. Croat J Food Sci Technol 2012;4:71-80.
16. Grandjean P, Landrigan PJ. Neurobehavioural effects of developmental toxicity.Lancet Neurol 2014;13:330-8. doi: 10.1016/ S1474-4422(13)70278-3
17. Conference of the Parties to the Stockholm Convention on Persistent Organic Pollutants, Sixth meeting Geneva, 28 April - 10 May 2013.
18. Hodak Kobasić V, Picer M, Picer N. The fate of polychlorinated biphenylsin karstic soil. Int J Environ Res 2015;9:567-74.
19. Van den Berg M, Kypke K, Kotz A, Tritscher A, Lee S, Magulova K, Fiedler H, Malisch R. WHO/UNEP global surveys of PCDDs, PCDFs, PCBs and DDTs in human milk and benefit-risk evaluation of breastfeeding. Arch Toxicol 2017;91:83-6. doi: 10.1007/s00204-016-1802-z
20. Noren K, Meironyte D. Certain organochlorine and organobromine contaminants in Swedish human milk in perspective of past 20-30 years. Chemosphere 2000;40:1111-23. doi: 10.1016/S0045-6535(99)00360-4
21. Lignell S, Aune M, Darnerud PO, Cnattingius S, Glynn A. Persistent organochlorine and organobromine compounds in mother’s milk from Sweden 1996-2006: Compound-specific temporal trends. Environ Res 2009;109:760-7. doi: 10.1016/j. envres.2009.04.011
22. Lignell S, Aune M, Glynn A, Cantillana T, Fridén U. Levels of persistent halogenated organic pollutants (POP) in mother’s milk from first-time mothers in Uppsala, Sweden – results from 2008/2010 and temporal trends 1996-2010. Report to the Swedish EPA (the Health-Related Environmental Monitoring Program) 2012 [displayed 24 May 2018]. Available at https://www.diva-portal.org/smash/get/ diva2:710423/FULLTEXT01.pdf
23. Glynn A, Lignell S, Darnerud PO, Aune M, Halldin Ankarberg E, Bergdahl IA, Barregård L, Bensryd I. Regional differences in levels of chlorinated and brominated pollutants in mother’s milk from primiparous women in Sweden. Environ Int 2011;37:71-9. doi: 10.1016/j.envint.2010.07.003
24. Fång J, Nyberg E, Bignert A, Bergman Å. Temporal trends of polychlorinated dibenzo-p-dioxins and dibenzofurans and dioxin-like polychlorinated biphenyls in mothers’ milk from Sweden, 1972-2011. Environ Int 2013;60:224-31. doi:
10.1016/j.envint.2013.08.019
25. Krysiak-Baltyn K, Toppari J, Skakkebaek NE, Jensen TS, Virtanen HE, Schramm KW, Shen H, Vartiainen T, Kiviranta H, Taboureau O, Brunak S, Main KM. Country-specific chemical signatures of persistent environmental compounds in breast milk. Int J Androl 2010;33:270-8. doi: 10.1111/j.1365-2605.2009.00996.x
26. Antignac JP, Main KM, Virtanen HE, Boquien CY, Marchand P, Venisseau A, Guiffard I, Bichon E, Wohlfahrt-Veje C, Legrand A , Boscher C, Skakkebæk NE, Toppari J, Le Bizec B. Country-specific chemical signatures of persistent organic pollutants (POPs) in breast milk of French, Danish and
10.1016/j.envpol.2016.07.069
27. Forns J, Mandal S, Iszatt N, Polder A, Thomsen C, Lyche JL, Stigum H, Vermeulen R, Eggesbo M. Novel application of statistical methods for analysis of multiple toxicants identifies DDT as a risk factor for early child behavioral problems. Environ Res 2016;151:91-100. doi: 10.1016/j. envres.2016.07.014
28. Polder A, Thomsen C, Lindström G, Lřken KB, Skaare JU. Levels and temporal trends of chlorinated pesticides, polychlorinated biphenyls and brominated flame retardants in individual human breast milk samples from Northern and Southern Norway. Chemosphere 2008;73:14-23. doi: 10.1016/j.chemosphere.2008.06.002
29. Becher G, Skaare JU, Polder A, Sletten B, Rossland OJ, Hansen HK, Ptashekas J. PCDDs, PCDFs, and PCBs in human milk from different parts of Norway and Lithuania. J Toxicol Environ Health 1995;46:133-48. doi:
10.1080/15287399509532024
30. Revich B, Shelepchikov A. Peresistent organic pollutants (POPs) hot spot in Russia. In: Mehmetli E, Koumanova B, editors. The Fate of Persistent Organic Pollutants in the Environment. Dordrecht: Springer; 2008. p. 113-26. doi: 10.1007/978-1-4020-6642-9_9
31. Poldera A, Gabrielsenb GW, Odlandc JØ, Savinovad TN, Tkacheve A, Løkena KB, Skaarea JU. Spatial and temporal changes of chlorinated pesticides, PCBs, dioxins (PCDDs/ PCDFs) and brominated flame retardants in human breast milk from Northern Russia. Sci Total Environ 2008;391:41-54. doi: 10.1016/j.scitotenv.2007.10.045
32. Bobovnikova T, Dibtseva A, Mitroshkov A, Pleskachevskaya G. Ecological assessment of a region with PCB emissions using samples of soil, vegetation breast milk: a case study. Sci Total Environ 1993;139/140:357-64. doi: 10.1016/0048-9697(93)90033-3
33. Polder A, Becher G, Savinova TN, Skaarely JU. Dioxins, PCBs and some chlorinated pesticides in human milk from the Kola Peninsula, Russia. Chemosphere 1998;37:1795-806. doi: 10.1016/S0045-6535(98)00245-8
34. Polder A, Odland JO, Tkachev A, Føreid S, Savinova TN, Skaare JU. Geographic variation of chlorinated pesticides, toxaphenes and PCBs in human milk from sub-arctic and arctic locations in Russia. Sci Total Environ 2003;306:179-95. doi: 10.1016/S0048-9697(02)00492-8
35. Bake MA, Linnika Z, Sudmalis P, Kočan A, Jursa S, Pike A, Ruce M. Assessment of the exposure of breast milk to persistent organic pollutants in Latvia. Int J Hyg Envir Heal 2007;210:483-9. doi: 10.1016/j.ijheh.2007.01.016
36. Gladen BC, Päpke O, Shkyryak-Nyzhnyk ZA, Hryhorczuk DO, Little RE. Polychlorinated dibenzo-p-dioxins, polychlorinated dibenzofurans, and coplanar polychlorinated biphenyls in breast milk from two cities in Ukraine. J Toxicol E n v i r o n H e a l t h A 1 9 9 9 ; 5 8 : 1 1 9 - 2 7 . d o i :
10.1080/009841099157331
37. Gladen BC, Monaghan SC, Lukyanova EM, Hulchiy OP, Shkyryak-Nyzhnyk ZA, Sericano JL, Little RE. Organochlorines in breast milk from two cities in Ukraine. Environ Health Persp 1999;107:459-62. PMCID: PMC1566556
38. Fängström B, Strid A, Grandjean P, Weihe P, Bergman A. A retrospective study of PBDEs and PCBs in human milk from
10.1186/1476-069X-4-12
39. Čechová E, Scheringer M, Seifertová M, Mikeš O, Kroupová K, Kuta J, Forns J, Eggesbø M, Quaak I, de Cock M, van de Bor M, Patayová H, Palkovičová Murínová Ľ, Kočan A. Developmental neurotoxicants in human milk: Comparison of levels and intakes in three European countries. Sci Total E n v i r o n 2 0 1 7 ; 5 7 9 : 6 3 7 - 4 5 . d o i : 1 0 . 1 0 1 6 / j . scitotenv.2016.11.046
40. Čechová E, Seifertová M, Kukučka P, Vojta Š, Quaak I, de Cock M, van de Bor M, Kočan A. An effective clean-up technique for GC/EI-HRMS determination of developmental neurotoxicants in human breast milk. Anal Bioanal Chem 2017;409:1311-22. doi: 10.1007/s00216-016-0059-y
41. Chovancova J, Čonka K, Kočan A, Stachova Sejakova Z. PCDD, PCDF, PCB and PBDE concentrations in breast milk of mothers residing in selected areas of Slovakia. Chemosphere 2011;83:1383-90. doi: 10.1016/j. chemosphere.2011.02.070
42. Bencko V, Černá M, Jech L, Smíd J. Exposure of breast-fed children in the Czech Republic to PCDDs, PCDFs, and dioxin-like PCBs. Environ Toxicol Phar 2004;18:83-90. doi: 10.1016/j.etap.2004.01.009
43. Mikeš O, Čupr P, Kohút L, Krsková A, Černá M. Fifteen years of monitoring of POPs in the breast milk, Czech Republic, 1994-2009: trends and factors. Environ Sci Pollut R 2012;19:1936-43. doi: 10.1007/s11356-012-0798-z
44. Černá M, Bencko V. Polyhalogenated hydrocarbons: Body burden of the Czech and Slovak populations. I. Polychlorinated biphenyls. Cent Eur J Public Heal 1999;7:67-71.
45. Černa M, Bencko V, Brabec M, Šmid J, Krskova A, Jech L. Exposure assessment of breast-fed infants in the Czech Republic to indicator PCBs and selected chlorinated pesticides: Area-related differences. Chemosphere 2010;78:160-8. doi: 10.1016/j.chemosphere.2009.09.062
46. Bencko V, Skulová, Z. Krečmerovác M, Djien Liemd AK. Selected polyhalogenated hydrocarbons in breast milk. Toxicol Lett 1998;96,97:341-5. doi: 10.1016/S0378-4274(98)00091-5
47. Bányiová K, Černá M, Mikeš O, Komprdová K, Sharma A, Gyalpo T, Čupr P, Scheringer M. Long-term time trends in human intake of POPs in the Czech Republic indicate a need for continuous monitoring. Environ Int 2017;108:1-10. doi:
10.1016/j.envint.2017.07.008
48. Černá M, Puklová V, Hanzlíková L, Sochorová L, Kubínová R. 25 years of HBM in the Czech Republic. Int J Hyg Envir Heal 2017;220:3-5. doi: 10.1016/j.ijheh.2016.08.004
49. National Institute of Public Health, Prague. Environmental Health Monitoring System in the Czech Republic. 2015
50. Jaraczewska K, Lulek J, Covaci A, Voorspoels S, Kaluba-Skotarczak A, Drews K, Schepens P. Distribution of polychlorinated biphenyls, organochlorine pesticides and polybrominated diphenyl ethers in human umbilical cord serum, maternal serum and milk from Wielkopolska region, Poland. Sci Total Environ 2006;372:20-31. doi: 10.1016/j. scitotenv.2006.03.030
51. Szyrwinska K, Lulek J. Exposure to specific polychlorinated biphenyls and some chlorinated pesticides via breast milk in Poland. Chemosphere 2007;66:1895-903. doi: 10.1016/j. chemosphere.2006.08.010
52. Hernik A, Góralczyk K, Struciński P, Czaja K, Kucharska A, Korcz W, Snopczyński T, Ludwicki J K. Polybrominated
pesticides in human milk as markers of environmental exposure to these compounds. Ann Agric Environ Med 2011;18:113-8.
53. Vigh E, Colombo A, Benfenati E, Håkansson H, Berglund M, Bódis J, Garai J. Individual breast milk consumption and exposure to PCBs and PCDD/Fs in Hungarian infants: A time-course analysis of the first three months of lactation. Sci Total Environ 2013;449:336-44. doi: 10.1016/j. scitotenv.2013.01.024
54. Furst P, Furst C, Wilmers K. Human milk as a bioindicator for body burden of PCDDs, PCDFs, organochlorine pesticides, and PCBs. Environ Health Persp 1994;102(Suppl 1):187-93. PMCID: PMC1566908
55. Zietz BP, Hoopmann M, Funcke M, Huppmann R, Suchenwirth R, Gierden E. Long-term biomonitoring of polychlorinated biphenyls and organochlorine pesticides in human milk from mothers living in northern Germany. Int J Hyg Envir Heal 2008;211:624-38. doi: 10.1016/j.
ijheh.2008.04.001
56. Raaba U, Schweglera U, Preissb U, Albrechtb M, Fromme H. Bavarian breast milk survey - pilot study and future developments. Int J Hyg Envir Heal 2007;210:341-4. doi:
10.1016/j.ijheh.2007.01.033
57. Raaba U, Albrecht M, Preiss U, Völkel W, Schwegler U, Fromme H. Organochlorine compounds, nitro musks and perfluorinated substances in breast milk - results from Bavarian Monitoring of Breast Milk 2007/8. Chemosphere 2013;93:461-7. doi: 10.1016/j.chemosphere.2013.06.013
58. Wittsiepe J, Furst P, Schrey P, Lemm F, Kraft M, Eberwein G, Winneke G, Wilhelm M. PCDD/F and dioxin-like PCB in human blood and milk from German mothers. Chemosphere 2007;67:S286-94. doi: 10.1016/j.chemosphere.2006.05.118
59. Brucker-Davis F, Wagner-Mahler K, Bornebusch L, Delattre I, Patricia Ferrari P, Gal J, Boda-Buccino M, Pacini P, Tommasi C, Azuar P, Bongain A, Fénichel P. Exposure to selected endocrine disruptors and neonatal outcome of 86 healthy boys from Nice area (France). Chemosphere 2010;81:169-76. doi: 10.1016/j.chemosphere.2010.06.068
60. Focant JF, Fréry N, Bidondo ML, Eppe G, Scholl G, Saoudi A, Oleko A, Vandentorren S. Levels of polychlorinated dibenzo-p-dioxins, polychlorinated dibenzofurans and polychlorinated biphenyls in human milk from different regions of France. Sci Total Environ 2013;452-453:155-62. doi: 10.1016/j.scitotenv.2013.02.057
61. Croes K, Colles A, Koppen G, Govarts E, Bruckers L, Van de Mieroop E, Nelen V, Covaci A, Dirtu AC, Thomsen C, Haug LS, Becher G, Mampaey M, Schoeters G, Van Larebeke N, Baeyens W. Persistent organic pollutants (POPs) in human milk: A biomonitoring study in rural areas of Flanders (Belgium). Chemosphere 2012;89:988-94. doi: 10.1016/j. chemosphere.2012.06.058
62. Kalantzi OI, Martin F L, Thomas GO, Alcock RE, Tang HR, Drury SC, Carmichael PL, Nicholson JK, Jones KC. Different levels of polybrominated diphenyl ethers (PBDEs) and chlorinated compounds in breast milk from two U.K. Regions. Environ Health Persp 2004;112:1085-91. doi: 10.1289/ehp.6991
63. Pratt IS, Anderson WA, Crowley D, Daly SF, Evans RI, Fernandes AR, Fitzgerald M, Geary MP, Keane DP, Malisch R, McBride J, Morrison JJ, Reilly A, Tlustos C. Polychlorinated dibenzo-p-dioxins (PCDDs), polychlorinated dibenzofurans
milk of first-time Irish mothers: Impact of the 2008 dioxin incident in Ireland. Chemosphere 2012;88:865-72. doi: 10.1016/j.chemosphere.2012.03.095
64. Ingelido AM, Ballard T, Dellatte E, di Domenico A, Ferri F, Fulgenzi AR, Herrmann T, Iacovella N, Miniero R, Papke O, Grazia Porpora M, De Felip E. Polychlorinated biphenyls (PCBs) and polybrominated diphenyl ethers (PBDEs) in milk from Italian women living in Rome and Venice. Chemosphere 2007;67:S301-6. doi: 10.1016/j.chemosphere.2006.05.111
65. Abballe A, Ballard TJ, Dellatte E, di Domenico A, Ferri F, Fulgenzi AR, Grisanti G, Iacovella N, Ingelido AM, Malisch R, Miniero R, Grazia Porpora M, Risica S, Ziemacki G, De Felip E. Persistent environmental contaminants in human milk: Concentrations and time trends in Italy. Chemosphere 2008;73:S220-7. doi: 10.1016/j.chemosphere.2007.12.036
66. Schecter A, di Domenico A, Turrio-Baldassarri L, Ryan JJ. Dioxin and dibenzofuran levels in the milk of women from four geographical regions in Italy as compared to levels in other countries. Organohalogen Compounds 1992;9:227-30.
67. Larsen BR, Turrio-Baldassarri L, Nilsson T, Iacovella N, di Domenico A, Montagna M, Facchetti S. Toxic PCB congeners and organochlorine pesticides in Italian human milk. Ecotox Environ Safe, 1994;28:1-13. doi: 10.1006/ eesa.1994.1029
68. Ulaszewska MM, Zuccato E, Capri E, Iovine R, Colombo A, Rotella G, Generoso C, Grassi P, Melis M, Fanelli R. The effect of waste combustion on the occurrence of polychlorinated dibenzo-p-dioxins (PCDDs), polychlorinated dibenzofurans (PCDFs) and polychlorinated biphenyls (PCBs) in breast milk in Italy. Chemosphere 2011;82:1-8. doi: 10.1016/j.chemosphere.2010.10.044
69. Rivezzi G, Piscitelli P, Scortichini G, Giovannini A, Diletti G, Migliorati G, Ceci R, Rivezzi G, Cirasino L, Carideo P, Black DM, Garzillo Carmine, Giani U. A general model of dioxin contamination in breast milk: Results from a study on 94 women from the Caserta and Naples areas in Italy. Int J Env Res Pub He 2013;10:5953-70. doi: 10.3390/ ijerph10115953
70. Alivernini S, Battistelli CL, Turrio-Baldassarri L. Human milk as a vector and an indicator of exposure to PCBs and PBDEs: Temporal trend of samples collected in Rome. B Environ Contam Tox 2011;87:21-5. doi:
10.1007/s00128-011-0262-7
71. Schuhmacher M, Kiviranta H, Ruokojärvi P, Nadal M, Domingo JL. Concentrations of PCDD/Fs, PCBs and PBDEs in breast milk of women from Catalonia, Spain: A follow-up study. Environ Int 2009;35:607-13. doi: 10.1016/j.
envint.2008.12.003
72. Schuhmacher M, Kiviranta H, Ruokojärvi P, Nadal M, Domingo JL. Levels of PCDD/Fs, PCBs and PBDEs in breast milk of women living in the vicinity of a hazardous waste incinerator: Assessment of the temporal trend. Chemosphere 2013;93:1533-40. doi: 10.1016/j.chemosphere.2013.07.071
73. Gómara B, Herrero L, Pacepavicius G, Ohta S, Alaee M, González MJ. Occurrence of co-planar polybrominated/ chlorinated biphenyls (PXBs), polybrominated diphenyl ethers (PBDEs) and polychlorinated biphenyls (PCBs) in breast milk of women from Spain. Chemosphere 2011;83:799-805. doi: 10.1016/j.chemosphere.2011.02.080
74. Krauthacker B, Votava-Raić A, Herceg Romanić S, Tješić-Drinković D, Tješić-Tješić-Drinković Do, Reiner E. Persistent
over two decades. Arch Environ Contam Toxicol 2009;57:616-22. doi: 10.1007/s00244-009-9301-3
75. Herceg Romanić S, Krauthacker B. Organochlorine pesticides and PCB congeners in human milk from two population groups in Croatia. B Environ Contam Tox 2006;76:705-11. doi: 10.1007/s00128-006-0977-z
76. Klinčić D, Herceg Romanić S, Matek Sarić M, Grzunov Letinić J, Dukić B. Polychlorinated biphenyls and organochlorine pesticides in human milk samples from two regions in Croatia. Environ Toxicol Phar 2014;37:543-52. doi: 10.1016/j.etap.2014.01.009
M, Grzunov Letinić J, Brajenović N. Organochlorine pesticides and PCBs (including dl-PCBs) in humanmilk samples collected from multiparae from Croatia and comparison with primiparae. Environ Toxicol Phar 2016;45:74-9. doi: 10.1016/j.etap.2016.05.002
78. Perharic L, Vracko P. Development of national human biomonitoring programme in Slovenia. Int J Hyg Envir Heal 2012;215:180-4. doi: 10.1016/j.ijheh.2011.10.014
79. Costopoulou D, Vassiliadou I, Papadopoulos A, Makropoulos V, Leondiadis L. Levels of dioxins, furans and PCBs in human serum and milk of people living in Greece. Chemosphere 2006;65:1462-9. doi: 10.1016/j.chemosphere.2006.04.034
Razine polikloriranih bifenila u uzorcima ljudskog mlijeka u europskim zemljama
Poliklorirani bifenili (PCB) dobro su poznati, dugo primjenjivani spojevi koji su štetni za ljudsko zdravlje. Ljudi su im uglavnom izloženi putem hrane budući da su to spojevi koji se dugo zadržavaju u okolišu. Kad dospiju u ljudski organizam zbog lipofilnog svojstva, vežu se za masti. Danas je njihova upotreba u mnogim zemljama zabranjena. Određivanje tih spojeva u uzorcima ljudskog mlijeka ima velike prednosti s obzirom na to da je uzorkovanje mlijeka neinvazivna tehnika, a samo mlijeko, zbog lipofilnog svojstva, medij pogodan za određivanje izloženosti čovjeka PCB-ima. Najveće razine PCB-a u ljudskome mlijeku izmjerene su u urbanim područjima koja su bila u blizini industrijskih pogona. Od europskih zemalja, najveće razine PCB-a u ljudskom mlijeku pronađene su u Češkoj i Slovačkoj. U ovom radu prikazani su podaci o raspodjeli i razinama PCB-a u uzorcima majčina mlijeka u europskim zemljama u kojima se već godinama kontinuirano smanjuje njihova koncentracija.