Corresponding author. Phone: +62 274 895920,
Fax: +62 274 896439; Email address : [email protected]
CAPILLARY ELECTROPHORETIC ANALYSIS OF LOW-MOLECULAR-MASS OF CA
SPECIES IN PHLOEM SAP OF Ricinus communis
L.
Noor Fitri
a,b,*, Björn Thiele
b, Klaus Günther
band Buchari
c aDepartment of Chemistry, Indonesian Islamic University, Jl. Kaliurang Km 14.4 Besi Sleman Yogyakarta 55584 Indonesia
b
Institute for Chemistry and Dynamics of the Geosphere: ICG-III Phytosphere Research Centre Juelich, D-52425 Juelich, Germany,
c
Department of Chemistry, Bandung Institute of Technology, Jl Ganesha Bandung, Indonesia
Received 9 March 2006; Accepted 1 June 2006
ABSTRACT
A capillary electrophoretic (CE) analysis with ultra-violet (UV) detection was performed for further separation of
low-molecular-mass (LMM) calcium species in phloem sap of Ricinus communis L. Two different background
electrolytes (BGE) were used for the separation; these are (1) hydrogen phosphate/dihydrogen phosphate buffer containing cetyltrimethylammonium bromide (CTAB) as an electro-osmotic flow (EOF) modifier, and (2) boric acid buffer containing CTAB. Various parameters affecting the analysis, including the composition and pH of the BGE were systematically studied. The sensitivity, resolution, baseline noise, migration time of the species peaks, and reproducibility of the method were evaluated under optimised condition. At least 13 UV-active species were optimally separated within about ten minutes. The optimised measurement condition was also achieved using 10 mM hydrogen phosphate/10 mM dihydrogen phosphate containing 0.5 mM CTAB at pH 8.0 as BGE, and by applying voltage of -20 kV and temperature of 14°C. Evidently, the analytical method was successfully used for the separation
of LMM calcium species in phloem sap ofR. communis L.
Keywords:capillary electrophoresis, calcium species, phloem sap,Ricinus communis.
INTRODUCTION
Calcium is an ubiquitous element in plants, playing an important role during plant growth and development, e.g. for signaling molecule, stabilising membranes, and in cross linking within the wood structure [1,2]. To establish the biochemical functions of Ca in plant system, it is crucial to understand the binding forms of the element. Knowledge about the nature of the chemical species of calcium is of immense importance when determining bioavailability and the biological impact of calcium. Several recent studies on Ca binding form in plant tissues were done [3-7] however, the Ca binding form in phloem sap in Ricinus communis L. is still lack of data.
In analytical chemistry, the specific binding form could be elucidated by elemental speciation. The term elemental speciation is recommended by International Union of Pure and Applied Chemistry (IUPAC) to be understood as the distribution of defined chemical species of an element in a system whereas speciation analysis denotes the measurement of the quantities of one or more individual chemical species in a sample [8]. Combination and hyphenation of separation technologies and element- or molecule selective detection systems are generally the basis for speciation analysis.
Capillary electrophoresis (CE) is a well separation technique due to the ability to separate a wide range of analytes from large biomolecules to small inorganic ions. It is able to separate positive, neutral, and negative ions in a single run with high separation efficiency. By comparing with liquid chromatography (LC), this method is a simple and fast separation technique, requires only small sample (few nanoliters) and small amounts of reagents, and low costs of capillary columns [9-11].
On application of CE to species separation, care has be taken that the species are not altered by CE conditions such as the concentration and pH of buffer, complexing agents, or high voltage [9]. Therefore, to optimise the CE conditions is crusial thing for elemental speciation.
This study is focused on the speciation of low-molecular-mass of Ca species in phloem sap of R.
Communisusing CE analysis. The purpose of this work
EXPERIMENTAL SECTION
Materials and Instrumentation
The chemical materials were obtained from Merck (Darmstadt, Germany), Riedel de Haen (Seelze, Germany), and the NAP-5 column containing Sephadex G-25 DNA from Amersham, Biosciences (Germany). The materials were in highest purity and they can be directly used without further purification. All solutions and electorolytes were prepared using ultrapure water (18
MΏ cm resistance). Plant material and sampling of the
phloem sap of R. communis L. have been done as previously described in [12].
The Capillary Electrophoretic (CE) analysis was performed using a Agilent CE G 1600 A system, a product of Agilent, Chapel Hill, NC, USA. This Agilent CE system essentially consists of a photo-diode array detector and a 50-position autosampler. Autosampler vials were purchased from Agilent (USA). The species separation was carried out on fused silica capillaries (Chromatographie Service, Langerwehe, Germany) with a total length of 68.5 cm (an effective length to the detector = 60 cm) and an internal diameter of 75 µm. The polyimide coating at the detector window was burned off with a lighter.
Molecular weight fractionation and Ca determination
Molecular weight fractionation. Size fractionation of
phloem sap components (500 µL) was performed with a Sephadex G-25 M column equilibrated with a mix buffer containing 20 mmol/L Tris-HCl, 20 mmol/L NaCl, and 1 mmol/L NaN3. The buffer was adjusted to the pH of 8.0
by addition sodium hydroxide 50% and degassed in an ultrasonic bath for 15 minutes before used. The selected operating parameters for the chromatographic separation are shown in Table 1.
Calcium determination. Calcium concentration was
determined using the ELAN 6100 ICP QMS (Perkin Elmer, Norwalk, USA). A 50 µL aliquot of each fraction was diluted to 3 mL and aspirated to ICP QMS. Indium was applied in ICP QMS sample as an internal standard element. The ICP QMS operational conditions are summarised as described in [12].
Capillary electrophoretic Electrolytes and CE-sample preparations
Electrolyte preparation. Two different background
electrolytes (BGE) were used in the separation; these are (1) hydrogen phosphate/dihydrogen phosphate buffer containing cetyltrimethylammonium bromide (CTAB) as a electro-osmotic flow (EOF) modifier, and (2) boric acid buffer containing CTAB, which are referred to as “BGE I” and “BGE II”, respectively. A 200 mM electrolyte concentrate was prepared and the pH of the
solution was adjusted to 7.5, 8.0, 8.5 and 9.0 using 1.0 M NaOH before the total volume was brought to 250 mL. Electrolytes required for the CE analysis were daily prepared by diluting 200 mM electrolyte concentrate using ultrapure water, which contains the appropriate amount of CTAB. The buffers were degassed before used.
Preparation of CE sample. One GPC fraction
containing the highest concentration of low-molecular-mass of calcium species was diluted using ultrapure water to 40-folds to achieve the appropriate concentrations.
Tabel 1.The parameter of the SEC system
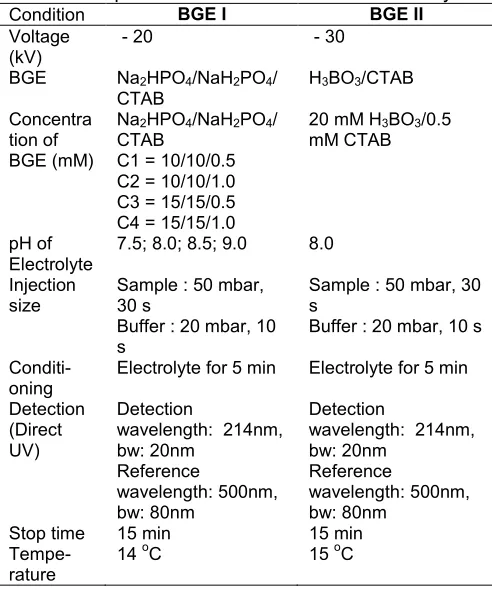
Table 2.Experimental conditions for the CE analysis
Condition BGE I BGE II
Voltage (kV)
- 20 - 30
BGE Na2HPO4/NaH2PO4/
CTAB
H3BO3/CTAB
Concentra tion of BGE (mM)
Na2HPO4/NaH2PO4/
CTAB
C1 = 10/10/0.5 C2 = 10/10/1.0 C3 = 15/15/0.5 C4 = 15/15/1.0
20 mM H3BO3/0.5
mM CTAB
pH of Electrolyte
7.5; 8.0; 8.5; 9.0 8.0
Injection size
Sample : 50 mbar, 30 s
Buffer : 20 mbar, 10 s
Sample : 50 mbar, 30 s
Buffer : 20 mbar, 10 s
Conditi-oning
Electrolyte for 5 min Electrolyte for 5 min
Detection (Direct UV)
Detection
wavelength: 214nm, bw: 20nm
Reference
wavelength: 500nm, bw: 80nm
Detection
wavelength: 214nm, bw: 20nm
Reference
wavelength: 500nm, bw: 80nm
Stop time 15 min 15 min
Tempe-rature
14oC 15oC
Parameter
Gel Sephadex G-25 M
onation range:
- Globular proteins - Dextrans
5.0 kDa 5.0 kDa
Gel bed dimensions 0.9 cm x 2.8 cm
Flow rate 0.1 ml/min
Eluent 20 mM Tris-HCl/20 mM
NaCl/1 mM NaN3pH 8.0
Fraction volume 100 µL Temperature of the
separation system
Electrophoretic conditions
Conditioning capillary column. The capillary column
was daily treated to obtain a stable baseline. The treatment subsequently used ultrapure water for 10 min, 1 M NaOH for 10 min, followed by ultrapure water for 10 min. Finally, the treatment used the electrophoretic running buffer for 10 min. Before each injection, the capillary column was flushed with the electrolyte for 5 min.
Experimental conditions. The operational
conditions tabulated in Table 2 were used in these experiments.
RESULT AND DISCUSSION
Fractionation of Ca species
Phloem sap of R. communis L. was separated by SEC on a Sephadex G-25 M column using a mix buffer containing 20 mM Tris-HCl/20 mM NaCl/1 mM NaN3 pH
8.0 as the mobile phase. The elution profile of protein standard was used (data not shown) as markers for high and low-molecular-mass compounds in the eluted fractions. The Ca concentration of the fractions were then determined using ICP QMS. Two isotops of Ca were used: Ca 43 and Ca 44. As a result, there are two main groups of Ca species, a small peak at void volume of the column and a big one in the low-molecular-mass. Fraction 19, that containing the highest concentration of Ca, was further analysed using capillary electrophoresis to separate the low-molecular-mass of Ca species. Fig 1 displays a chromatogram of Ca (I), protein and organic compounds (II) of the phloem sap ofR. communis L..
Fig 1. Chromatogram of phloem sap of R. communis
on Sephadex G-25 M (eluent 20 mM Tris-HCl/20 mM NaCl/1 mM NaN3). (I) Ca (II) protein (using Bradford
method) and organic compounds. The concentration of Ca and count of C, P, and S were determined by ICP QMS
min
1 2 3 4 5 6 7 8
mAU
-2 0 2 4 6 8
DAD1 B, Sig=214,20 Ref=500,80 (050616\NFA-1102.D)
min
1 2 3 4 5 6 7 8
mAU
-2 0 2 4 6 8
DAD1 B, Sig=214,20 Ref=500,80 (050620\NFA-1309.D) BGE I
BGE II
min
1 2 3 4 5 6 7 8
mAU
-2 0 2 4 6 8
DAD1 B, Sig=214,20 Ref=500,80 (050616\NFA-1102.D)
min
1 2 3 4 5 6 7 8
mAU
-2 0 2 4 6 8
DAD1 B, Sig=214,20 Ref=500,80 (050620\NFA-1309.D) BGE I
BGE II
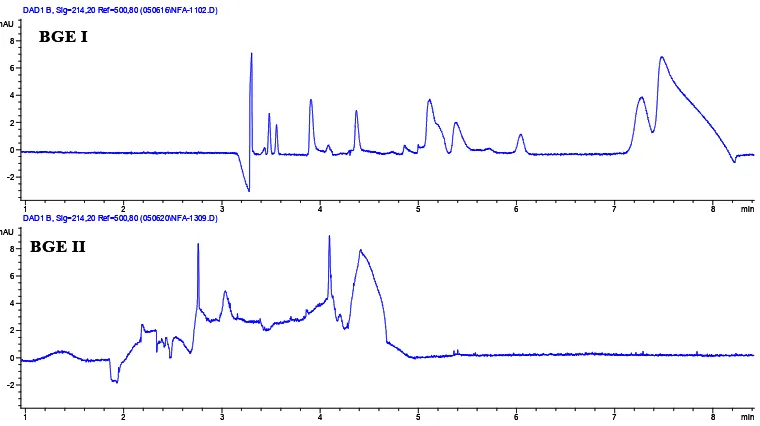
Fig 2. Electropherograms of LMM Ca species in phloem sap of R. communis with two BGEs.
min
DAD1 B, Sig=214,20 Ref=500,80 (050616\NFA-1102.D)
min
DAD1 B, Sig=214,20 Ref=500,80 (050616\NFA-1105.D)
min
DAD1 B, Sig=214,20 Ref=500,80 (050616\NFA-1112.D)
min
DAD1 B, Sig=214,20 Ref=500,80 (050616\NFA-1110.D)
C 1
DAD1 B, Sig=214,20 Ref=500,80 (050616\NFA-1102.D)
min
DAD1 B, Sig=214,20 Ref=500,80 (050616\NFA-1105.D)
min
DAD1 B, Sig=214,20 Ref=500,80 (050616\NFA-1112.D)
min
DAD1 B, Sig=214,20 Ref=500,80 (050616\NFA-1110.D)
C 1
10/10/0.5, C2: 10/10/1.0, C3: 15/15/0.5, and C4: 15/15/1.0
min
DAD1 B, Sig=214,20 Ref=500,80 (050617\NFA-1203.D)
min
DAD1 B, Sig=214,20 Ref=500,80 (050616\NFA-1102.D)
min
DAD1 B, Sig=214,20 Ref=500,80 (050617\NFA-1205.D)
min
DAD1 B, Sig=214,20 Ref=500,80 (050617\NFA-1207.D)
pH 7.5
DAD1 B, Sig=214,20 Ref=500,80 (050617\NFA-1203.D)
min
DAD1 B, Sig=214,20 Ref=500,80 (050616\NFA-1102.D)
min
DAD1 B, Sig=214,20 Ref=500,80 (050617\NFA-1205.D)
min
DAD1 B, Sig=214,20 Ref=500,80 (050617\NFA-1207.D)
pH 7.5
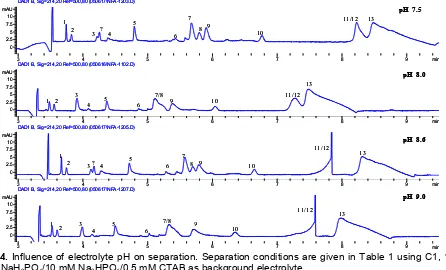
Fig 4. Influence of electrolyte pH on separation. Separation conditions are given in Table 1 using C1, 10
mM NaH2PO4/10 mM Na2HPO4/0.5 mM CTAB as background electrolyte.
BGE Selection
The selection of BGE is critical for the CE analysis. To achieve high separation and detection sensitivity, the mobility of BGE should match as closely as possible to the mobility of the species. Initially, several BGE systems including Tris-HCl, Boric acid, phosphate/CTAB (BGE I) and boric acid/CTAB (BGE II), were evaluated to separate the sample. As a result, most of the species found as anionic compounds. Therefore, the best BGE
system for this sample used cationic surfactant (CTAB) as EOF modifier and then by applying a negative voltage, anionic species co-migrate with the EOF toward the detector situated at the anode end, thus speeding up the analysis. Fig 2 indicates that BGE I has a best resolution for the analysed sample, in comparison to that of BGE II. Therefore, BGE I was considered the most appropriate electrolyte for separation LMM Ca species in phloem sap of R.
BGE Concentration
The variation of concentrations (i.e. C1, C2, C3 and C4) of BGE I consisting of phosphate and CTAB evidently affect the resolution, sensitivity, baseline noise and the migration time of the peaks (Fig 3). Different concentrations of phosphate and CTAB used in the experiments are presented in Table 2. The solution used in these experiments was adjusted to pH 8.0. As shown by Fig 3, the increase of BGE I concentration indicates an increase of the resolution of the species peaks. For instance, at C3 and C4 (15 mM phosphate), peaks 11 and 12 were slightly separated, in comparison to C1 and C2 (10 mM phosphate) only one peak was detected. Particularly for peaks 7 and 8, they were well-separated at C3, however, the sensitivity of peak 6 was very low. There are two hypothesis for this result : (1) C3 was the optimal BGE concentration to separate peaks 7 and 8. However by increasing the CTAB concentration at the same concentration of phosphate (C4), peaks 7 and 8 were slightly separated as shown at C1 and C2. This may suggest that the micelles were formed at concentration of 1.0 mM CTAB. Therefore the optimal concentration for CTAB was 0.5 mM. This optimal concentration enables to reverse the direction of EOF.
Consequently, an increase of the BGE concentration increases the migration time of species, due to an enhancement of ionic strength in the electrolyte, which causes a reduction of EOF. For instance, the migration time of peak 13 at C1 is about 7.6 min and it is shifted to be 9.4 min at C4.
Based on the results of migration time, sensitivity, and reproducibility of all of the peaks, the C1, 10 mM NaH2PO4/10 mM Na2HPO4/0.5 mM CTAB is considered
as the optimal BGE concentrations in the separation of low-molecular-mass calcium species in the phloem sap
of R. communis L. The “final” optimal concentration,
however, should take into account in which peak the calcium species is detected. The detection of calcium species can be performed using CE-ICPMS.
Influence of pH
In capillary electrophoresis, ionic species are separated on the basis of their charge and size. This suggests that the pH of BGE has a significant effect in their separation. In this experiment, the pH of the used electrolyte was arranged from 7.5 to 9.0 (Fig 4). Each peak has a unique appearance at different pH values. For instance, at pH 7.5 and pH 8.6, peaks 7 and 8 were well separated, however, the migration time of the species increases and the reproducibility of the peaks 11/12 and 13 appears to be not optimal. The peaks at pH 8.0 generally exhibit a good resolution, although that of peaks 7 and 8 is not quite separated. In a base condition, there was a disturbance at the peaks 11 and 12, portraying these peaks are unstable in this pH condition. By considering the migration time and reproducibility of the peaks, the pH 8.0 is chosen to be
an optimum pH condition. This indicates that the pH 8.0 may represent the natural pH for phloem sap of R.
communis L.
CONCLUSION
By considering the migration time, sensitivity, and reproducibility of the peaks of detected species, the most optimal conditions for the separation of low-molecular-mass of calcium species in the phloem sap
of R. communis were achieved using BGE I
concentration C1 (10 mM NaH2PO4/10 mM
Na2HPO4/0.5 mM CTAB) at pH 8.0. However, the
“final” optimal condition should consider in which peak the calcium species is detected. The combination of CE with ICP MS might provide a powerful tool for elemental speciation.
Due to the poor baseline, resolution, and reproducibility of BGE II (H3BO3/CTAB), this electrolyte
is not recommended to be used for separation of low-molecular-mass of calcium species in the phloem sap
ofR. communis.
REFFERENCES
1. McLaughlin, S.B., and Wimmer, R., 1999,Tansley
Review New Phytol.142, 373 – 417.
2. Bush, D.S., 1995, Annu. Rev. Plant Physiol. Plant
Mol. Biol.46, 95 – 122.
3. Du, W., Wang, Y., Liang, S.P., and Lu, Y.T., 2005,
Plant Sci.168, 5:1181-1192.
4. Turner, W.L., Waller, J.C., Vanderbeld, B., and Snedden, W.A., 2004, Plant Phys., 135,. 3:1243-1255.
5. Zhang, L., Liu, B.F., Liang, S.P., Jones, R.L., and Lu, Y.T.. 2002,Biochem. J.,368:145-157.
6. Yoo, B. C., Lee, J. Y., and Lucas, W. J.. 2002, J.
Biol. Chem.277, 18:15325-15332.
7. Yuasa, K. and Maeshima, M., 2000, Plant Physiol.
124, 3:1069-1078.
8. Templeton D..M, Ariese F., Cornelis R., Danielsson L.G., Muntau, H., Van Leeuven. H.P., Lobinski. R, 2000,Pure Appl.Chem.72: 1453-1470.
9. Cornelis, R.C., Crews, H.M., Caruso, J.A., and Heumann, K.G., 2003, Handbook of Elemental
Speciation: Techniques and Methodology, Wiley,
London, 1.
10. Michalke, B., 2003,Ecotoxic. & Env. Safety, 56, 1, 122-139.
11. Caruso, J.A., Klaue, B., Michalke, B., and Rocke, D.M., 2003,Ecotoxic. & Env. Safety56, 1, 32-44. 12. Arifudin, N.F., Thiele, B., Günther, K., Schurr, U.,
2004,Calcium Speciation in Phloem sap of Ricinus communis by Size Exclusion Chromatography
Coupled Off Line to ICP-QMS.In the Proceeding of