REGIONAL GEOLOGICAL MAPPING IN THE GRAHAM LAND OF ANTARCTIC
PENINSULA USING LANDSAT-8 REMOTE SENSING DATA
Amin Beiranvand Poura,b, Mazlan Hashima*, Yongcheol Parkb
a
Geoscience and Digital Earth Centre (INSTeG) Universiti Teknologi Malaysia (UTM) 81310 UTM Skudai, Johor Bahru, Malaysia
b
Korea Polar Research Institute (KOPRI)
Songdomirae-ro,Yeonsu-gu, Incheon 21990, Republic of Korea *Corresponding author: [email protected]
KEY WORDS: Landsat-8; Remote sensing data; geological mapping; Antarctic Peninsula
ABSTRACT:
Geological investigations in Antarctica confront many difficulties due to its remoteness and extreme environmental conditions. In this study, the applications of Landsat-8 data wereinvestigated to extract geological information for lithological and alteration mineral mapping in poorly exposed lithologies in inaccessible domains such in Antarctica. The north-eastern Graham Land, Antarctic Peninsula (AP) was selected in this study to conduct a satellite-based remote sensing mapping technique. Continuum Removal (CR) spectral mapping tool and Independent Components Analysis (ICA) were applied to Landsat-8 spectral bands to map poorly exposed lithologies at regional scale. Pixels composed of distinctive absorption features of alteration mineral assemblages associated with poorly exposed lithological units were detected by applying CR mapping tool to VNIR and SWIR bands of Landsat-8. Pixels related to Si-O bond emission minima features were identified using CR mapping tool to TIR bands in poorly mapped and unmapped zones in north-eastern Graham Land at regional scale. Anomaly pixels in the ICA image maps related to spectral features of Al-O-H, Fe, Mg-O-H and CO3 groups and well-constrained lithological attributions from felsic to mafic rocks were detected using VNIR, SWIR and TIR datasets of Landsat-8. The approach used in this study performed very well for lithological and alteration mineral mapping with little available geological data or without prior information of the study region.
1. INTRODUCTION
Remote sensing satellite imagery has high potential to provide a solution to overcome the difficulties and limitations associated with geological field mapping and mineral exploration in Antarctic environments. To date, a few studies used remote sensing satellite data for lithological and alteration mineral mapping in the Antarctica.
Landsat-8 was launched on 4 February 2013, carrying the Operational Land Imager (OLI) and the Thermal Infrared Sensor (TIRS) sensors. These two instruments collect image data for nine visible, near-infrared, shortwave infrared bands and two longwave thermal bands (Roy et al., 2014). They have high signal to noise (SNR) radiometer performance, enabling 12-bit quantization of data allowing for more bits for better land-cover characterization. Landsat-8 provides moderate-resolution imagery, from 15 meters to 100 meters of Earth’s surface and Polar Regions.
Landsat-8 data have been used for geological mapping and mineral exploration around the world (Ali and Pour, 2014; Pour and Hashim, 2015a,b; Han and Nelson, 2015; Mwaniki et al., 2015). However, Landsat-8 imagery has not been evaluated for lithological mapping in Polar Regions, yet. High radiometric sensitivity in the Landsat-8 TIRS bands has high potential for mapping exposed lithological units in Polar Regions through variation in temperature as felsic to mafic rocks show a
modified response to solar heating due to different mineral compositions (Roy et al., 2014).
In this research, the north-eastern Graham Land, Antarctic Peninsula (AP) was selected to conduct a remote sensing satellite-based mapping approach to detect poorly exposed lithological units and alteration mineral assemblages in the Antarctic environments. The main objectives of this study is to introduce and test the most suitable image processing techniques for detecting poorly exposed lithologies and alteration mineral assemblages in inaccessible regions without prior information or little available geological data of the study area (such Antarctic environments) using Landsat-8 and reflective and thermal bands.
2. MATERIALS AND METHODS
2.1 Geology of the study area
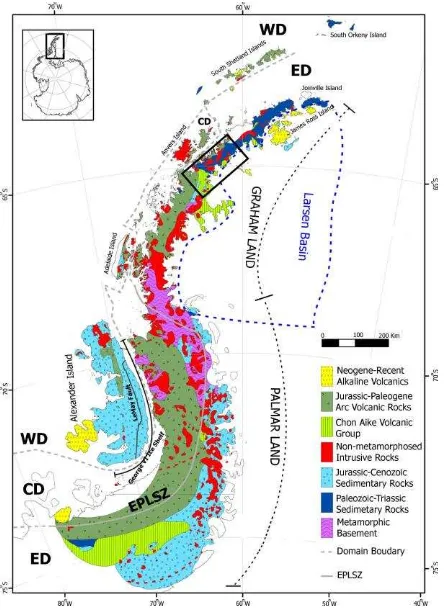
The Antarctic Peninsula (AP) is the most accessible region and largest tectonic block of West Antarctica that consists of a number of large domains (Fig. 1). Geology of the Antarctic Peninsula is divided into six broad lithological (Fig. 1): (1) the metamorphic basement; (2) Palaeozoic to Triassic sedimentary rocks; (3) Jurassic to Cenozoic sedimentary rocks; (4) non-metamorphosed intrusive rocks; (5) Jurassic to Palaeogene volcanic rocks; and (6) Neogene to Recent alkaline volcanic rocks.
The International Archives of the Photogrammetry, Remote Sensing and Spatial Information Sciences, Volume XLII-4/W5, 2017 GGT 2017, 4 October 2017, Kuala Lumpur, Malaysia
This contribution has been peer-reviewed.
Metamorphic basement is dominantly composed of orthogneisses and metabasites. Palaeozoic–Triassic sedimentary rocks are the oldest sedimentary sequences on the Antarctic Peninsula recording continental extension. Jurassic–Cenozoic sedimentary rocks are Lower Jurassic to Lower Cretaceous turbidite sandstones and conglomerates with minor volcanic rocks, chert and siliceous mudstones form the LeMay Group, the lowest stratigraphic strata on Alexander Island. Non-metamorphosed intrusive rocks are mafic to felsic plutonic rocks with dominantly calc-alkaline continental-margin affinities are prevalent on the Antarctic Peninsula. Volcanic rocks on the Antarctic Peninsula were assigned to the Antarctic Peninsula Jurassic–Palaeogene Volcanic Group. Neogene– Recent alkaline volcanic rocks are distributed along the Antarctic Peninsula. They record a change in eruptive setting from subduction to extensional regimes units (Burton-Johson and Riley, 2015).
Figure 1. Geological map of the Antarctic Peninsula. The study area is demarcated by black rectangle.
2.2 Remote sensing data
A low cloud coverage (2.86 %) level 1T (terrain corrected) Landsat-8 image LC82181062014272LGN00 (Path/Row 218/106) were obtained through the U.S. Geological Survey Earth Resources Observation and Science Center (EROS) (http://earthexplorer.usgs.gov). It was acquired on September 29, 2014 for the northern part of Graham Land, Antarctic Peninsula (AP). The image map projection is Polar Stereographic for Antarctica using the WGS-84 datum. Figure 2 shows Landsat-8 image of the northern part of Graham Land as red-green-blue (RGB) color combination of bands 5, 7 and 10, respectively. The data were processed using the ENVI (Environment for Visualizing Images) version 5.2 and Arc GIS version 10.3 software packages.
Figure 2. Landsat-8 image of the northern part of Graham Land as RGB color combination of bands 5, 7 and 10.
2.3 Data analysis
Continuum Removal (CR) spectral mapping tool and Independent Components Analysis (ICA) were applied to Landsat-8. We applied continuum removal (CR) spectral mapping tool to Landsat-8 (VNIR+SWIR+TIR) bands to normalize reflectance spectra and isolating the absorption bands for detecting pixels related to exposed lithological units and associated alteration mineral assemblages in the study area at regional scale. The continuum is a convex hull fit over the top of a spectrum using straight-line segments that connect local spectra maxima. The first and last spectral data values are on the hull; therefore, the first and last bands in the output continuum-removed data file are equal to 1.0 (Research System, Inc., 2008). Independent component analysis (ICA) was used in this study for detailed mapping of poorly exposed lithologies and alteration mineral zones (anomaly and target detection) in the context of polar environments, where little prior information is available. ICA is used on multispectral or hyperspectral datasets to transform a set of mixed, random signals into components that are mutually independent (Research System, Inc., 2008). It is a statistical method for transforming an observed multidimensional random vector into components that are statistically as independent from each other as possible (Hyvarinen and Oja, 2000).
3. RESULTS AND DISCUSSION
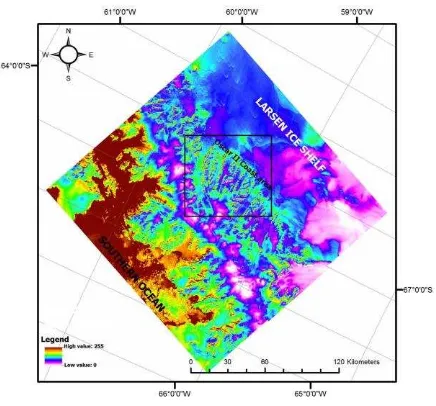
The visual separation of diagnostic absorption feature and thermal emissivity was achieved using a pseudo-color ramp image derived from CR bands 7, 5 and 10 of Landsat-8 at regional scale. Figure 3 shows the image map covering northern part of Graham Land, Antarctic Peninsula (AP). This image map is operative for identifying poorly exposed rock units and minerals based on diagnostic absorption feature related to Al-OH absorption feature at 2.2 μm, Fe, Mg-O-H and CO3 absorption feature at 2.31–2.33 μm absorption features (center
The International Archives of the Photogrammetry, Remote Sensing and Spatial Information Sciences, Volume XLII-4/W5, 2017 GGT 2017, 4 October 2017, Kuala Lumpur, Malaysia
This contribution has been peer-reviewed.
on Landsat-8 band 7), Fe3+ absorption features at 0.83–0.97 μm (center on Landsat-8 band 5), and SiO-bond emission minima features in 10.30-11.70 μm (center on Landsat-8 band 10). Therefore, the choice of Landsat-8 band 7 was made to identify both Al-OH absorption of muscovite and kaolinite and Fe, Mg-O-H and CO3 absorption of epidote, calcite and chlorite. Landsat-8 band 5 was selected as a representative of ferric oxides such as hematite and goethite and charge transfer of Fe ions in amphiboles, pyroxenes and phyllosilicates. Landsat-8 band 10 records the variation of silicate content, which is generally associated with the transition from felsic to mafic lithologies. The image map shows variety of absorption feature and thermal emissivity values and discriminate different geological features such as rock exposures, sea water, glacier and ice shelves at regional scale. Highest absorption feature and thermal emissivity value (dark brown to orange/yellow colors) is associated with rock exposures (Fig. 3) due to iron oxides/clay/carbonate minerals in their compositions and warmer constituents and high emissivity due to silicate content. Hence, brown/orange/yellow colours are indicative of poorly exposed rock areas especially in eastern segment of Figure 3.
Figure 3. Pseudo-color ramp image map (high values as brown/orange and low values as purple/pink) of Landsat-8 CR
bands 7, 5 and 10 covering northern part of Graham Land, Antarctic Peninsula (AP) at regional scale.
For detailed interpretation of Figure 3, a spatial subset scene consisting of rocks exposure covers the Oscar II coast area was selected (Fig. 4). It is evident that the brown color in this image map reflect the presence of high content of muscovite/chlorite and quartz, which are normally associated with quartz-rich and felsic to highly felsic lithological units. The orange/yellow regions match with intermediate/basic rock to quartz-rich units that contain variable content of hematite/goethite or mafic phyllosilicates (Fe, Mg-O-H and CO3) and pyroxenes. The image map derived from CR mapping tool to Landsat-8 imagery (VNIR+SWIR+TIR) could generally show poorly exposed lithologies and major lithological units in the study area at regional scale.
Figure 4. A spatial subset scene consisting of rocks exposure covering Oscar II Coast area.
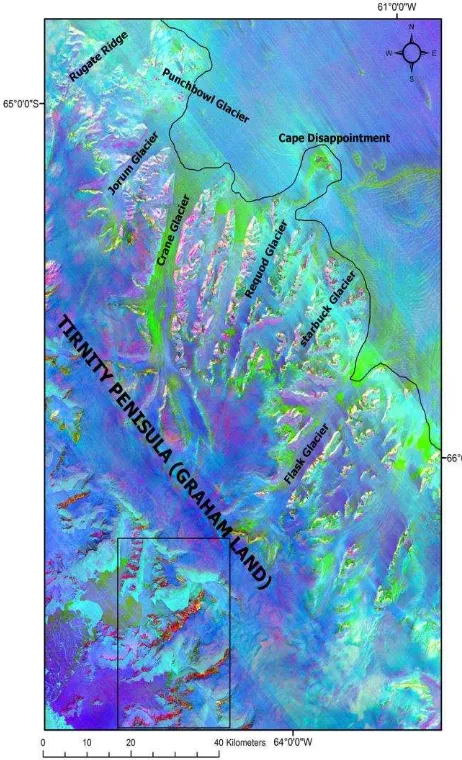
In order to detail discrimination of alteration mineral assemblages and lithological units at regional scale, ICA was applied to Landsat-8 (VNIR+SWIR+TIR bands). IC bands contain anomaly pixels attributed to distinctive spectral features were assigned to RGB color combination for generating image map of poorly exposed lithologies and alteration mineral assemblages in the study area. Figure 5 shows FCC image map of selected spatial subset scene of Landsat-8 covering north-eastern segment of Graham Land (Trinity Peninsula), which is derived from RGB color combination of IC5 (band 6 of Landsat-8), IC6 (band 7 of Landsat-8) and IC7 (band 10 of Landsat-8), respectively. These IC bands were useful for detecting clay minerals and silicate rocks due to presence of anomaly pixels in the bands of Landsat-8. Clay and carbonate minerals have reflectance features in 1.550-1.750 μm (the equivalent of Landsat-8 band 6:1.560-1.660 μm) and absorption features in 2.10- 2.400 μm (the equivalent of Landsat-8 band 7: 2.100- 2.300 μm) (Pour and Hashim, 2014). Silicate minerals show significant variation from 8.50 to 11.70 μm in TIR portion (the equivalent of Landsat-8 band 10: 10.30-11.30 μm).
In the FCC image map of IC5, IC6 and IC7, exposed lithologies are outlined by red, magenta, pink and yellow colors corresponding to the variable content of clay and silicate minerals (Fig. 5). Exposed rocks with high albedo and high content of clay minerals appear red and magenta in colors. Pink and yellow anomaly pixels are considered to indicate rock exposures with moderate albedo and normal content of clay minerals in their composition. With reference to geological map of Oscar II coast area, the high-albedo units and the red and magenta areas match high abundance muscovite regions and highly felsic trend rocks; and yellow and pink zones match chlorite-muscovite assemblages associated with quartz rich to intermediate trend lithological units (Fig. 5). Thus, exposed lithological units located in unmapped regions might be generally classified. For instance, the south western part of the image (inside black rectangle, Fig. 5) is expected to contain high abundance of clay minerals (especially muscovite) and highly felsic to felsic trend lithological units (red and magenta pixels). However, pink and yellow pixels are less distributed in this part of the study area (inside black rectangle, Fig. 5). Glacier and ice shelves represent as green to dark blue
The International Archives of the Photogrammetry, Remote Sensing and Spatial Information Sciences, Volume XLII-4/W5, 2017 GGT 2017, 4 October 2017, Kuala Lumpur, Malaysia
This contribution has been peer-reviewed.
background in Figure 5 due to different emissivity and temperature compare to rocky exposures in IC7 band (TIR band of Landsat-8: band 10).
Figure 5. FCC image map (IC5, IC6 and IC7; VNIR+SWIR+TIR bands) of selected spatial subset scene of
Landsat-8 covering north-eastern segment of Graham Land (Trinity Peninsula).
4. CONCLUSIONS
This investigation has indicated the application of Landsat-8 datasets for extrapolating satellite-based imagery from relatively mapped area such Oscar II coast area, in north-eastern Graham Land, Antarctic Peninsula (AP) into poorly mapped or unmapped (further north and south) domains. Image processing algorithms such as CR spectral mapping tool and ICA mapped pixel related to Al-O-H, Fe, Mg-O-H and CO3 groups and silica content using Landsat-8 and ASTER datasets at regional scale. The approach used in this study performed very well for lithological and alteration mineral mapping with little available geological data or without prior information of the study region.
ACKNOWLEDGEMENTS
This study was conducted as a part of Yayasan Penyelidikan Antartika Sultan Mizan (YPASM) research grant (Vote no: R.J130000.7309.4B221), Sultan Mizan Antarctic Research Foundation, Malaysia. Korea Polar Research Institute (KOPRI) for their great assistance during preparation the manuscript was also acknowledged. We are thankful to the Universiti Teknologi Malaysia for providing the facilities for this investigation.
REFERENCES
Ali, S.O.A., Pour, B. A., (2014). Lithological mapping and hydrothermal alteration using Landsat 8 data: a case study in ariab mining district, red sea hills, Sudan. International Journal of Basic and Applied Sciences. 3 (3),199-208.
Burton-Johnson, A., Riley, T. R. (2015). Autochthonous v. accreted terrane development of continental margins: a revised
in situ tectonic history of the Antarctic Peninsula. Journal of the Geological Society, 172, 822-835.
Han, T., and Nelson, J., (2015). Mapping hydrothermally altered rocks with Landsat 8 imagery: A case study in the KSM and Snowfield zones, north western British Columbia. In: Geological Fieldwork 2014, British Columbia Ministry of Energy and Mines, British Columbia Geological Survey Paper 2015-1, pp. 103-112.
Hyvarinen, A., and E. Oja.
(2000). Independent component analysis: algorithms and applications, Neural Networks, vol. 13, no. 4-5, pp. 411-430.
Mwaniki, M. W., Moeller, M. S., and Schellmann, G. (2015). A comparison of Landsat 8 (OLI) and Landsat 7 (ETM+) in mapping geology and visualising lineaments: A case study of central region Kenya. The International Archives of the Photogrammetry, Remote Sensing and Spatial Information Sciences, Volume XL-7/W3, 2015 36th International Symposium on Remote Sensing of Environment, 11–15 May 2015, Berlin, Germany.
Pour, B.A., Hashim, M., (2015a). Hydrothermal alteration mapping from Landsat-8 data, Sar Cheshmeh copper mining district, south-eastern Islamic Republic of Iran. Journal of Taibah University for Science 9, 155-166.
Pour, B.A., Hashim, M., (2015b). Integrating PALSAR and ASTER data for mineral deposits exploration in tropical environments: a case study from Central Belt, Peninsular Malaysia. International Journal of Image and Data Fusion, 6(2), 170-188.
Pour, B. A., Hashim, M., (2014). ASTER, ALI and Hyperion sensors data for lithological mapping and ore mineral exploration. Springerplus, 3(130), 1-19.
Research Systems, Inc. (2008). ENVI Tutorials. Research Systems, Inc., Boulder, CO.
Roy, D. P., Wulder, M.A., Loveland, T.A., Woodcock, C.E., Allen, R.G., Anderson, M.C., et al. (2014). Landsat-8: Science and product vision for terrestrial global change research. Remote Sensing of Environment 145, 154-17.
The International Archives of the Photogrammetry, Remote Sensing and Spatial Information Sciences, Volume XLII-4/W5, 2017 GGT 2017, 4 October 2017, Kuala Lumpur, Malaysia
This contribution has been peer-reviewed.