LAND USE ANALYSIS ON LAND SURFACE TEMPERATURE IN URBAN AREAS
USING A GEOGRAPHICALLY WEIGHTED REGRESSION AND LANDSAT 8
IMAGERY, A CASE STUDY: TEHRAN, IRAN
Amer Karimi a, Parham Pahlavani a, *, Behnaz Bigdeli b
a School of Surveying and Geospatial Engineering, College of Engineering, University of Tehran b School of Civil Engineering, Shahrood University of Technology, Shahrood, Iran
(amer.karimi, [email protected]; [email protected])
KEY WORDS: Land Surface Temperature, Geographically Weighted Regression, Urban land use, Landsat 8
ABSTRACT:
Due to urbanization and changes in the urban thermal environment and because the land surface temperature (LST) in urban areas are a few degrees higher than in surrounding non-urbanized areas, identifying spatial factors affecting on LST in urban areas is very important. In this regard, due to the unique properties of spatial data, in this study, a geographically weighted regression (GWR) was used to identify effective spatial factors. The GWR is a suitable method for spatial regression issues, because it is compatible with two unique properties of spatial data, i.e. the spatial autocorrelation and spatial non-stationarity. In this study, the Landsat 8 satellite data on 18 August 2014 and Tehran land use data in 2006 was used for determining the land surface temperature and its effective factors. As a result, R value of 0.765983 was obtained by taking the Gaussian kernel. The results showed that the industrial, military, transportation, and roads areas have the highest surface temperature.
1. INTRODUCTION
Rapid urban sprawl and population growth alter the physical properties of the urban land surface, resulting in significant variation in urban thermal environments (S. Li, Zhao, Miaomiao, & Wang, 2010). One of the most familiar local climatic effects is the urban heat island (UHI) phenomenon, in which land surface temperatures (LST) in urban areas are a few degrees higher than in surrounding non-urbanized areas (Xian & Crane, 2005). Urban Heat Islands (UHIs) are emitted from a range of built-up surfaces, when favourable meteorological conditions, i.e. direction and velocity of wind, low water vapour content, are present (Taha, Hammer, & Akbari, 2002). Recent significant advances in the data and technological integration between remote sensing and GIS suggest that the integration is a powerful and effective tool in urban studies. Remote sensing from airborne or satellite platforms cannot only provide thermal infrared data, but also land use and land cover (LULC), building height, and other urban biophysical variables. However, GIS provides powerful capability for entering, analyzing, and displaying digital data from various sources and formats (Xiao et al., 2008). Considerable research has been carried out using remote sensing and GIS to detect thermal characteristics of urban surfaces (S. Li et al., 2010; Pu, Gong, Michishita, & Sasagawa, 2006; Streutker, 2003; Weng, 2001).
* Corresponding author
(Chen, Zhao, Li, & Yin, 2006) used vegetation indices, including Normalized Difference Vegetation Index (NDVI), Normalized Difference Water Index (NDWI), and Normalized Difference Build-up Index (NDBI) to establish correlations between urban surface temperature and LULC. (Xiao et al., 2008) applied regression analysis and principal component analysis to develop the relationships between LST and explanatory variables, including population density and land use factors.
Although global multivariate regression relationships are relatively well-established, the statistical analyses of previous studies have commonly been a spatial, neglecting the locational information associated with each sample site (Foody, 2003). Even though the underlying natural processes are universal, actual spatial patterns will vary with local site conditions (Jetz, Rahbek, & Lichstein, 2005). This phenomenon is often referred to as spatial non-stationarity (S. Li et al., 2010). Generally, the geographical distribution of LST and related factors such as land use/land cover, topographic factors, and population density are characterized by spatial heterogeneity. Conventional regression analysis such as the ordinary least squares (OLS) model is based on the assumption of independence of observations, resulting in failing to capture the spatial dependence of the data when it is applied to geo-referenced data analysis (S. Li et al., 2010).
proposed by Brunsdon and Fotheringham (Brunsdon, Fotheringham, & Charlton, 1998; Charlton, Fotheringham, & Brunsdon, 2009). Compared with some new statistical models such as the linear mixed model, generalized additive model, multi-layer perceptron neural network, and radial basis function neural network, the GWR model can estimate regression coefficients at any one spatial location, and produces better predictive performance for the response variable. In addition, the residuals of the GWR model have more desirable spatial randomness than those derived from other models (Zhang, Gove, & Heath, 2005). The bandwidth selection is an important issue in the application of GWR model because of the sensitivity of GWR results to bandwidth specification (Farber & Páez, 2007).
Although GWR is not problem-free, with concern over issues such as kernel and bandwidth selection, its potential in dealing with spatial non-stationary issues has been validated. Our objective in this paper is to investigate the usability of GWR in modeling the regression relationship between urban land surface temperature and the related influence factors. The paper is organized as follows. In the next section, the general description of the study area is given. In Section 3, data and methods are described, and Section 4 is the implementation and evaluation. The results are discussed in Section 5.
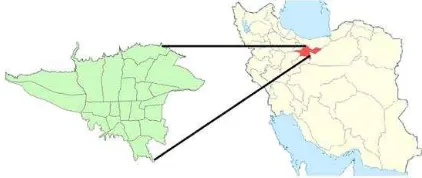
2. STUDY AREA
Tehran, capital of Iran, was selected as the study area for this research (Figure 1). The city is located between the 51°06'E to 51°38'E longitude and 35°34'N to 35°51'N latitudes. The city is located at the southern slopes of the Alborz Mountains to the northern edge of the central desert of Iran. Whatever we move from the south to the north of the city, the heights of the city are added in a way the height of south of the city is 1050 m, and the height of its center is 1200 m and the height of the north of the city is 1800 m to the open sea. By excepting northern Tehran, which has a moderate climate, the rest of the city has warm and dry climate. Tehran is Iran's largest and most populous city with a population of about 11 million that is the twenty-fifth most populous city in the world with an area of about 730 km2. Population growth - the spread of urbanization and changes in the physical properties of the Earth's surface and the city has become a key center for industrial, commercial, and residential. Uncontrolled urban development and the lack of proper planning has a major impact on thermal environment of the city. The changes of land use/land cover patterns cause thermal environmental variation, resulting in the occurrence of UHI effects.
3. DATA AND METHODS
This article is based on a mixture of data and technology between GIS and remote sensing. Remote sensing by airborne or satellite platforms provides thermal infrared data. GIS technology provides powerful capability for entering, analyzing, and displaying digital data from various sources and formats.
3.1 Data
In this study, Landsat 8 images of Tehran, acquired on August 18, 2014, were used to retrieve land surface temperature (LST). By retiring Landsat 5 in early 2013 and leaving Landsat 7 as the only on-orbit Landsat program satellite, Landsat 8 ensures the continued acquisition and availability of Landsat data that utilizes a two-sensor payload, the Operational Land Imager (OLI), and the Thermal InfraRed Sensor (TIRS). Two thermal bands (TIRS) capture data with a minimum of 100 m resolution, but are registered and delivered by the 30 m OLI data product.Layers of land use/land cover, population density, and building density were produced in ArcGIS.
3.1.1 Land Surface Temperature: In recent years, climate change has been one of the most important problems that the ecological system of the world has been encountered (Sekertekin, Kutoglu, Kaya, & Marangoz, 2015). Retrieving LST is crucial for climate change, especially for understanding urban heat islands and local climate changes (Kaya, Basar, Karaca, & Seker, 2012; Voogt & Oke, 1998). LST modulates the air temperature of the lower layer of urban atmosphere, and is a primary factor in determining surface radiation and energy exchange, the internal climate of buildings, and human comfort in the cities (Voogt & Oke, 1998). The physical properties of various types of urban surfaces, their color, the sky view factor, street geometry, traffic loads, and anthropogenic activities are important factors that determine LSTs in the urban environments (Chudnovsky, Ben-Dor, & Saaroni, 2004). Information obtained by the land surface temperature can provide useful information in the study of various phenomena including analysis of urban heat islands, detection of thermal anomalies related to the earthquake, identification of geothermal resources, drought, and fire monitoring (Wan, 1999).
The most commonly LST retrieval algorithms are split-window algorithm (Becker & Li, 1995; J. Sobrino, Li, Stoll, & Becker, 1996), temperature/emissivity separation method (Gillespie et al., 1998), mono-window algorithm (Qin, Karnieli, & Berliner, 2001), and single channel method (Cristóbal, Jiménez‐Muñoz, Sobrino, Ninyerola, & Pons, 2009; Isaya Ndossi & Avdan, 2016; Jiménez-Muñoz et al., 2009; Jiménez‐Muñoz & Sobrino, 2003). Although Landsat 8 images are provided by two thermal bands, in this study to determine LST, a single-channel algorithm was used to calculate the Land Surface Temperature. Since the early 1970s, Landsat satellites constantly recorded multispectral images of the Earth's. Landsat 5 and 7 for thermal studies are
only one thermal band, but Landsat 8 has two thermal bands, although at the moment because of a bug in the band 11, it is recommended to use only one band, the band 10
(Jiménez-Muñoz, Sobrino, Skoković, Mattar, & Cristóbal, 2014;
Tardy et al., 2016). Before calculating the LST, Landsat 8 images require pre-processing to improve their quality that were done in software ENVI.
3.1.1.1 Retrieving brightness temperature from TIRS images Landsat 8: Inverted Planck’s Law is used to transform the at-sensor spectral radiance to at-sensor brightness temperature as follows (Walawender, Szymanowski, Hajto, & Bokwa, 2014):
�=ln �+
(1)
where K1 and K2 = specific thermal band calibration constants, and
� = at-sensor spectral radiance.
The satellite-based digital number is converted to at-sensor spectral radiance (Lλ) using the following equation (Walawender et al., 2014):
�= ��+ � (2)
where = Band-specific multiplicative rescaling factor from the metadata,
�� = Quantized and calibrated standard product pixel values (DN), and
� = Band-specific additive rescaling factor from the metadata.
3.1.1.2 Retrieving Land Surface
Emissivity(LSE): Land surface emissivity (LSE) is a key parameter that describes the radiative absorption power of a surface in the longwave radiation spectrum (Tardy et al., 2016). LSE depends on the target surface top layer composition, such as presence of soil, soil type, vegetation and density, or roughness of the surface (Z.-L. Li et al., 2013; J. A. Sobrino et al., 2008). LSE is the essential criteria in determining the LST. LSE is obtained using the following equation (Z.-L. Li et al., 2013; J. A. Sobrino et al., 2008): ε = εvλ. Pv+ εsλ. 1 − Pv + Cλ (3)
where ε = Land Surface Emissivity, εsλ = emissivity of soil (=0.96),
εvλ = emissivity full vegetation (=0.99), Pv = proportion of vegetation in each pixel calculated using Equation 4, and
Cλ = surface roughness calculated using Equation 5.
Pv= NDVIv+NDVIsNDVI−NDVIs (4)
where NDVI = Normalized Difference Vegetation Index,
NDVIs = minimum NDVI for bare soil (=0.17), and
NDVIv = maximum NDVI for full vegetation (=0.99).
��= 1 − �� . ��. �,. 1 − � (5)
where �,= geometrical factor with the mean value 0.55
3.1.1.3 Retrieving LST (Single-Channel Algorithm): Single-channel algorithms to calculate the LST are the algorithms that estimate the LST using only one thermal band. Equation 6 explains the general trend algorithm used in this article and Equations 6-11 express how to calculate and determine the parameters defined in the algorithm (Jiménez-Muñoz et al., 2009).
= [� � �+ � + � ] + (6) γ = [� �
�� �4
�
� +�]− (7) = − . �+ � (8) � =� (9) � = − ↓− ↑
� (10) � = ↓ (11)
where �= Thermal band effective wavelength, � ��� � = Plank’s radiation constants, � ،�،� = Specific atmospheric function, � = Atmospheric transmissivity,
↓ = down-welling atmospheric radiance, and ↑ = up-welling atmospheric radiance.
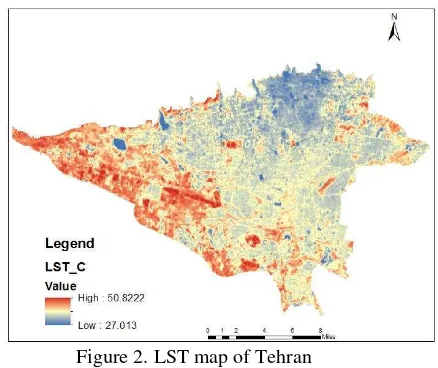
Figure 2 shows land surface temperatures (°C) in Tehran on 18 August 2014 by single-channel algorithm that was implemented in ArcGIS.
Figure 2. LST map of Tehran
wasteland, transport, paved roads, military, and vegetation areas. Land use map is shown in Figure 3.
Figure 3. Land use map of Tehran
3.2 Methods
3.2.1 Geographically Weighted Regression (GWR): Geographically weighted regression is a global regression method proposed by (Brunsdon et al., 1998) for spatial data regression. Spatial data with unique features are a special type of data. Two examples of these features include: a) “Spatial autocorrelation” that represents the inverse relationship of dependency with distance(Tobler, 1970), and b) “Spatial non-stationary” which represents the spatial autocorrelation in space and heterogeneous environment. GWR overall relationship is expressed as follows (Brunsdon et al., 1998):
� = , + ∑� ,
= + (12)
where y = dependent variable, = j-th independent variables
p = the number of independent variables, = the residual of the model,
= regression coefficients that are a function of the location of observation ,
Unlike OLS, GWR is a weighted adjustment method that obtains the regression coefficients through the following equation:
̂ , = � , − � , � (13)
where W = weight matrix, i.e. a function of the position of observation.
In this study we used the following Gaussian weighting kernel function (McMillen & McDonald, 2004):
= φ
�ℎ (14)where φ = the standard normal distribution function,
� = the Euclidean distance between the regression point i and the neighboring observation j.
� = the standard deviation � values for each point, and
ℎ= the bandwidth.
In this study, GWR method was implemented in MATLAB and all raster layers were produced in ArcGIS software
4. RESULTS
The purpose of this study was to examine the effect of land use on LST in the urban environment. Hence, in order to evaluate the effect of different land use on LST, the GWR was used. LST variable in the GWR method is the response or dependent variable and in this study, its map was obtained by using a Landsat satellite imagery and single-channel method in ENVI and ArcGIS. LST was obtained in different areas of Tehran on 18 August 2014 between 27.013°C and 50.822°C. Land use types in GWR method are explanatory variables. Table 1 shows the classification of different types of land uses.
Land use Area (��) Area ratio (%)
residential .
public .
commercial .
industrial .
military .
Transport & Ways 130234981 .
vegetation areas .
Table 1. Classification of different types of land uses
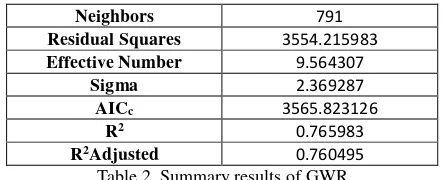
In this study, Gaussian kernel was used in the GWR. Also, cross-validation (CV) method was used to optimize the bandwidth parameters. After running the algorithm, R2 value of 0.7439 was obtained. Summary results of GWR for this study is shown in the Table 2.
Neighbors 791
Residual Squares 3554.215983 Effective Number 9.564307
Sigma 2.369287
AICc 3565.823126
R2 0.765983
R2Adjusted 0.760495
Table 2. Summary results of GWR
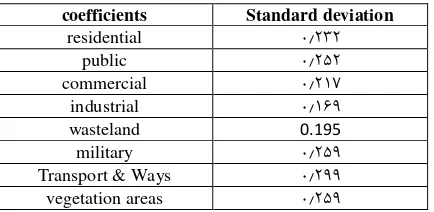
coefficients Standard deviation
Table 3. Standard deviation of regression coefficients
Also, in Table 4, for each type of land use, the minimum temperature, maximum temperature, average temperature, and standard deviation for each type of land use in Tehran has been set. vegetation areas 27.730 40.339 34.209 3.39 Table 4. Summary temperature results for the land uses
5. CONCLUSION
Identification of factors affecting the land surface temperature in urban areas is very important. Because the temperature of cities was higher than the countryside and this phenomena is due to an increase in land surface temperature and thereby creating urban heat islands are happened. The main cause of increase in urban land surface temperature is change in the structure of the Earth's surface or the so-called change of land use/land cover in these areas. Temperature increasement in long-term causes a lot of damage to the urban environment and its inhabitants as well. By identifying effective land use at land surface temperature, better urban planning can be done for urban development and partly can prevent from increasing temperatures and heat island phenomenon in urban areas. In this study, we tried to investigate the effect of land use in urban environments on land surface temperature and for this purpose a geographically weighted regression (GWR) method was used. GWR is a suitable method for spatial regression issues, because GWR considers two special characteristics of spatial data, the spatial autocorrelation and spatial non-stationarity to resolve the issue. In this study, the Gaussian weighting was used in GWR. The results showed that industrial, military, transportation and roads have the greatest impact on land surface temperature increasement. On the other western and south-western areas of Tehran, there were the highest temperature compared to the other regions due to the presence excessive the three types of land uses mentioned above.
REFERENCES
Becker, F., & Li, Z. L. (1995). Surface temperature and emissivity at various scales: Definition, measurement and related problems. Remote Sensing Reviews, 12(3-4), 225-253.
Brunsdon, C., Fotheringham, S., & Charlton, M. (1998). Geographically weighted regression. Journal of the Royal Statistical Society: Series D (The Statistician), 47(3), 431-443.
Charlton, M., Fotheringham, S., & Brunsdon, C. (2009). Geographically weighted regression. White paper. National Centre for Geocomputation. National University of Ireland Maynooth.
Chen, X.-L., Zhao, H.-M., Li, P.-X., & Yin, Z.-Y. (2006). Remote sensing image-based analysis of the relationship between urban heat island and land use/cover changes. Remote sensing of Environment, 104(2), 133-146.
Chudnovsky, A., Ben-Dor, E., & Saaroni, H. (2004). Diurnal thermal behavior of selected urban objects using remote sensing measurements. Energy and Buildings, 36(11), 1063-1074.
Cristóbal, J., Jiménez‐Muñoz, J., Sobrino, J., Ninyerola, M., & Pons, X. (2009). Improvements in land surface temperature retrieval from the Landsat series thermal band using water vapor and air temperature. Journal of Geophysical Research: Atmospheres, 114(D8).
Farber, S., & Páez, A. (2007). A systematic investigation of cross-validation in GWR model estimation: empirical analysis and Monte Carlo simulations.
Journal of Geographical Systems, 9(4), 371-396. Foody, G. (2003). Geographical weighting as a further refinement to regression modelling: An example focused on the NDVI–rainfall relationship.
Remote sensing of Environment, 88(3), 283-293. Gillespie, A., Rokugawa, S., Matsunaga, T., Cothern, J. S.,
Hook, S., & Kahle, A. B. (1998). A temperature and emissivity separation algorithm for Advanced Spaceborne Thermal Emission and Reflection Radiometer (ASTER) images. IEEE transactions on geoscience and remote sensing, 36(4), 1113-1126.
Isaya Ndossi, M., & Avdan, U. (2016). Application of open source coding technologies in the production of land surface temperature (LST) maps from Landsat: A PYQGIS plugin. Remote Sensing, 8(5), 413.
Jetz, W., Rahbek, C., & Lichstein, J. W. (2005). Local and global approaches to spatial data analysis in ecology. Global Ecology and Biogeography, 14(1), 97-98.
Jiménez-Muñoz, J. C., Cristóbal, J., Sobrino, J. A., Sòria, G., Ninyerola, M., & Pons, X. (2009). Revision of the single-channel algorithm for land surface temperature retrieval from Landsat thermal-infrared data. IEEE transactions on geoscience and remote sensing, 47(1), 339-349.
thermal infrared sensor data. IEEE Geoscience and Remote Sensing Letters, 11(10), 1840-1843. Jiménez‐Muñoz, J. C., & Sobrino, J. A. (2003). A
generalized single‐channel method for retrieving land surface temperature from remote sensing data. Journal of Geophysical Research: Atmospheres, 108(D22).
Kaya, S., Basar, U. G., Karaca, M., & Seker, D. Z. (2012). Assessment of urban heat islands using remotely sensed data. Ekoloji, 21(84), 107-113.
Li, S., Zhao, Z., Miaomiao, X., & Wang, Y. (2010). Investigating spatial non-stationary and scale-dependent relationships between urban surface temperature and environmental factors using geographically weighted regression.
Environmental Modelling & Software, 25(12), 1789-1800.
Li, Z.-L., Wu, H., Wang, N., Qiu, S., Sobrino, J. A., Wan, Z., . . . Yan, G. (2013). Land surface emissivity retrieval from satellite data. International Journal of Remote Sensing, 34(9-10), 3084-3127. McMillen, D. P., & McDonald, J. F. (2004). Locally
weighted maximum likelihood estimation: Monte Carlo evidence and an application Advances in spatial econometrics (pp. 225-239): Springer. Pu, R., Gong, P., Michishita, R., & Sasagawa, T. (2006).
Assessment of multi-resolution and multi-sensor data for urban surface temperature retrieval.
Remote sensing of Environment, 104(2), 211-225. Qin, Z., Karnieli, A., & Berliner, P. (2001). A mono-window
algorithm for retrieving land surface temperature from Landsat TM data and its application to the Israel-Egypt border region. International Journal of Remote Sensing, 22(18), 3719-3746.
Sekertekin, A., Kutoglu, S., Kaya, S., & Marangoz, A. (2015). Analysing the Effects of Different Land Cover Types on Land Surface Temperature Using Satellite Data. The International Archives of Photogrammetry, Remote Sensing and Spatial Information Sciences, 40(1), 665.
Sobrino, J., Li, Z., Stoll, M., & Becker, F. (1996). Multi-channel and multi-angle algorithms for estimating sea and land surface temperature with ATSR data.
International Journal of Remote Sensing, 17(11), 2089-2114.
Sobrino, J. A., Jiménez-Muñoz, J. C., Sòria, G., Romaguera, M., Guanter, L., Moreno, J., . . . Martínez, P. (2008). Land surface emissivity retrieval from different VNIR and TIR sensors. IEEE transactions on geoscience and remote sensing, 46(2), 316-327.
Streutker, D. R. (2003). Satellite-measured growth of the urban heat island of Houston, Texas. Remote sensing of Environment, 85(3), 282-289. Taha, H., Hammer, H., & Akbari, H. (2002). Meteorological
and air quality impacts of increased urban surface albedo and vegetative cover in the Greater Toronto Area, Canada. Lawrence Berkeley National Laboratory Report No. LBNL-49210, Berkeley, CA.
Tardy, B., Rivalland, V., Huc, M., Hagolle, O., Marcq, S., & Boulet, G. (2016). A Software Tool for
Atmospheric Correction and Surface Temperature Estimation of Landsat Infrared Thermal Data.
Remote Sensing, 8(9), 696.
Tobler, W. R. (1970). A computer movie simulating urban growth in the Detroit region. Economic geography, 46(sup1), 234-240.
Voogt, J. A., & Oke, T. (1998). Effects of urban surface geometry on remotely-sensed surface temperature.
International Journal of Remote Sensing, 19(5), 895-920.
Walawender, J. P., Szymanowski, M., Hajto, M. J., & Bokwa, A. (2014). Land surface temperature patterns in the urban agglomeration of Krakow (Poland) derived from Landsat-7/ETM+ data.
Pure and Applied Geophysics, 171(6), 913-940. Wan, Z. (1999). MODIS land-surface temperature algorithm
theoretical basis document (LST ATBD). Institute for Computational Earth System Science, Santa Barbara, 75.
Weng, Q. (2001). A remote sensing? GIS evaluation of urban expansion and its impact on surface temperature in the Zhujiang Delta, China.
International Journal of Remote Sensing, 22(10), 1999-2014.
Xian, G., & Crane, M. (2005). Evaluation of urbanization influences on urban climate with remote sensing and climate observations. Paper presented at the Proceedings of the ISPRS joint conference 3rd International Symposium Remote Sensing and Data Fusion Over Urban Areas (URBAN 2005) 5th International Symposium Remote Sensing of Urban Areas (URS 2005) Tempe, AZ.
Xiao, R., Weng, Q., Ouyang, Z., Li, W., Schienke, E. W., & Zhang, Z. (2008). Land surface temperature variation and major factors in Beijing, China.
Photogrammetric Engineering & Remote Sensing, 74(4), 451-461.
Zhang, L., Gove, J. H., & Heath, L. S. (2005). Spatial residual analysis of six modeling techniques.