Land-use induced spatial heterogeneity of soil
hydraulic properties on the Loess Plateau in China
Jannes Stolte
a,*, Bas van Venrooij
a, Guanghui Zhang
b,
Kim O. Trouwborst
a, Guobin Liu
c, Coen J. Ritsema
a, Rudi Hessel
daAlterra Green World Research, Wageningen, The Netherlands b
Department of Resource and Environmental Science, Beijing Normal University, Beijing, PR China
c
Institute for Soil and Water Conservation, Chinese Academy of Sciences and Ministry of Water Resources, Yangling, PR China
d
Department of Physical Geography, Utrecht University, Utrecht, The Netherlands
Abstract
On the Loess Plateau in China, soil erosion amounts to between 10 000 and 25 000 tons/km2/ year. In 1998, the EROCHINA project was started, with the major objective of developing alternative land-use and soil and water conservation strategies for the Loess Plateau, using the LISEM soil erosion model. In order to provide the model with accurate input on soil hydraulic properties of the catchment, this study tried to quantify these properties for major land-use units and to examine the effects of the statistically identified in-field heterogeneity on model outcome. The study area (Danangou catchment) is located in the middle part of the Loess Plateau in the northern part of Shaanxi Province. The catchment is about 3.5 km2 in size. To determine the hydraulic properties of the soil, a sampling scheme was implemented to measure unsaturated conductivity and water retention characteristics. The saturated conductivity measurements were performed on land-use clusters, based on treatment and plant and soil differences. A 100100 m sampling grid was set out on 12 fields, with 11 m grid squares. On each field, 10 sampling spots were randomly selected, using Simple Random Sampling. The sensitivity of the LISEM model to the measured heterogeneity of saturated conductivity was analysed by using the geometric mean and standard deviation (S.D.) of theKs-optimized of the various land-use units to
calculate discharge and soil loss during a single rain event. This proved that, using the standard deviation of the saturated conductivity, which was 30 – 50%, the calculated discharge and total sediment losses varied by a factor 2. Using the standard deviation had a minor effect on the calculated sediment concentration. As regards the on-site effects, the use of the geometric mean of
Ksminus the S.D. resulted in an increase in the level of erosion, while the use of geometric mean
0341-8162/$ - see front matterD2003 Elsevier Science B.V. All rights reserved. doi:10.1016/S0341-8162(03)00057-2
* Corresponding author. Fax: +31-317-419000.
E-mail address:[email protected] (J. Stolte).
ofKsplus the S.D. value resulted in a significant decrease in erosion level relative to that obtained
using the geometric mean ofKsitself. Using randomly selected sampling spots and a calibration
procedure as was done in the present study make detailed information onKsavailable, which can
be used to compare alternative land-use options for their effectiveness in reducing discharge and sediment losses.
D2003 Elsevier Science B.V. All rights reserved.
Keywords:Soil erosion modeling; Loess Plateau
1. Introduction
Spatial and temporal variability of soil hydraulic conductivity are important parameters in soil erosion studies (Springer and Cundy, 1988) and are, in general, difficult to measure. So far, studies have been carried out to determine the spatial or temporal variability in soil physical properties themselves (e.g. Cassel and Nelson, 1985; Mapa et al., 1986; Mallants et al., 1996). Kim and Stricker (1996) concluded that one set of equivalent soil hydraulic characteristics does not accurately capture the effects of (field-scale) spatial heterogeneity on the presence of surface runoff. Sharma et al. (1980) concluded from their experiments at watershed level that there was no obvious pattern in the distribution of infiltration parameters with respect to soil type or position in the watershed.De Roo and Riezebos (1992) used infiltration experiments to show that within-unit variability was higher than between-unit variability, so no statistically significant differences in infiltration characteristics could be detected between the experimental fields they used. Studies on the effects of the variability of soil hydraulic properties, or related parameters such as infiltration rate, show that these properties are key factors in predicting runoff rates (e.g. Singh and Woolhiser, 1976; De Roo et al., 1992). Trends in infiltration properties are crucially important in understanding and predicting Hortonian runoff (Woolhiser et al., 1996).De Roo et al. (1996a) showed that saturated hydraulic conductivity is the most sensitive parameter for a physically based soil erosion model. In-field variation in conductivity character-istics of crusted areas was found to have major effects on calculated runoff (Stolte et al., 1997).
On the Loess Plateau in China, soil erosion amounts to between 10 000 and 25 000 tons/km2/year (Zhang et al., 1998). Of this quantity, 73% ends up in the Huang He (Yellow River), causing enormous problems of sedimentation, as well as flood risks, in downstream areas. In 1998, the EROCHINA project was started, with the major objective of developing alternative land-use and soil and water conservation strate-gies for the Loess Plateau (Ritsema, 2003). To evaluate alternative land-use options, model simulation is carried out using the physically based LISEM soil erosion model
(De Roo et al., 1996b). The model is highly sensitive to saturated hydraulic conductivity
between land-use units, and (iv) examining the effects of the on-field heterogeneity on model outcome.
2. Materials and methods
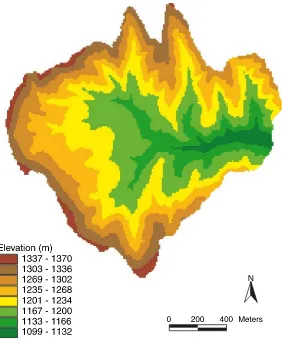
The study area (Danangou catchment) is located in the middle part of the Loess Plateau in the Northern part of Shaanxi Province. The catchment is about 3.5 km2 in size, and drains directly into the Yanhe river. The elevation of the catchment ranges from 1085 to 1370 m above sea level (Fig. 1). A soil survey (Messing et al., 2003) found Calcaric Regosols in theWRB (1998)reference system and Typic Ustorthents according to the Soil Survey Staff (1992) for the stratified loessial soils above 1200 – 1225 m altitude. The stratified loessial soils below 1200 – 1225 m were found to be Calcaric/
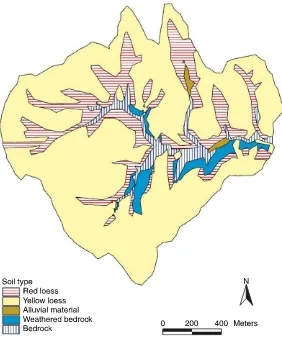
Chromic Cambisols (WRB) and Calcic Ustochrepts/Umbric Fragiochrepts (SSS); the alluvial soils were Calcaric Fluvosols (WRB) and Typic Ustifluvents (SSS); soils with the bedrock at a depth of less than 25 cm or containing little fine earth (skeleton soils) belonged to the Calcaric/Lithic Leptosols (WRB) and Lithic Ustorthents (SSS). The soil map is shown inFig. 2.
At Ansai City, 5 km from the Danangou catchment, average annual rainfall was 513 mm over the period 1971 – 1998 (Ansai County Meteorological Station), of which 72% fell in the period June – September, with an average of three to four thunderstorms each year causing discharge.
In 1999, land use of the Danangou catchment consisted of 41.4% wasteland/wild grassland, 35.4% cropland (mainly maize, millet, potato, and soybean), 13.4% forest/
shrub, 7.3% fallow, 2.4% orchard/cash tree, and 0.1% vegetables (Hessel et al.,
2003a). Average crop coverage was less than 50%, while the wasteland and fallow
areas showed a vegetation coverage of 33%, the shrub 42% and the forest 49%
(Wu et al., 2003). Fallow areas are treated as cropland in spring by the farmers, but no crop is planted during the season, while wasteland is not subjected to any treatment.
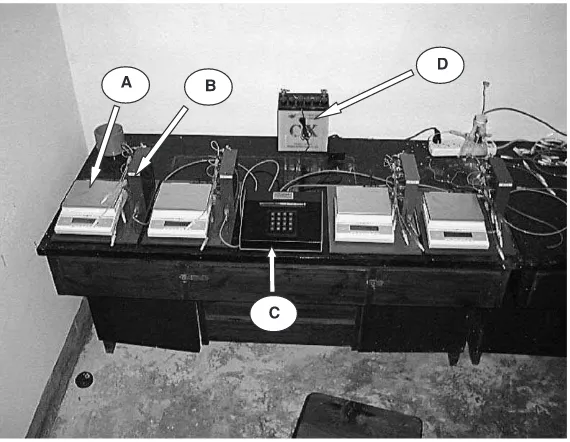
To determine the hydraulic properties of the soil, samples were taken to measure unsaturated conductivity and water retention characteristics and the saturated conduc-tivity. For the unsaturated conductivity and water retention characteristics samples were taken from the top soil layer (0 – 10 cm) at fields representing the various major types of land use in the catchment, on the assumption that these land-use differences would cause differences in overland flow. The major land use types were cropland (four samples), orchard (two samples), wasteland (two samples), shrub (two samples) and woodland (two samples). Deeper soil horizons (10 – 20 cm: four samples, 20 – 100 cm: six samples taken at 30 cm depth) were measured as well, to provide the model with the necessary input data to solve the Richards’ equation for flow in unsaturated soils. Sampling was done in duplicate at each field, taking samples 10 cm in diameter and 8 cm high. The sample cores were carefully closed, sealed and transported to the field station in Ansai City to be measured using the evaporation method (Halbertsma and Veerman, 1994). In this method (Fig. 3), the weight of the sample and the pressure head at four depths (1, 3, 5 and 7 cm from top of sample) are measured simultaneously and automatically while the sample is left to evaporate soil water. These measurements were used to calculate each sample’s water retention and unsaturated hydraulic conductivity characteristics (Wind, 1968). With the
ration equipment, it was possible to measure four samples at a time, with a total measurement period per cycle (i.e. four samples) of about 2 weeks. A fit procedure
(Van Genuchten et al., 1991) was used to describe the hydraulic functions with a set
of Mualem – Van Genuchten equation parameters (Mualem, 1976; Van Genuchten,
1980).
The saturated conductivity measurement was based on a sampling scheme using Simple Random Sampling. This approach to sampling is, together with other types of probability sampling, referred to as the design-based approach (De Gruijter, 1999). In the Simple Random Sampling design, all sample points are selected with equal probability and independently from each other. Sampling was performed on the soil surface of identified land-use types as a result of an overlay of land treatment and plant and soil differences. It was expected that land treatment and plant and soil differences would cause differences in overland flow, as has been shown by Stolte et al. (1996). The land-use types identified in the catchment area, and as such sampled, included cereal, potato, bean on yellow and red loess; orchards on red and yellow loess; forest on red and yellow loess and wasteland and shrub. The latter were present only on yellow loess. On selected 12 fields (each field representing one of the land use types),
a 100100 m square was set out with 11 m grid squares. This sampling square
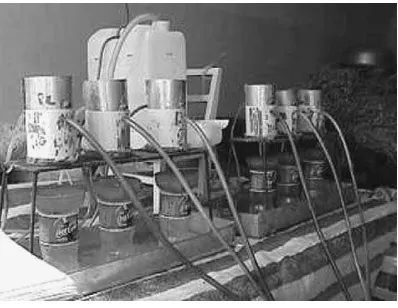
encompassed most of the field area. Ten sampling spots were selected, using randomly selected x and y coordinates for the grid identification. Soil samples were taken carefully from the surface, causing as little disturbance to the top layer as possible. The samples were transported to a shed owned by a local farmer, where equipment for
measuring saturated conductivity had been installed (Fig. 4). The samples were
saturated, and the constant head method was used to measure saturated conductivity
(Stolte, 1997). The one-factor analysis of variance followed by Student t-tests (least significant difference method), was used to evaluate the results of the measurements in terms of significant differences between land-use types. Land-use types were merged to physical units if no significant differences were found. For each of the physical units, the geometric mean of the saturated conductivity was calculated, together with the standard deviation. We used a calibration procedure (Hessel et al., this issue(a)) to optimize the LISEM model results, using fitted saturated conductivity (resulting from the Mualem – Van Genuchten fitting procedure on the data from the evaporation method), as well as measured saturated conductivity. Theoretically, the fitted Ks value
is too low (since the Mualem – Van Genuchten equations do not take the influence of macro-pore flow into account) while the measured Ks is too high (as a result of soil
sample disturbance and cut-through of dead-end pores). The ‘actual’ value of the saturated conductivity (Ks-optimized) lies between these values. Ciollaro and Romano (1995)also recognized that the Kfactor resulting from the Van Genuchten equation is a model parameter rather than an estimate of the saturated conductivity, and proved it to be smaller than measuredKs. The calibration took place for a single rain event and was
based on optimizing the calculated hydrograph and sedigraph on the measured hydro-graph and sedihydro-graph. Validation was done for four other rain events (Hessel et al., 2003a).
Discharge and sediment losses from the Danangou catchment were simulated using
processes incorporated in the model are rainfall, interception, surface storage in micro-depressions, infiltration, vertical movement of water in the soil, overland flow, channel flow, detachment by rainfall and throughfall, transport capacity and detachment by overland flow. The model is one of the first examples of a physically based model that is completely integrated in a raster Geographical Information System. The catchment under study is divided in grid cells of equal sizes. For each grid cell for every time step, rainfall and interception by plants are calculated, after which infiltration and surface storage are subtracted to give net runoff. Subsequently, splash and flow erosion and deposition are calculated using the stream power principle and the water and sediment are routed to the outlet with a kinematic wave procedure. Infiltration can be calculated with various sub-models, according to the data available. In this study, a finite difference solution of the Richards’ equation is used. This includes vertical soil water transport and the change of matric potential in the soil during a rainfall event. For a detailed background description of the model, it is referred to the web-page
http://www.geog.uu.nl/lisem/. The sensitivity of the LISEM model to the measured heterogeneity of the saturated conductivity was analyzed using the geometric mean and standard deviation of the Ks-optimized as input for the various physical units to
calculate discharge and soil loss during a single rain event. This rain event took place on July 20, 1999, and included a total rainfall of 21 mm in 65 min, with a peak intensity of 180 mm/h. This event was also used to calibrate the model (Hessel et al., 2003a). The measurements of the saturated conductivity took place in the first week of August 1999.
3. Results
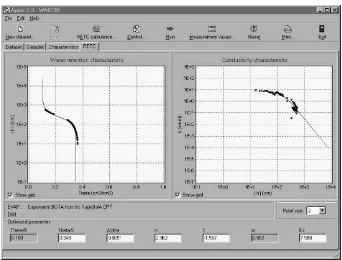
An example of the results of the evaporation method and the fit procedure is shown in Fig. 5. The results of the measurements of water retention and unsaturated
hydraulic conductivity characteristics are presented in Table 1, in the form of
Mualem – Van Genuchten equation parameters. In Table 1, results of measurements are assigned to soil layers. Presented are the results of the samples that are selected for input in the model. Selection took place based on the results of the evaporation method. Samples with highest range of data and best fit were selected. The results of Fig. 5. Results of measurement of water retention and unsaturated hydraulic conductivity characteristics using the evaporation method, and fit procedure used to describe the characteristics in terms of parameters to solve the Mualem – Van Genuchten equations (Theta-r = residual water content (m3/m3); Theta-s = saturated water content (m3/m3); Alpha,n,l,m= shape parameters;Ks= fitted saturated conductivity (cm/day)).
Table 1
Mualem – Van Genuchten equation parameters of land-use systems and soil layers in the Danangou catchment
Layer 0 – 10 cm 10 – 20 cm 20 – 100 cm
Cropland Orchard Wasteland Shrub Forest layer layer
hra 0.12 0.1 0.1 0.1 0.1 0 0.1
hs 0.425 0.459 0.391 0.35 0.45 0.396 0.35
a 0.0075 0.0052 0.0067 0.0062 0.0036 0.0059 0.0044
n 1.925 2.7 2.331 3.207 3.058 2.137 2.595
l 0.1 0.5 0.5 0.5 0.5 0.5 0.5
m 0.481 0.63 0.571 0.688 0.673 0.532 0.615
Ks-fit 1 25 0.587 10 13.164 0.922 20
ah
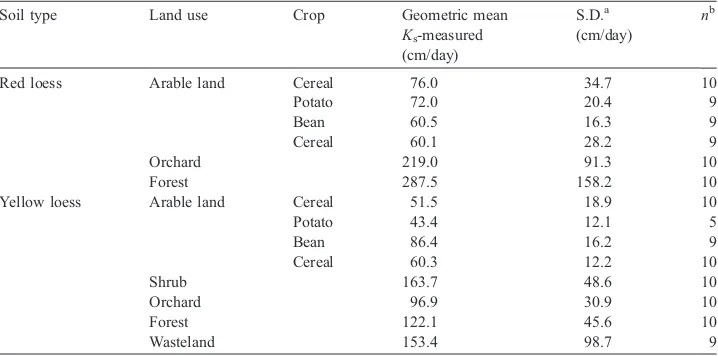
the saturated conductivity measurements are presented in Table 2, showing the geometric mean and standard deviation (S.D.) of the saturated conductivity for each
field. The data shown in Table 2 indicate that the permanent land-use systems
(forest, orchard, wasteland, shrub) showed higher geometric mean Ks values and
greater heterogeneity within the system (high S.D. values) than the arable areas. This is probably due to the presence of more macro pores (e.g. insect burrows or roots) in the permanent systems than in the arable land, as was also noticed during sampling.
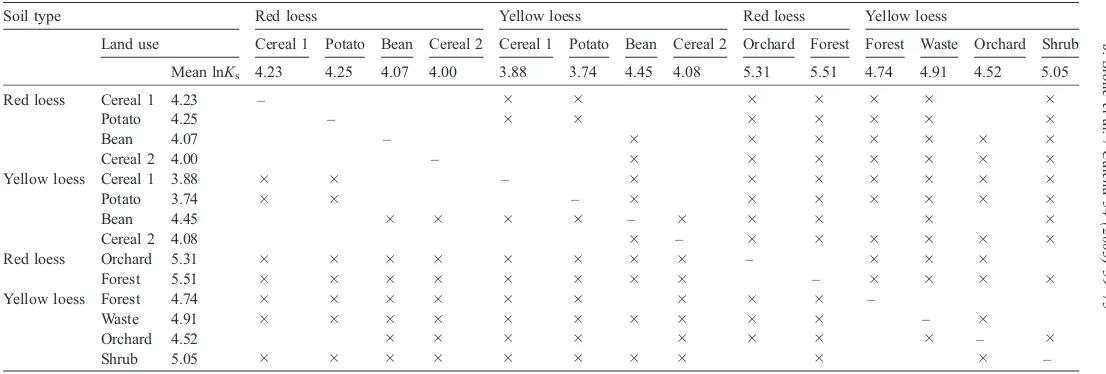
The measured data of Ks showed that differences between the geometric mean of
Ks for a number of field combinations are smaller than the Least Square Difference (Table 3). Using this table, it is possible to merge land-use groups in groups with similarity in soil type and land management, as shown in Table 4. The statistical analysis of the saturated conductivity resulted in the identification of six physical units within the catchment. These units are on red loess cropland, forest and orchard and on yellow loess cereal and potato, bean, orchard, and wasteland, shrub and forest.
For the July 20, 1999 event, the calibration procedure as presented by Hessel et al. (2003b) resulted in a ratio between the measured and fittedKs values of 0.15 and 0.85,
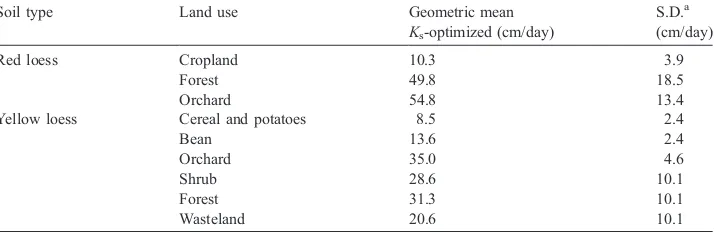
respectively, when calibrating on peak discharge. The same ratio was used in the sensitivity analysis, resulting in a value for Ks-optimized that was considerable lower
than that ofKs-measured. TheKs-fit was based on the results of the evaporation method,
as shown in Table 1. The geometric mean of Ks-optimized and its standard deviation
were used to calculate discharge and soil loss, to be used as input for the LISEM model.
Table 2
Geometric mean of measured saturated conductivity for several land-use/soil-type combinations in the Danangou catchment
Soil type Land use Crop Geometric mean
Ks-measured (cm/day)
S.D.a (cm/day)
nb
Red loess Arable land Cereal 76.0 34.7 10
Potato 72.0 20.4 9
Bean 60.5 16.3 9
Cereal 60.1 28.2 9
Orchard 219.0 91.3 10
Forest 287.5 158.2 10
Yellow loess Arable land Cereal 51.5 18.9 10
Potato 43.4 12.1 5
Measurements used the constant head method; sampling spots for each field were selected using Simple Random Sampling.
a
S.D. = standard deviation. b
Table 3
Geometric mean of measuredKsfor each field and the significant differences between fields at a Least Significant Difference (at 5% level) of 0.3415
Soil type Red loess Yellow loess Red loess Yellow loess
Land use Cereal 1 Potato Bean Cereal 2 Cereal 1 Potato Bean Cereal 2 Orchard Forest Forest Waste Orchard Shrub
Mean lnKs 4.23 4.25 4.07 4.00 3.88 3.74 4.45 4.08 5.31 5.51 4.74 4.91 4.52 5.05
Red loess Cereal 1 4.23 –
Potato 4.25 –
Bean 4.07 –
Cereal 2 4.00 –
Yellow loess Cereal 1 3.88 –
Potato 3.74 –
Bean 4.45 –
Cereal 2 4.08 –
Red loess Orchard 5.31 –
Forest 5.51 –
Yellow loess Forest 4.74 –
Waste 4.91 –
Orchard 4.52 –
Shrub 5.05 –
indicates the fields which are significantly different (AlnKsi lnKsjA>l.s.d.).
J.
Stolte
et
al.
/
Catena
54
(2003)
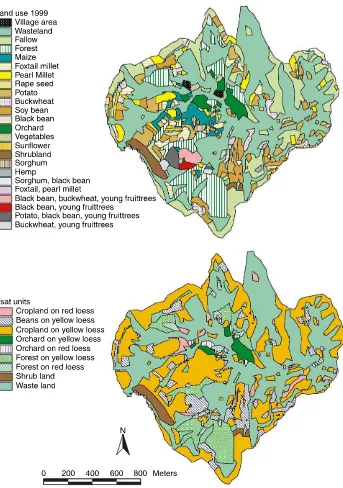
These values are shown in Table 5. The spatially varying input data for the saturated conductivity given inFig. 6correspond toTable 5. The 1999 land-use map together with the derived map of the physical unit groups for the saturated conductivity data is shown in Fig. 6.
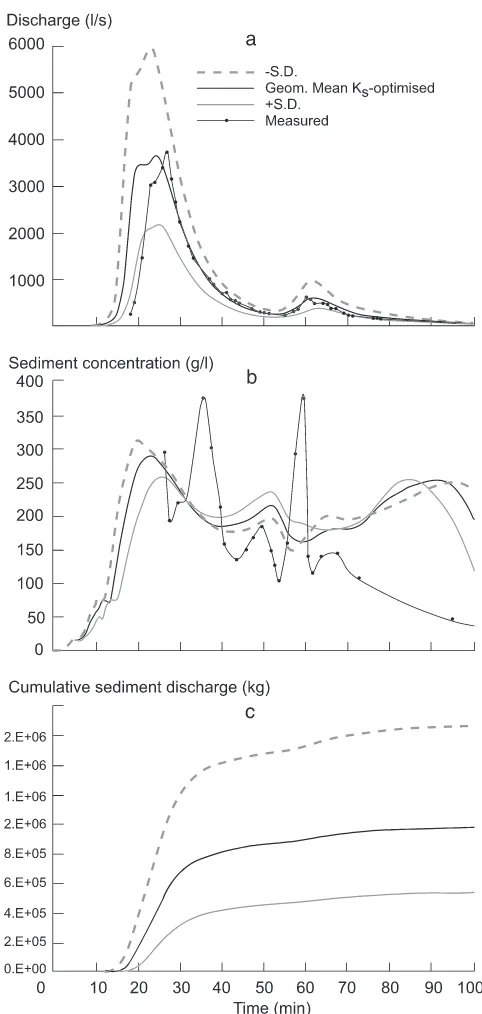
Fig. 7 shows the calculated and measured values of discharge, sediment concen-tration and calculated cumulative sediment load in the Danangou catchment, for a rain
event on July 20, 1999, calculated on the basis of the geometric mean of Ks
-optimized, plus and minus the standard deviation. The figure shows that, using the standard deviation of saturated conductivity, which is 30 – 50%, the calculated discharge and total sediment losses varied by a factor of 2. Using the standard deviation had a minor effect on the calculated sediment concentration. Fig. 8 shows the on-site effects of the calculated erosion patterns, in terms of the absolute erosion value resulting from the use of the mean value of Ks-optimized, and the differences
resulting from the use of the standard deviation. It is clear that using the Ks value
minus the S.D. results in an increase in the level of erosion, while using the Ks value
plus the S.D. results in a significant decrease relative to that obtained using the mean
Ks value.
Table 4
Geometric mean of Ks and standard deviation for land-use groups that showed no significant differences according to analysis of variance on the measuredKsvalues
Soil type Land use Geometric mean
Yellow loess Cereal and potatoes 51.0 16.0
Bean 85.2 16.2
Geometric mean ofKs-optimized ( = 0.15Ks-measured + 0.85Ks-fitted) and standard deviation of land-use groups
Soil type Land use Geometric mean
Yellow loess Cereal and potatoes 8.5 2.4
Fig. 8. Calculated erosion/deposition pattern in the Danango catchment for a rain event on July 20, 1999, using the mean value ofKs-optimized (A) (green = deposition, red = erosion); difference in erosion/deposition using
4. Discussion and conclusion
Saturated hydraulic conductivity proved to be very heterogeneous. Although this
had previously been recognised by several other authors (e.g. Russo et al., 1997;
Mallants et al., 1997; Mohanty et al., 1994; Lauren et al., 1988), the effect of this spatial variability on soil erosion predictions has rarely been quantified. The procedure carried out in the present study provides a sensitivity analysis of the LISEM model, using the standard deviation of the optimised saturated conductivity. Though the S.D. of Ks-optimized was much lower than that of Ks-measured, there was nevertheless a
considerable effect on calculated discharge and sediment loss. This indicates that considerable effort is required to estimate the saturated conductivity in order to predict the discharge of a catchment. Using randomly selected sampling spots and a calibration procedure as was done in the present study make detailed information on Ks available, which can be used to compare alternative land-use options for their
effectiveness in reducing discharge and sediment losses.
There is no indication that the results will differ if other rainfall events were used. As is shown in the calibration results by Hessel et al. (2003a), the factor between Ks-measured and Ks-fitted has a minor change for different events. That
means that differences between the soil physical units remain the same, and so the outcome of the sensitivity analysis will remain the same. Only the mag-nitude of the differences due to different rainfall amounts and intensity will change.
The present study showed that saturated conductivity depends on both soil type and land use. This indicates that this value is determined by the texture and structure of the soil. Apart from the bean-field, none of the crop fields on a specific soil type showed any statistically significant differences in Ks values. This could be explained
from the fact that the same tillage techniques are used for all fields in this area. It is not clear why the bean field on yellow soil showed different values. The fact that for the red loess orchard and forest are in the same physical unit, in contradiction with the yellow loess where the orchard is a separate unit, can be explained by the use of the field. The orchard on red loess was not tilled, whereas for the yellow loess area the orchard was used for growing of vegetables. The finding that, in general, every field with the same treatment on a particular soil type had the same Ks value
shows that a preliminary sampling scheme can be defined to reduce the number of samples.
Acknowledgements
References
Cassel, D.K., Nelson, L.A., 1985. Spatial and temporal variability of soil physical properties of Norfolk loamy sand as affected by tillage. Soil Tillage Res. 5, 5 – 17.
Ciollaro, G., Romano, N., 1995. Spatial variability of the hydraulic properties of a volcanic soil. Geoderma 65 (3 – 4), 263 – 282.
De Gruijter, J.J., 1999. Spatial sampling schemes for remote sensing. In: Stein, A., et al. (Eds.), Spatial Statistics for Remote Sensing. Kluwer Academic Publishing, Dordrecht, pp. 211 – 242.
De Roo, A.P.J., Riezebos, H.Th., 1992. Infiltration experiments on loess soils and their implications for mod-elling surface runoff and soil erosion. Catena 19, 221 – 239.
De Roo, A.P.J., Hazelhoff, L., Heuvelink, G.B.M., 1992. Estimating the effects of spatial variability of infiltration on the output of a distributed runoff and soil erosion model using Monte Carlo methods. Hydrol. Process. 6, 127 – 143.
De Roo, A.P.J., Offermans, R.J.E., Cremers, N.H.D.T., 1996a. LISEM: a single-event physically-based hydro-logical and soil erosion model for drainage basins: II. Sensitivity analysis, validation and application. Hydrol. Process. 10, 1119 – 1126.
De Roo, A.P.J., Wesseling, C.G., Ritsema, C.J., 1996b. LISEM: a single-event physically-based hydrological and soil erosion model for drainage basins: I. Theory input and output. Hydrol. Process. 10, 1107 – 1118. Halbertsma, J.M., Veerman, G.J., 1994. A new calculation procedure and simple set-up for the evaporation method
to determine soil hydraulic functions. Report 88. DLO Winand Staring Centre, Wageningen, The Netherlands. Hessel, R., Messing, I., Chen, L.D., Ritsema, C.J., Stolte, J., 2003a. Soil erosion simulations of land use scenarios
for a small Loess Plateau catchment. Catena 54, 289 – 302. (doi:10.1016/S0341-8162(03)00070-5). Hessel, R., Jetten, V., Liu, B., Zhang, Y., Stolte, J. 2003b. Calibration of the LISEM model for a small Loess
Plateau catchment. Catena 54, 235 – 254. (doi:10.1016/S0341-8162(03)00067-5).
Kim, C.P., Stricker, J.N.M., 1996. Influence of spatially variable soil hydraulic properties and rainfall intensity on the water budget. Water Resour. Res. 32 (6), 1699 – 1712.
Lauren, J.G., Wagenet, R.J., Bouma, J., Wo¨sten, J.H.M., 1988. Variability of saturated hydraulic conductivity in a glossaquic hapludalf with macropores. Soil Sci. 145 (1), 20 – 28.
Mallants, D., Mohanty, B.P., Jacques, D., Feyen, J., 1996. Spatial variability of hydraulic properties in a multi-layered soil profile. Soil Sci. 161 (3), 167 – 181.
Mallants, D., Mohanty, B.P., Vervoort, A., Feyen, J., 1997. Spatial analysis of a saturated hydraulic conductivity in a soil with macropores. Soil Technol. 10 (2), 115 – 131.
Mapa, R.B., Green, R.E., Santo, L., 1986. Temporal variability of soil hydraulic properties with wetting and drying subsequent to tillage. Soil Sci. Soc. Am. J. 50, 1133 – 1138.
Messing, I., Chen, L.D., Hessel, R., 2003. Soil conditions in a small catchment on the Loess Plateau in China. Catena 54, 45 – 58. (doi:10.1016/S0341-8162(03)00056-0).
Mohanty, B.P., Ankeny, M.D., Horton, R., Kanwar, R.S., 1994. Spatial Analysis of hydraulic conductivity measured using disc infiltrometers. Water Resour. Res. 30 (9), 2489 – 2498.
Mualem, Y., 1976. A new model for predicting the hydraulic conductivity of unsaturated porous media. Water Resour. Res. 12, 513 – 522.
Ritsema, C.J., 2003. Soil erosion and participatory land use planning on the Loess Plateau in China. Catena 54, 1 – 5. (doi:10.1016/S0341-8162(03)00052-3).
Russo, D., Russo, I., Laufer, A., 1997. On the spatial variability of parameters of the unsaturated hydraulic conductivity. Water Resour. Res. 33 (5), 947 – 956.
Sharma, M.L., Gander, G.A., Hunt, C.G., 1980. Spatial variability of infiltration in a watershed. J. Hydrol. 45, 101 – 122.
Singh, V.P., Woolhiser, D.A., 1976. Sensitivity of linear and nonlinear surface runoff models to input errors. J. Hydrol. 29, 243 – 249.
Soil Survey Staff, 1992. Keys to Soil Taxonomy, 5th ed. Pocahontas Press, Blacksburg, VA, USA. United States Department of Agriculture.
Stolte, J. (Ed.). 1997. Manual for soil physical measurements. Technical Document 37, DLO Winand Staring Centre, Wageningen, Netherlands.
Stolte, J., Ritsema, C.J., Veerman, G.J., Hamminga, W., 1996. Establishing temporally and spatially variable soil hydraulic data for use in a runoff simulation in a loess region of the Netherlands. Hydrol. Process. 10, 1027 – 1034.
Stolte, J., Ritsema, C.J., de Roo, A.P.J., 1997. Effects of crust and cracks on simulated catchment discharge and soil loss. J. Hydrol. 195, 279 – 290.
Van Genuchten, M.Th., 1980. A closed-form equation for predicting the hydraulic conductivity of unsaturated soils. Soil Sci. Soc. Am. J. 44, 892 – 898.
Van Genuchten, M.Th., Leij, F.J., Yates, S.R., 1991. The RETC Code for Quantifying the Hydraulic Functions of Unsaturated Soils. U.S. Salinity Laboratory, Riverside, CA, USA.
Wind, G.P., 1968. Capillary conductivity data estimated by a simple method. In: Rijtema, P.E., Wassink, H. (Eds.), Water in the Unsaturated Zone, Proceedings of the Wageningen Symposium, June 1966, vol. 1. IASH Gentbrugge/UNESCO, Paris, pp. 181 – 191.
Woolhiser, D.A., Smith, R.E., Giraldez, J.V., 1996. Effects of spatial variability of saturated hydraulic conduc-tivity on Hortian overland flow. Water Resour. Res. 32 (3), 671 – 678.
WRB, 1998. World Reference Base for Soil Resources. World Soil Resources Reports 84. Food and Agricultural Organisation of the United Nations, Rome, Italy.
Wu, Y., Xie, K., Zhang, Q., Zhang, Y., Xie, Y., Zhang, G., Zhang, W., Ritsema, C.J., 2003. Crop characteristics and their temporal change on the Loess Plateau of China. Catena 54, 7 – 16. (doi:10.1016/S0341-8162(03)00053-5).