BUILDING SCHOOL ORGANIZATIONAL WORK CULTURE
THROUGH THE IMPLEMENTATION OF QUALITY
MANAGEMENT SYSTEM ISO 9001: 2008
*Muhammad Giatman1 1
Engineering Faculty, Padang State University, Indonesia;
*Corresponding Author, Received: 01 Augst 2015, Revised: 01 Dec 2015, Accepted: 15 July 2016 ABSTRACT: ISO QMS implementation is believed as a tool to improve organizational behavior to be better and productive. This study aims to determine the impact of the implementation of QMS ISO toward work culture, work motivation, and school performance. Samples of this research are 5 SMKs, namely SMKN 2 Padang, SMKN 9 Padang, SMKN 1 Bukittinggi, SMKN 2 Payakumbuh, and SMKN 1 Solok. The first hypothesis is to prove the existence of organizational behavior changes by implementing the QMS ISO. The second hypothesis is to determine the influence of behavior toward the work motivation and school performance through path-analysis. The result of the research shows (1) the presence of significant changes in organizational behavior, (2) there is a significant direct influence of organizational behavior on work motivation and school performance. It means that the implementation of QMS ISO has been able to build a work culture of the organization effectively in the effort of continuous quality improvement, and behavior changes directly influence the work motivation and school performance.
Keywords: Implementation of QMS ISO 9001: 2008, Behavior Changes, Leadership, Organizational Management, Work Culture
1. INTRODUCTION
Quality Management System (QMS) ISO 9001: 2008 is one of implementation of TQM methods recognized internationally, and has been widely adopted by institutions, organizations and companies in the effort to improve the quality of products based on customer satisfaction. Organization that issues this system was established in 1987 with 176 member countries worldwide with the International Organization for Standardization. Quality Management System (QMS) ISO 9001: 2008 is a series of standards issued by ISO specifically for "process management", and not for "product quality", Currently the series 9001: 2008 has been revised to ISO 9001: 2015, for that there is a transition period until September 2016. The system can be used for all types of organizations/companies, including educational organizations. This is supported by the establishment of the International Workshop Agreement-2 (IWA-2) in 2003 and updated in 2007, serves as a guideline of the implementation of QMS ISO 9001: 2008 in education [1].
Factors that encourage organizations to implement ISO 9001: 2008 are (1) Pressure from customer; (2) The competitors already get certified from approved registration; (3) Improve the image of company quality; (4) Ensure continuous quality improvement; and (5) Reduce the risk of litigation [2]. Benefits of ISO implementation for an
organization can also be viewed from two aspects, namely internal and external aspect.
ISO 9001: 2008 is based on eight principles of quality management that can be used by the management as a framework in guiding the organization toward improved performance. The eight principles are derived from the collective experience and knowledge of experts who participated in the ISO Technical Committee/TC 176. The experts are responsible for developing and maintaining the standards of ISO 9000. The eight principles of quality management are: (1) organizations that focus on customers, (2) leadership, (3) involvement of all employees, (4) process approach, (5) system approach in management, (6) sustainable increase, (7) factual approach in making decisions, and (8) mutual benefit relationship with suppliers [3].
1.1 Organizational behavior
The achievement of the vision, mission and objectives of the school organization requires conducive and harmonious school conditions between education personnel in schools, namely school leaders, teachers and administrative staffs who each of them have a role in achieving organizational objectives. An organization as a system creates and maintains an environment in it through complex human interactions (both among individuals and in groups). Success or failure of these objectives is strongly influenced by factors such as the leaders and the people they lead, as well as the behavior of the organization they run.
Organizational behavior is a field of study that investigates the impact that individuals, groups and organizational structure have on behavior within the organization, for the purpose of applying such knowledge towards improving an organizational effectiveness [4]-[5]. In order for organizations can run effectively and efficiently, one of the tasks that must be done by the leaders is escorting and directing organizational behavior in giving satisfaction to the people they lead. Therefore, the behavior of an organization can have a great impact in achieving the objectives/vision and mission of an organization.
Some of the factors that have direct impact on the successful implementation of ISO are leadership, managerial, and work culture. Besides, the work motivation and performance factors can be seen as an indirect influence on organizational behavior.
.
1.2 Leadership
Leaders are people in charge of directing and coordinating the activities related to the tasks of the group [6]-[7]-[4]-[8]. Leadership is the efforts to influence people through communication to reach the objectives. Furthermore, there are three leadership traits, namely: (1) interpersonal, (2) informational, and (3) decision [9]. Leadership style is basically the embodiment of the three influencing components, i.e. the leader themselves, subordinates, and the situations in where the leadership is realized [10]. In practice, the three styles of leadership are developed into various types of leadership, which are: (1) Autocratic type, (2) Militaristic type, 3) Paternalistic type, (4) Charismatic type, (5) Laissez Faire type, and (6) Democratic type [10]-[11]. Transformational leadership has four dimensions, namely: (1) idealized influence, (2) Inspirational motivation, (3) Intellectual stimulation, and (4) Individualized consideration [12].
A model of leadership that is suitable for quality management is a Transformational
Leadership, a leader who is able to transform the organization towards their vision on what should be done by the organization and how the organization should be run towards specified quality target [1].
1.3 Managerial.
Management is a verb that comes from the word to manage, i.e. manage or implement, while managerial is an adjective associated with the management. Thus managerial discuss how the management process is managed by the leader of the organization. Furthermore, many experts have expressed the opinion about the definition of management.
Management is the art of getting done through people [13]. A good manager is a manager who has the art in managing the people he leads. Furthermore, management is the process of planning, organizing, mobilizing human resources and other resources to achieve organizational objectives [14]-[15]. The process of management includes (1) planning, (2) organizationing, (3) leadership, and (4) controlling.
A good manager is a manager that can optimize all resources owned by the organization in an efficient and effective way. The resource of management is often called the 5 M, namely: men, material, machine, method, and money. Several other experts also have added factors of Energy, Information, Science and Technology as the other important elements in the management, so it is known as 5M + E + 2I. Management processes can be classified into: (a) goal setting, (b) Planning, (c) staffing, (d) directing, (e) supervising, and (f) controlling [16].
1.4 Work Culture
The work culture is a system of values which are believed, learned, applied and developed by all members of the organization. Work culture of an organization functions as a system as well as adhesive and can be used as a reference of how to behave within the organization. Robbins [17] states that the work culture is built and maintained by the philosophy of the founder or leader of the company. The act of a leader will greatly influence the behavior that acceptable and unacceptable for the workers. Quality work culture is the value system of the organization that produced by a working environment that is conducive to the implementation of continuous quality improvement [18]-[19] [20].
and after implementing QMS ISO 9001: 2008. 2. METHODOLOGY
This research is a descriptive study using an ex post facto quantitative approach, describing the influence of the implementation of QMS ISO 9001: 2008 toward changes in organization behavior. The main variables are school leadership, school managerial, and school work culture. The population of the research is vocational schools (SMK) in West Sumatra that have implemented QMS ISO 9001: 2008 for at least 3 years. Sample is taken by using Purposive Cluster Sampling technique, with 5 SMKs as samples, i.e. SMKN 2 Padang, SMKN 9 Padang, SMKN 1 Bukittinggi, SMKN 2 Payakumbuh, and SMKN 1 Solok. Respondents are: The school principal, vice principals, head of departments, head of workshops, teachers and school staffs, with a total of 222 respondents calculated by using Harry King’s Nomogram.
To determine the impact of the implementation of QMS ISO 9001: 2008 toward the behavior of the organization, the mean-analysis of the data of organization as shown in the following figure (Figure 1).
This figure explains that there are three sub-structure relationship, i.e.:
First, the sub-structure relationship stating a causal relationship of x1, x2, x3 toward Y
Second, the sub-structure relationship stating a causal relationship of x1, x2, x3 toward Z
Third, the sub-structure relationship stating a relationship between x5 and x6
Based on that, it can be derived three equations, namely:
(1)
(2)
(3)
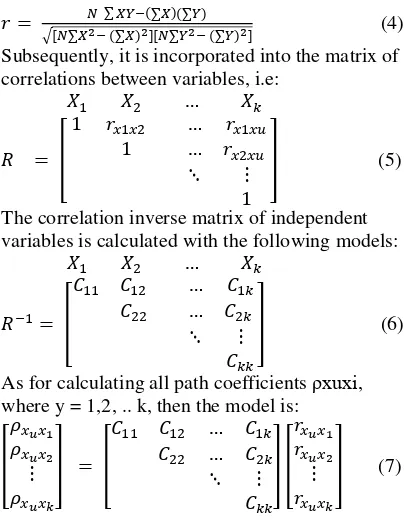
In calculating the correlation coefficient that will be found out, Product Moment Coefficient from Karl Pearson is used, by the following equation [21]:
√ ∑ ∑ (∑ )(∑ ) (∑ ) ∑ (∑ ) (4) Subsequently, it is incorporated into the matrix of correlations between variables, i.e:
[
] (5)
The correlation inverse matrix of independent variables is calculated with the following models:
[
] (6)
As for calculating all path coefficients ρxuxi, where y = 1,2, .. k, then the model is:
[ ] [
] [ ] (7)
3. RESULTS AND DISCUSSION
In this study, there are five sources of data as variables, i.e. the variable leadership (X1), managerial (X2), work culture (X3), work motivation (Y), school performance (Z). For each of these variables, it will be presented a mean value, standard deviation, median, mode, frequency distribution, as well as the histogram (Table 1)
Table 1 Frequency Data variable
X1 X2 X3 Y Z
N Valid 222 222 222 222 222
Missing 0 0 0 0 0
Mean 4.0690 4.0625 4.0500 3.7950 3.9355
Median 4.0700 4.0700 4.0500 3.7800 3.9400
Mode 3.93a 4.21 4.05 3.94 3.77a
Std. Deviation .24473 .23925 .35586 .39889 .38522
Variance .060 .057 .127 .159 .148
Range 1.41 2.27 1.96 1.67 1.94
Minimum 3.38 2.42 2.95 2.89 2.77
Maximum 4.79 4.69 4.91 4.56 4.71
Sum 903.32 901.88 899.11 842.48 873.68
a. Multiple modes exist. The smallest value is shown
3.1 Test of Data Analysis Requirements
The processing of research data uses statistical t-test and path analysis; therefore it is necessary to test the data analysis requirements, so that the results can be used to draw conclusions. In this research, requirements test may include: testing the Fig. 1 Research Design
Note
X1 : Leadership
X2 : Managerial
X3: Work Culture
Y : Work Motivation Z : School Performance
ερy ε
ε1
Ρz ε2 X
X
X
Y Z
ρyx
ρyx
ρyx
ρ
ρzy
normality of the data distribution, testing the homogeneity, linearity of the relationship, and testing the significance of the regression equation.
Normality test aims to test the assumption that the distribution of samples comes from populations with normal distribution. Normality test techniques used in this research is Kolmogorov Smirnov; the criteria used is if the sig. KScount is greater than sig α = 0.05, then hypothesis zero is acceptable, means that the population is normally distributed. The normality test result shows that all data are distributed normally.
Furthermore, test of the significance of regression equation is done by calculating the value of Fcount that then is compared with Ftable at significance level of 0.05 If the value of Fcount > Ftable then the regression equation is significant, and vice versa. The calculation results shows that all variables relationship are significant..
Prior to the hypothesis test, an exogenous coefficient calculation is done in order to test the independence. The results of zero level correlation analysis between leadership (X1), managerial (X2), and the work culture (X3), or intercorrelation between exogenous variables are shown in Table 2.
Table 2 Matrix of correlation coefficients between Exogenous variables
No Variable Leadership Mana gerial
Work culture
1. Leadership
(X1)
1 0,291 0,248
2. Managerial
(X2)
0,291 1 0,274
3. Work
culture (X3)
0,248 0,274 1
Based on the table, it can be derived that coefficients between exogenous variables i.e. leadership (X1), managerial (X2), and the work culture (X3), has a value below 0.80, thus there is no high correlation between exogenous variables. This indicates the absence of multicolinearity. 3.2 Hypothesis Testing
After testing the analysis requirements, hypothesis testing is conducted by the following steps.
3.2.1 Conceptual Model
Based on the results of the literature study it can be formulated a theoretical framework in the form of conceptual model, as well as research hypothesis such as paradigm model of the relationship between variables. The hypotheses to be tested based on the conceptual model are as
follows:
1. There are differences in the behavior of school organization (leadership, managerial, work culture) before and after implementing QMS ISO 9001: 2008
2. There is a direct influence of leadership (X1) on the performance of schools (Z).
3. There is a direct influence of managerial (X2) on the performance of schools (Z).
4. There is a direct influence of work culture (X3) on school performance (Z).
5. There is a direct influence of work motivation (Y) on the performance of schools (Z).
6. There is a direct influence of leadership (X1) on work motivation (Y).
7. There is a direct influence of managerial (X2) on work motivation (Y).
8. There is a direct influence of work culture (X3) on work motivation (Y).
3.2.2 Analysis of t-test
To find out if there is a change of organizational behavior in this case by measuring the variable of leadership, managerial, and work culture of school after implementing QMS ISO 9001:2008. For this goal, the condition of the behavior of the organization prior to the implementation of the system is compared with the condition after the implementation of the system. In this case the method of data analysis will be carried out through paired t-test. The statistical hypothesis is:
H0 : µ1 - µ0 = 0
H1 : µ1 - µ0 ≠ 0
α = 0.05
H1 means that the difference of the two
averages is not equal to zero.
Before performing data analysis with paired t-test, it is required to test the normality of data. In this case, normality test has been done by using Liliefors method (Kolmogorov-Smirnov), and the results is that data is distributed normally.
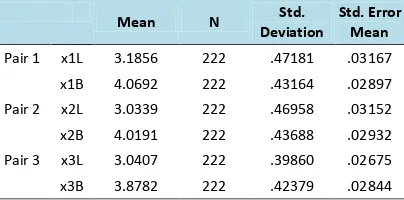
Table 3 Paired Samples Statistic
Mean N Std.
Deviation
Std. Error Mean
Pair 1 x1L 3.1856 222 .47181 .03167
x1B 4.0692 222 .43164 .02897
Pair 2 x2L 3.0339 222 .46958 .03152
x2B 4.0191 222 .43688 .02932
Pair 3 x3L 3.0407 222 .39860 .02675
x3B 3.8782 222 .42379 .02844
From the results of the paired t-test it can be seen that average difference between X1L with X1B is 0.88353. It means that there is an increase in the average value of leadership in amount of 0.88353..
The calculation result of "t" values is 50.221 with p-value 0.000 that can be written as 0.001 (2-way test). This means that H0 is rejected and it can be concluded that statistically there is a significant difference between the average value of leadership before the implementation of system and after the implementation of system. Similarly, the results of managerial variable (X2L) with (X2B), and work culture variable (X3L) with (X3B), with a value of "t" 50.954 and 38.648 respectively, which means that H0 is rejected and it can be concluded that statistically there is a significant difference between of condition before and after the implementation of system QMS ISO 9001: 2008. A complete data can be seen in Table 4.
Table 4 Results of Paired t-Test
Paired Differences
t df Sig.
(2-tailed) 95% Confidence
Interval of the Difference
Mean Std.
Deviation Std. Error Mean
Lower Upper
Pair 1 x1L - x1B -.88353 .26212 .01759 -.91820 -.84886 -50.221 221 .000
Pair 2 x2L - x2B -.98520 .28809 .01934 -1.02330 -.94709 -50.954 221 .000
Pair 3 x3L - x3B -.83743 .34048 .02285 -.88246 -.79239 -36.646 221 .000
3.2.3 Path Analysis Model
To determine the direct influence of each variable i.e. leadership (X1) on the performance of schools (Z), managerial (X2) on the performance of schools (Z), work culture (X3) on the performance of schools (Z), work motivation (Y) on the performance of schools (Z), leadership (X1) on work motivation (Y), managerial (X2) on work motivation (Y), and the work culture (X3) on work motivation (Y), based on the conception above it can be seen in the specification of the analysis model, as illustrated in the image of path analysis (Figure 1).
Based on the analysis above, the operation of path analysis model will be explained as follows:
Based on the results of multilevel regression analysis it can be determined each path coefficient as follows:
Regression Phase 1 Beta X1z = 0.105 (t = 2.054) = zx1
Regression phase 2 Beta X2z = 0.111 (t = 2.119) = zx2
Regression phase 3 Beta X3z = 0.151 (t = 2,715) = zx3
Regression phase 5 Beta Xyz = 0.534 (t = 9.400) = zy
Regression phase 1 Beta X1y = 0.122 (t = 2.018) = yx1
Regression phase 2 Beta X2y = 0.185 (t = 3.026) = yx2
Regression phase 3 Beta X3y = 0.406 (t = 6.745) = yx3
By using
(
1
R
2)
formula, it can be calculated residual path coefficients for each of the dependent variables as follows:Residual path coefficients for leadership (X1),
managerial (X2) and the work culture (X3) on school performance (Y)
e1 =
(
1
)
2
R
=
(
1
0
,
361
)
=
0
,
659
= 0,818
Residual path coefficients for leadership (X1), managerial (X2) and the work culture (X3) on school performance (Y) and work motivation (Z). e2 =
(
1
)
2
R
=
(
1
0
,
493
)
=
0
,
507
= 0,712
3.3 Test of Influence Significance
Regression analysis can be interpreted as follows:
level, it can be concluded that there is a direct influence of leadership (X1) on the performance of schools (Z).
In similar way, the direct influence of managerial (X2) on the performance of schools (Z), the direct influence of work culture (X3) on school performance (Z), the direct influence of leadership (X1) on work motivation (Y), the direct influence of managerial (X2) on work motivation (Y), and the direct influence of work culture (X3) on work motivation (Y) can be determined.
Noting the model presented above where there is a path coefficient so that the value of z1 = 0.105, z2 = 0.111, z3 = 0.151, zy = 0.534, y1 = 0.122, y2 = 0.185, and y3 = 0.406, it can be arranged the recapitulation of both direct and indirect influence of exogenous variables on endogenous variables with the results as described below. leadership variable (X1) on school performance (Z) i.e. equal to 1.102%. In the same way, the
1 The direct influence of leadership (X1) on work motivation (Y)
1,49
2 The direct influence of managerial (X2) on work motivation (Y)
3,42
3 Direct influence of work culture (X3) on work motivation (Y)
16,48
Sub total X1, X2, X3 thd Y 21,39
4 The direct influence of leadership (X1) on the performance of schools (Z)
1,102
5 The direct influence of managerial (X2) on the performance of schools (Z)
1,23
6 Direct influence of work culture (X3) on school performance (Z)
2,28
Sub total X1, X2, X3 thd Z 4,612
7 The direct influence of work motivation (Y) on the performance of schools (Z)
28,52 28,52
Total X1, X2, X3 , Y terhadap Z 54,522
Table 6 Summary of Analysis of Direct and Indirect Influences of Exogenous Variables on Endogenous Variables.
1 The direct influence of leadership (X1), managerial (X2), work culture (X3) on work motivation (Y)
21,39
2 The direct influence of leadership (X1), managerial (X2), work culture (X3) on Performance (Z)
4,612
3 The direct influence of work motivation (Y) on the performance of schools (Z)
28,52
Sub total of Direct Influence 54,522 4 The indirect influence of
leadership (X1) on the performance of schools (Z) by work motivation (Y)
0,68
5 The indirect influence of managerial (X2) on the performance of schools (Z) by work motivation (Y)
1,09
6 Indirect influence of work culture (X3) on school performance (Z) by work motivation (Y)
3,27
Subtotal indirect influence 5,04
Total direct and indirect influence 59,62 The influence of other variables 40,438
T o t a l 100,00
From the summaries above it can be explained that exogenous variables (leadership (x1), managerial (X2), and the work culture (X3)) affects more on endogenous variables Work Motivation compared to School performance, with the largest contribution given by the work culture managerial amounted to 1.23%, and the leadership of 1.102%. Besides, there is an indirect influence of exogenous variables on School Performance with a contribution of 5.04%
From the above calculation, it can also be cannot be explained in this research or is assumed comes from other variables.
.
3.4 Discussion
Changes in Organizational Behavior
Based on the research results, it is known that there has been a change in organizational behavior at vocational schools that have implemented the Quality Management System (QMS) ISO 9001: 2008. The changes are measured on the variable of school leadership, managerial system, and work culture.
These results are also in line with the results of research [22]-[23]-[24]-[25]-[26]-[27], can raise the standard and management system the quality and increase the overall effectiveness. Besides, there is a direct influence of organizational behavior to the work motivation by 54.2%, [28]. Further [29] explains that, leadership can be defined as the ability to encourage some people to work together in implementing activities focused on a common goal.
Leadership function according to [30] has two dimensions: a). dimension with regard to the level of ability to direct (direction) in action or activity leader, seen in the response of the people they lead; b). dimensions with respect to the level of support (support) or the involvement of the people who led in performing basic tasks groups or organizations, which are translated and manifested through the decisions and policies of the leader.
Building a quality management system (QMS) ISO is essentially building a culture of good organization and productive, that is by placing joints demogratis and dynamic leadership, also called transformational leadership [30]-[3]-[20] Leadership in quality management aims to improve the performance of man and machine, improve the existing quality, increase output and productivity, while simultaneously able to create work pride (pride of workmanship) for workers.
Transformational leaders often change their organizational culture with the new vision and revision of assumptions, values and norms along [12]. In a transformational culture in general, there is a common purpose and a feeling of kinship. The sense of responsibility strong personnel to help new members assimilate into the culture. Assumptions, norms, and values do not preclude individuals to pursue their own goals and reward. Leaders and followers share a common interest and feel camaraderie and interdependent [12].
Thus we can conclude that effective leadership according to the concept of quality management is sensitive to changes in the leadership, leaders who are able to develop a vision and mission, shape the character of the culture, organizational climate better, motivate members, train and care for members.
4. CONCLUSION
Based on data analysis and discussion of these results it can be concluded that there is evidence of
significant organizational behavior changes in variable of leadership, managerial, and work culture before and after school implementing the QMS ISO 9001: 2008. It is also determined that there is a significant direct influence of work motivation on the performance of SMK in West Sumatra. This means that the work motivation factors contribute directly to the improvement of school performance
Suggestion
In order to increase the impact of the implementation of QMS ISO 9001: 2008 in Vocational High School, and other educational institution, the implementation needs to be followed by the development of better leadership pattern, consistent and orderly application of managerial system, as well as cultivate a more productive work culture through socialization of ISO Awareness, leadership training, administration system training, and seminars related to the development of insight regarding quality and the future challenges for the educational institution. 5. REFERENCES
[1] Gaspersz, Vincent. 1997. Manajemen Kualitas, Penerapan Konsep-konsep kualitas Dalam Manajemen Bisnis Total, Jakarta:,PT. Gramedia Pustaka Utama [2] Dorothea W. Ariani. 2002. Manajemen
Kualitas. Jakarta: Dikti Depdiknas
[3] Gaspersz, Vincent. 2011, Total Quality Management, Untuk Praktisi Bisnis dan Industri, edisi Revisi, Bogor: Vinchristo Publication
[4] Robbinss Stephen P., 2001. Organizational Behavior (Terjemahan) Jilid 1, Edisi Kedelapan, Jakarta: PT. Bhuana Ilmu Populer
[5] Scott, W. R. 2002. Organization: Rational Natural, and Open Systems (4rd. ed.) Englewood Clifts, NJ: Prentice Hall. [6] Fiedler. 1964. A Contingency Model Of
Leadership Influenceiveness. New York: Academic Press.
[7] Dubrin Andrew J., 2005. Leadership (Terjemahan), Edisi Kedua, Jakarta: Prenada Media.
[9] Siagian Sondang P., 2002. Kiat Meningkatkan Produktivitas Kerja, Cetakan Pertama, PT. Rineka Cipta, Jakarta.
[10] Terry. G.R, & RuB, L.W. 2000.Principles of Management. Illonis: Dow Jones Irwin [11] Burns, J.M. .1978. Leadership. New York.
Harper & Row.
[12] Bass, B.M & Avolio,B.J. 1994. Improving organizational influenceiveness: through transformational leadership. London: SAGE Publications TO
[13] Mary P. Follett. 2003. Creating Democracy, Transforming Management, Tonn, Joan C., New Haven: Yale University Press.
[14] Terry. G.R, & RuB, L.W. 2000. Principles of Management. Illonis: Dow Jones Irwin [15] Stoner, A.E. James & Wankel, Charles.
2001. Manajemen Ji/id 2. Jakarta: Erlangga [16] Ali Basyah Siregar. 1987. Manajemen
Industri, Bandung: ITB.
[17] Robbinss Stephen P., 2002. Essentials of Organizational Behavior (Terjemahan), Edisi Kelima, Jakarta: Penerbit Erlangga [18] Dale, B.G, 2003. Developing, Introducing
and Sustaining Total Quality Management. (http://www.blackwell.publishing.com) accessed 28 Februari 2011
[19] Goetsch,D.L. and Davis,S.B. 1994. Introduction to Total Quality, Quality Prodctivity, Competitiveness. Englewood: Prentice Hill International Inc. 121-138. [20] Muhammad Giatman (2015). Optimization
of Implementation QMS ISO 9001:2008 in the Education and Training Vocational Education (TVET) Professional. Advances Social Science, Education and Humanities Research, Atlantis Press. Pp.120-124, March 2015
[21] Sudjana, 2005: Metoda Statistika. Penerbit Tarsito, Jakarta, Indonesia.
[22] Aprianto. 2010. Efektifitas Implementas SMM ISO 9001:2008 Pada Pendidikan Kejuruan.
(http://aprianto29.wordpress.com, accessed 20 Oktober 2010
[23] Arfan Bakhtiar dan Bambang Purwanggono (2009), Analisis Implemenntasi SMM ISO 9001:2000 menggunakan Gap Analysis Tools (Studi Kasus di PT PLN Pikitring JBN), Tesis, Universitas Diponegoro [24] Sulistianawati, Anita (2004) Evaluasi
Elemen-Elemen Sipocom Pasca
Implementasi Sistem Manajemen Kualitas Iso 9001-2000 pada PT Espera Satya Offset. Thesis, Universitas Diponegoro, Semarang.
[25] Dian Ekowati. 2007. Pengaruh Implementasi Quality Management System ISO 9001:2000 terhadap Kinerja Rumah Sakit Duren Sawit. Jurnal Kesehatan Masyarakat Nasional Vol. 2, No. 3, Desember 2007
[26] Rusnardi Rahmat Putra, Kiyono, Furukawa, 2014, Vulnerability assessment of non-engineered houses based on Padang earthquake September 30th data. International journal of Geomate Dec 2014, Vol. 7, No. 2 (Sl. No. 14), pp. 1076-1083. [27] Rusnardi Rahmat Putra, Junji Kiyono,
Yasuo Yoshimoto , Yusuke Ono and Syahril, 2016, Determined Soil Characteristic of Palu in Indonesia By Using Microtremor Observation. International Journal of Geomate, April, 2016, Vol. 10, No. 2 (Sl. No. 20), pp. 1737-1742.
[28] Utami Iis Torisa. 2011, Pengaruh Gaya Kepemimpinan Transformasional Terhadap Motivasi Kerja Karyawan pada PT Trade Servistama Indonesia-Tangerang, Universitas Budi Luhur, Jakarta.(
http://fe.budiluhur.ac.id/wp-content/uploads) diakses 19 Mei 2012. [29] Hill, Tosi., Caroll, SJ.1997. Organisational
Theory and management : A Macro Approach, John willey and Sons Inc, New York.
[30] Sallis, Edwar. 1992. Total Quality Management and Standards in Further Education, in harry Tomlinson, ed. The search for Standards, Harlow, Longman.