Company Update
Summarecon Agung
Bloomberg: SMRA.IJ | Reuters: SMRA.JKSamuel Research 28 Agustus 2017
Akhmad Nurcahyadi, CSA +62 21 2854 8144
Too premium
Hingga paruh tahun dan pencapaian pre sales per 7M17, SMRA masih belum mampu menunjukan perbaikan kinerjanya. Kemampuan
merealisasikan back log dan penurunan target pre sales menjadi dua sentimen negative saham SMRA. Katalis akan datang dari penurunan 7DRR sebesar 25bp yang kami harapkan akan menaikan optimisme pasar, mendorong permintaan dan meningkatkan profil konsumen menggunakan mortgage. Namun demikian untuk sementara kami belum merubah sudut pandang dan rekomendasi, tetap HOLD dengan TP Rp1,110/saham (70% disc to NAV) 49.02xPE17E dan 2xPBV17E.
Tantangan paruh tahun kedua. Meskipun pendapatan 1H17 tercatat 9.4%
diatas proyeksi 1H17E SSI, laba di periode yang sama hanya mampu mencapai 94.4% vs 1H17E kami. Pencapaian laba di 1H17 vs FY17E SSI dan konsensus juga terpaut sangat jauh, hanya sebesar 14.9% (SSI) dan 14.1% (consensus). Di paruh kedua tahun ini, tantangan bagi SMRA akan semakin berat. Untuk mencapai nilai wajar TP SSI sebesar Rp1,307/saham dan 1.336/saham (konsensus), maka SMRA harus membukukan laba bersih di paruh kedua sebesar 85.1% dari FY17 kami atau 85.9% vs proyeksi konsensus, atau jauh dibandingkan dengan rata-rata (2H13-2H16) 58.89%.
Belum membaiknya pre-sales. Rendahnya kinerja tersebut tidak terlepas
dari catatan nilai marketing sales yang hingga periode 7M17 masih belum terlihat mengalami peningkatan. Di 7M17 pre sales tercatat sebesar Rp1.54tn atau -20.22%YoY dan tidak jauh berbeda dengan pencapaian di periode yang sama tahun lalu (7M16) sebesar -26.58%. Perbaikan kinerja sektor yang masih belum menunjukan perbaikan telah mendorong SMRA
menurunkan target pre-salesnya dari Rp4.5tn (SSI Rp3.8tn) menjadi Rp3.5tn.
Valuasi premium. Pasca kenaikan saham SMRA yang mendekati TP SSI,
kami telah menurunkan rekomendasi menjadi HOLD (lihat report SSI sebelumnya: 05/29/17). Tidak berubahnya rekomendasi dan sudut pandang SSI pada saham SMRA telah mendorong kami menurunkan TP dengan diskon to NAV yang lebih tinggi. Hal ini juga kami lakukan mengingat valuasi premium saham SMRA belum mencerminkan dan tidak diikuti dengan perbaikan kinerja fundamental .
Maintain HOLD. Kami tengah melakukan review untuk SMRA dan akan
menggunakan kinerja 3Q17 sebagai basis rencana penurunan rekomendas. Resiko investasi: (1) tidak membaiknya kinerja fundamental (2) minimnya dampak positif penurunan 7DRR (3) perbaikan sektor masih tertunda.
Target Price Rp 1,110 Last Price Rp 1,100 Potential Upside 0.9% JCI Index 5,915 Share isued (m n) 14.43 Market Cap. (Rp bn) 15.87 52-Weeks High/Low 1,970 / 975 Avg Daily Vol (m n) 31.78
Free Float 67.8 Nom inal Value Rp 100 Book value/share ‘17 Rp 556 Relative to JCI Chart
Com pany Background
Shareholder Structure
Semarop Agung 25.4%
Sinarmegah Jayasentosa 6.6%
Others 68.0%
HOLD (Maintain)
PT Summarecon Agung Tbk dan anak usahanya bergerak di bidang properti developer. SMRA mengembangkan dan mengoperasikan berbagai proyek residential houses, apartments, shopping centers, recreational centers dan office buildings.
60 80 100 120 140 160
Aug-16 Nov-16 Feb-17 May-17 Aug-17
JCI SMRA
Forecast and Valuation (at closing price Rp1,100 per share)
Y/E Dec (Rpbn) 15A 16E 17E 18E
Sales 5,624 5,398 5,810 6,246 EBITDA 2,097 1,771 2,090 2,199 Net Profit 855 312 327 435 EPS (Rp/saham) 59.3 21.6 22.6 30.2 DPS (Rp) 20.0 7.5 8.3 11.1 Dividend Yield (%) 1.8% 0.7% 0.8% 1.0% BV per share (Rp) 522 566 556 534 EV/EBITDA (x) 8.5 10.6 8.6 8.4 P/E Ratio (x) 18.6 50.9 48.6 36.4 P/BV Ratio (x) 2.1 1.9 2.0 2.1
Summarecon Agung
SMRA:IJ | SMRA.JK
Figure 1. SMRA NAV Valuation
Source: Company, SSI research
Figure 2. SMRA and Peers
Source: Bloomberg, SSI research
Assets Area (ha) Ownership (%) Estimated NAV (Rp bn) Estimated NAV/Share Summarecon KG 8 100% 1,008 70 Summarecon Serpong 484 Own land 304 100% 15,504 1,075 JO JBC 138 70% 2,898 201 JO TGS 42 55% 693 48 Summarecon Bekasi 393 Own land 121 100% 6,171 428 JV DSA 272 51% 4,162 288 Summarecon Bandung 334 100% 3,627 251 Summarecon Bali 20 100% 600 42 Summarecon Bogor 404 51% 2,472 171 Summarecon Makassar 339 Own land 151 100% 1,812 126 JV SMC 188 51% 1,151 80 Summarecon Karawang 33 100% 396 27
Other properties & inventories 195 100% 1,170 81
Total land 2,210 Total estimated NAV 41,664 2,888 After tax 39,581 2,744 Recurring Revenues 21,295 1,476 Subtotal (IDRbn) 60,875 4,220 Total Shares (in mn) 14,427 Debt 6,194 429
Advances from cust 2,322 161
Cash 1,003 70 Net Asset Value 53,362 3,699
70% disc to NAV 70% 1,110
Market Price (IDR) 1,100
Upside Potential 0.9%
Mkt Cap Last price YTD Chg TP Cons TP SSI Upside PE PE PBV PBV ROE ROE
(Rp bn) (Rp) (% ) (Rp) (Rp) (% ) 17E 18E 17E 18E 17E 18E
BSDE BUY 35,221 1,830 4.3 2,293 2,350 28.4 16.3 14.1 1.4 1.2 8.7% 8.5% PWON BUY 32,989 690 21.2 726 710 2.9 16.8 14.1 3.2 2.7 19.2% 19.3% ASRI BUY 7,152 364 3.4 426 390 7.1 13.5 13.0 0.9 0.9 6.7% 6.6% SMRA HOLD 15,869 1,100 (17.0) 1,336 1,110 0.9 48.7 36.4 2.0 2.1 4.1% 5.7% SSIA BUY 3,129 665 53.2 874 750 12.8 14.8 12.3 1.0 0.9 6.6% 7.5% CTRA BUY 22,551 1,215 (9.0) 1,560 1,580 30.0 17.9 15.6 1.5 1.5 8.7% 9.4% DMAS BUY 9,832 204 (11.3) 294 300 47.1 11.5 9.3 1.1 1.0 9.7% 10.8% KIJA BUY 6,456 310 7.0 413 450 45.2 13.5 11.9 1.0 1.0 7.8% 8.1% Average 19.1 15.8 1.5 1.4 8.9% 9.5% Stock Rec
Summarecon Agung
SMRA:IJ | SMRA.JK
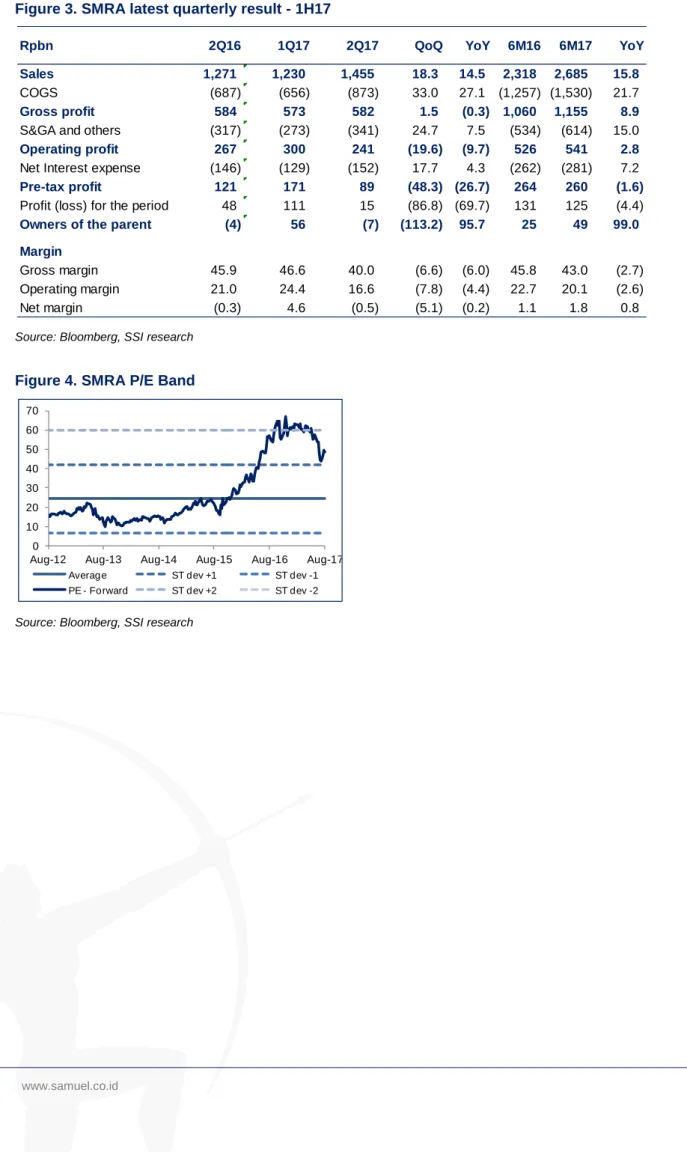
Figure 3. SMRA latest quarterly result - 1H17
Source: Bloomberg, SSI research
Figure 4. SMRA P/E Band
Source: Bloomberg, SSI research
Rpbn 2Q16 1Q17 2Q17 QoQ YoY 6M16 6M17 YoY
Sales 1,271 1,230 1,455 18.3 14.5 2,318 2,685 15.8 COGS (687) (656) (873) 33.0 27.1 (1,257) (1,530) 21.7 Gross profit 584 573 582 1.5 (0.3) 1,060 1,155 8.9 S&GA and others (317) (273) (341) 24.7 7.5 (534) (614) 15.0 Operating profit 267 300 241 (19.6) (9.7) 526 541 2.8 Net Interest expense (146) (129) (152) 17.7 4.3 (262) (281) 7.2 Pre-tax profit 121 171 89 (48.3) (26.7) 264 260 (1.6) Profit (loss) for the period 48 111 15 (86.8) (69.7) 131 125 (4.4) Owners of the parent (4) 56 (7) (113.2) 95.7 25 49 99.0 Margin Gross margin 45.9 46.6 40.0 (6.6) (6.0) 45.8 43.0 (2.7) Operating margin 21.0 24.4 16.6 (7.8) (4.4) 22.7 20.1 (2.6) Net margin (0.3) 4.6 (0.5) (5.1) (0.2) 1.1 1.8 0.8 0 10 20 30 40 50 60 70
Aug-12 Aug-13 Aug-14 Aug-15 Aug-16 Aug-17 Average ST dev +1 ST dev -1 PE - Forward ST dev +2 ST dev -2
Summarecon Agung
SMRA:IJ | SMRA.JK
Key financial figures
Profit and Loss Cash Flow
Yr-end Dec (Rp bn) 15A 16A 17E 18E Yr-end Dec (Rp bn) 15A 16A 17E 18E
Revenue 5,624 5,398 5,810 6,246 Net income 855 312 327 435
COGS (2,717) (2,800) (3,013) (3,302) Depreciation & amort. (222) (266) (420) (473)
Gross profit 2,907 2,598 2,797 2,944 Others 810 0 0 0
Gross margin (%) 51.7 48.1 48.1 47.1 Working capital (1,464) (1,448) 1,369 (530) Operating profit 1,791 1,410 1,535 1,553 Operating CF (21) (1,402) 1,276 (567) Operating margin (%) 31.9 26.1 26.4 24.9 Net - Capital expenditure (567) (471) (568) (588) EBITDA 2,097 1,771 2,090 2,199 Investing CF (1,907) (489) (2,037) (1,247) EBITDA margin (%) 37.3 32.8 36.0 35.2 Net - Borrowings 1,535 2,027 (1,232) 133 Other inc (exp) (409) (532) (614) (575) Others 126 3,121 (545) 1,058 Pre-tax profit 1,382 878 921 978 Financing CF 1,660 5,148 (1,777) 1,191 Income tax - net (316) (261) (291) (312) Net - Cash flow (267) 3,258 (2,538) (623) Net profit 855 312 327 435 Cash at beginning 1,174 906 4,164 1,626 Net profit margin (%) 15.2 5.8 5.6 7.0 Cash at ending 906 4,164 1,626 1,003
-63.6% 4.8% 33.3%
Balance Sheet Key Ratios
Yr-end Dec (Rp bn) 15A 16A 17E 18E Yr-end Dec 15A 16A 17E 18E
Cash & ST Invest 1,504 2,076 1,626 1,003 ROE (%) 11.36 3.82 4.07 5.65 Receivables 152 548 157 169 ROA (%) 4.56 1.50 1.71 2.30 Inventories 4,925 5,531 5,088 5,470 Revenue growth (%) 3.09 (1.83) 7.64 7.50 Others 709 543 733 788 EPS growth (%) (38.29) (63.55) 4.82 33.27 Total current assets 7,290 8,699 7,604 7,429 Interest coverage (x) 2.86 (8.68) (18.16) (41.98) Land for development 5,737 6,158 3,952 3,187 Debt to equity (%) 82.31 90.95 77.18 82.11 Net fixed assets 4,732 4,938 5,087 5,202 Net gearing (%) 62.35 65.52 56.92 69.10 Other assets 999 1,016 2,485 3,143
Total assets 18,758 20,810 19,128 18,961 Marketing sales
Payables 367 414 379 408 Yr-end Dec (Rp bn) 15A 16A 17E 18E ST. debt & curr. mat 983 1,402 1,016 984 SSP (Serpong) 2,732 2,197 2,488 2,718 LT. debt 5,214 6,024 5,178 5,343 SBK (Bekasi) 621 520 594 743 Other liabilities 4,664 4,804 4,528 4,521 SKG (Kelapa Gading) 262 186 263 306 Total liabilities 11,229 12,645 11,102 11,256 SBD (Bandung) 735 557 480 582 Total equity 7,529 8,166 8,026 7,705 Total 4,350 3,460 3,825 4,349
DISCLAIMERS : Analyst Certification : The views expressed in this research accurately reflect the personal views of the analyst(s) about the subject securities or
issuers and no part of the compensation of the analyst(s) was, is, or will be directly or indirectly related to the inclusion of specific recommendations or views in this research. The analyst(s) principally responsible for the preparation of this research has taken reasonable care to achieve and maintain independence and objectivity in making any recommendations. This document is for information only and for the use of the recipient. It is not to be reproduced or copied or made available to others. Under no circumstances is it to be considered as an offer to sell or solicitation to buy any security. Any recommendation contained in this report may not be suitable for all investors. Moreover, although the information contained herein has been obtained from sources believed to be reliable, its accuracy, completeness and
Research Team
Andy Ferdinand, CFA Head Of Equity Research, Strategy,
Banking, Consumer [email protected] +6221 2854 8148 Muhamad Makky Dandytra, CFTe Technical Analyst [email protected] +6221 2854 8382
Akhmad Nurcahyadi, CSA Auto, Aviation, Cigarette, Construction
Healthcare, Heavy Equipment, Property [email protected] +6221 2854 8144
Arandi Ariantara Cement, Telecommunication, Toll Road,
Oil and Gas [email protected] +6221 2854 8392
Marlene Tanumihardja Poultry, Retail, Small Caps [email protected] +6221 2854 8387
Sharlita Lutfiah Malik Mining, Plantation [email protected] +6221 2854 8339
Nadya Swastika Research Associate [email protected] +6221 2854 8338
Private Wealth Management
Evelyn Satyono Head of PWM / Institutional Sales [email protected] +6221 2854 8380
Muhamad Alfatih CSA, CTA, CFTe Senior Technical Portfolio Advisor [email protected] +6221 2854 8129
Ronny Ardianto Institutional Equity Sales [email protected] +6221 2854 8399
Clarice Wijana Institutional Equity Sales [email protected] +6221 2854 8395
Fachruly Fiater Institutional Equity Sales [email protected] +6221 2854 8325
Equity Sales Team
Kelvin Long Head of Equities [email protected] +6221 2854 8150
Yulianah Institutional Equity Sales [email protected] +6221 2854 8146
Lucia Irawati Retail Equity Sales [email protected] +6221 2854 8173
Online Trading Sales Team
Nugroho Nuswantoro Head of Marketing Online Trading [email protected] +6221 2854 8372
Wahyu Widodo Marketing [email protected] +6221 2854 8371