The Influence of Attitude, Subjective Norm, and Perceived Behavioural Control
Toward Snack Consumer Behaviour in Halal Labeling in Yogyakarta
Ayu Afsari*, Any Suryantini, Jangkung Handoyo Mulyo
Magister of Agribusiness Management, Faculty of Agricuture, Universitas Gadjah Mada Jln. Flora no. 1, Bulaksumur, Sleman, Yogyakarta 5528, Indonesia
*Corresponding author: [email protected]
ABSTRACT
Halal label was not only related to substances forbidden for a particular religion, but was also associated with many other important things. The talk about halal label issue also meant a talk about health and hygiene. This research aimed to determine the learning level of consumer of the concept of halal-labeled snack; to know how to influence learning, attitudes, subjective norms, perceived behavioural control, and the prices on consumer behaviour of packaged halal-labeled snack, either partially or simultaneously. The effect was determined using a multiple linear regression analysis. Data were collected through compiled structured questionnaires based on certain indicators addressed to 100 respondents. The sampling technique used in this study was a convenience sampling technique, where the sample was selected from members of the population willing to become respondents. The choice of location was determined intentionally (purposive). Attitude scale used was Likert scale, and scale variable used was interval scale. The results showed that the consumer learning level on a basic concept of halal contained in a halal label was very high. This was proven with the results of the interpretation of a score interval, i.e. 88.12%. Consumer behaviour towards snacks in packaging labeled halal simultaneously was influenced by learning, attitudes, subjective norms, perceived behavioural control, and price, while attitude and price influenced partially.
Received: 10
thMay 2016 ; Revised: 8
thJune 2016 ; Accepted: 25
thAugust 2017
INTRODUCTION
Indonesia, as the fourth biggest population in the world, causes a high food demand. The source of food demand comes from agriculture sector, whether from gardening, fishery, or breeding. The commodities from those sources mostly need further cultivation process in order to be consumed by the consumers. The process will need various steps which the commodity will obtain certain treatment on each process that is not known the detail. As the consumer, on each process of commodity from the first to being consumed is absolutely maintained well, either the materials or the methods.
It is not easy, even impossible, for the consumer to allow and examine in detail each process done for each snack, because it is related to laboratory or chemical test, observing process, examining content, and others. Therefore, by labeling halal conducted by certain institution will help consumer to identify
a good or bad snack to be consumed.
The awareness and understanding of consumer toward this halal concept had increased the amount of food trading annually in Moskow, Rusia from 45 USD in 2004 to 64 USD in 2006 (Muhammad, 2007). According to Agri-Food Trade Service Kanada in 2008, there was a high demand of halal product in various non-Muslim countries. The society in Filipina prefered to choose halal product for health. Then they searched for halal product which they were convinced of its safety, health, and good to be consumed (Muhammad, 2007).
This study is based on several theories, one of which is the theory of Icek Ajzen (1991), namely the Theory of Planned Behaviour (TPB). This theory will note how attitudes, subjective norms, and perceived control affect consumer behaviour in consuming a food product, particularly snacks. In addition to the variables from TPB theory, the authors added two more variables, i.e. the
Keywords: Attitudes, Consumer Behaviour, Learning, Subjective Norms, Perceived Behavioural Control, Price
Ilmu Pertanian (Agricultural Science)
Vol. 2 No. 1 April, 2017 :029-34
variable learning by Prasetijo and Lhalauw (2005) which is also very important in influencing consumer behaviour as a result of information processing consciously or unconsciously, and the last variable was price variable.
Research on halal labeling in the packaging of food and beverages had been carried out by many researchers from various countries. However, not much researches discussed about the consumer behaviour in particular on snack in packaging, especially in Yogyakarta.
A research conducted by the Agency for Research and Training Center for Religious Life Ministry of Religious Affairs Indonesia in 2013 about the behaviour of the Muslim urban community on consuming halal products made in seven major cities in Indonesia, namely Jakarta, Bandung, Surabaya, Batam, Solo, Denpasar, and Manado. The cities were selected purposively, sampling a city with a certain specificity, i.e. a total of 770 respondents. It was conclude that the general knowledge level of the Muslim communities in the seven towns about the concept of halal products at the level of knowledge was "very high". It was indicated by knowledge of halal product index which scored 4.55 on a scale of 5. Perceptions of respondents on halal and halal product labeling was indicated high. This was supported by the fact that 95% of respondents wanted all outstanding products supporting the guaranteed halal and halal labeling on food products and beverages, as well as restaurants. The behaviour of respondents with regard to awareness of halal products was "high" by the behaviour index value of 3.84 (on a scale of 5). Based on the results of the analysis of pathways, it was known that there was a significant difference between the respondents’ knowledge and their perception of halal products. Religious activities was a positively significant and greatest contribution to the improvement of knowledge and perception of halal products, rather than environmental factors and education. And the latter was a social reality which successfully revealed by this study, showed that the presence of laws and regulations that protect consumers (Muslims) from eating non halal products were strictly necessary and were an urgent matter (Kementerian Agama, 2013).
Research on the influence on purchasing halal labeling decisions had performed by Agustian and Sujana (2013) in a case study Conello Wall's products. From the results of the study, it could be concluded that the respondents’
assessment of Muslim halal labeling on products Wall's Conello was good and so were the respondents’ assessment of the non-Muslims. However, respondents’ perception of Muslim and non-Muslim against halal labeling was very different.
From the prices and the willingness to pay, from the research conducted by Verbeke at al. (2013), of 220 Muslim consumers in Belgium, there were indications that the consumers preferred to buy halal labeled meat in a supermarket. The results further showed that consumers were willing to pay higher prices up to an average of 13% for halal labeled meat at the Islamic slaughterhouse than in supermarkets. From the research conducted by Kamaruddin et al. (2012) regarding the willingness to pay for halal logistics, it was found that respondents were willing to pay more for halal logistics. The higher the consumer awareness on the importance of inclusion of Muslim halal label and their doubt in the status of halal meat, the more likely they were willing to pay a higher price for the meat to be certified halal.
This research aimed to determine the learning level of consumer of the concept of halal-labeled snack; to know how to influence learning, attitudes, subjective norms, perceived behavioural control, and the prices on consumer behaviour of packaged halal-labeled snack, either partially or simultaneously.
MATERIALS AND METHODS
Sample and Population
This research used the design of descriptive research which involved data collecting for hypothesis testing. The data used in this research were primary data. The technique of collecting data in this research was done by surveying the instrument of research, such as questionnaire drafted sequentially based on the research indicators. To assure validity and reliability from instrument used, it was conducted in Yogyakarta first. The selection of this location as a population was determined purposively. It was expected that the consumer behaviour in Yogyakarta was able to represent the consumer behavior in Indonesia.
This research used 100 samples. This number was based on the statement form Sanusi (2013), which stated that to test the relation between one variable and more, it would need minimum number of 30 samples for the research.
Scope of Problem
consumers in Yogyakarta, the snack of the focus of this research was bordered for three types of snack which were popularly consumed, such as biscuit, cracker, and chip. The result of pre-survey could be seen in Figure 1.
Analysis Tools
Analysis method used in the research was analysis of linear regression and correlation product moment, followed by simple regression. The first hypothesis was tested by comparing the ideal learning’s score and the total score obtained for variable learning from respondents’ answer.
The scores’ was obtained from Likert scale based on the amount of attitude of respondent in responding the statement related to a certain indicator concept or variable measured. In this case, respondent was requested to declare agree or disagree about every statement. Likert scale usually used five dots with neutral label in the middle of third position.
RESULT AND DISCUSSION
Respondent Demographic
A total of 100 respondents were personally surveyed in Yogyakarta. The demographic profile of overall sample was shown in Table 1. The sample consisted of 64 female and 36 male respondents. The age composition of the sample was normally distributed with the most respondents were 20-25 years old. Seventy-two respondents were s i n g l e a n d 2 8 w e r e m a r r i e d . T h e r e w e r e three religion of respnondents collected in this survey, and the majority of respondent’s religion was Islam (91 respondents).
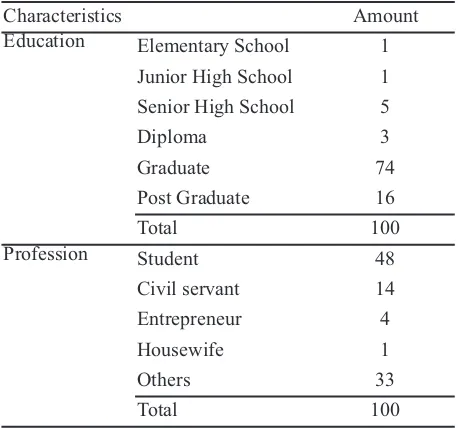
The majority of the respondents were graduate (74 respondents), and their profession were as student in state university or in private university in Yogyakarta (Table 2).
The amount of respondents’ income was about
Rp 1,000,000.00 – Rp 2,000,000.00 with snack expenditure per month was about Rp 50,000.00 – Rp 300,000.00. The frequency of buying snack was more than five times per month, with the most snack purchased was biscuit (Table 3).
The Result of Validity Test
The method of validity test used in this research was Corrected Item Total Correlation. With 100 samples (N=100) and significant level of 5%, the r-table was 0.915. If the correlation value was higher than the r-table, it could be concluded that the item was valid. Meanwhile if its value was less than r-table
Figure1. The percentage of snack consumed
Table 1.Respondents’ profile
Characteristics Amount
Sex Male 36
Female 64
Total 100
Age 20-25 years 51
26-30 years 37 31-40 years 10 41-50 years 2
Total 100
Marriage status Married 28
Single 72
Total 100
Religion Islam 91
Protestant 5
Catholic 4
Hindu 0
Buddha 0
Konghucu 0
Total 100
Table 2.Education and profession
Characteristics Amount
Education Elementary School 1
Junior High School 1 Senior High School 5
Diploma 3
Graduate 74
Post Graduate 16
Total 100
Profession Student 48
Civil servant 14 Entrepreneur 4
Housewife 1
Others 33
0.195, the value was not valid and must be discarded. The result of validity test of every questionnaire item for each variable was presented in the following table.
Table 4 showed that all items in variable learning in this research were valid. So, they could be used for this research.
Table 5 showed that all items in variable attitude in this research were valid. So, they could be used for this research.
Table 6 showed that all items in variable
subjective norm in this research were valid. So, they could be used for this research.
Table 7 showed that all items in variable perceived behavioural control in this research were valid. So, they could be used for this research. Table 8 showed that there was one item (item 24) in the price variable which was not valid. So, it could not be used for this research.
Table 9 showed that all items in consumer behaviour variable in this research were valid. So, they could be used for this research.
The method of reliability test used in this research
Table 3.Income and expenditure of respondents
Characteristics Amount Rp 4,000,000 – Rp 5,000,000 3 ˃ Rp 5,000,000 4 Rp 101,000 – Rp 200,000 33 Rp 201,000 – Rp 300,000 20
Table 4.The result of validity test for learning (X1)
No r-count r-table Validity Item 1 0.497 0.195 Valid Item 2 0.597 0.195 Valid Item 3 0.645 0.195 Valid Item 4 0.648 0.195 Valid Item 5 0.338 0.195 Valid Item 6 0.486 0.195 Valid Item 7 0.552 0.195 Valid Item 8 0.571 0.195 Valid Item 9 0.521 0.195 Valid Item 10 0.525 0.195 Valid
Table 5.The result of validity test for attitude (X2) No r-count r-table Validity Item 11 0.649 0.195 Valid Item 12 0.767 0.195 Valid Item 13 0.682 0.195 Valid Item 14 0.726 0.195 Valid
Table 6. The result of validity test for subjective norm (X3)
No r-count r-table Validity Item 15 0.459 0.195 Valid Item 16 0.557 0.195 Valid Item 17 0.546 0.195 Valid
Table 7. The result of validity test for perceived behavioural control (X4)
No r-count r-table Validity Item 18 0.627 0.195 Valid Item 19 0.654 0.195 Valid Item 20 0.546 0.195 Valid
Table 8. The result of validity test for price (X5) No r-count r-table Validity Item 21 0.458 0.195 Valid Item 22 0.682 0.195 Valid Item 23 0.331 0.195 Valid Item 24 0.175 0.195 Not Valid Item 25 0.611 0.195 Valid Item 26 0.685 0.195 Valid
Table 9. The result of validity test for consumer behaviour (Y)
No r-count r-table Validity
Item 27 0.390 0.195 Valid
Item 28 0.597 0.195 Valid
Item 29 0.313 0.195 Valid
Item 30 0.462 0.195 Valid
Item 31 0.416 0.195 Valid
was Cronbach Alpha method. The limitation used in taking decision was 0.6. According to Sekaran (1992), reliability which was less than 0.6 was not good, while 0.7 was able to be accepted, and over 0.8 was good. The following table was the result of reliability test of questionnaire.
Table 10 showed that all variables in this research were reliable and could be used for further analysis. The tests conducted in multiple regression linear analysis were F-test and t-test. The similar multiple regression linear with 5 independent variables in this research was:
Y = 4972.907 + 0.033 X1+0.618X2– 0.078X3+ 0.024X4+ 0.371X5...(1) Coefficient values could be seen in Table 11, then included in the regression equations.
F test was used to test the influence of the independent variable simultaneously toward the dependent variable. With the significant level of 0.05, F-table was 2.699 and F-count could be observed from Table 12.
It was known that F-count (23.085) ˃ F-table (2.699). Thus, the null hypotheses was rejected. It can be concluded that learning, attitude, subjective
norm, perceived behavioural control, and price simultaneously influenced the consumer behaviour. The hypothesis of level of consumer’s learning about halal concept was high was tested by comparing the ideal learning’s score and total score for learning variable obtained from respondent’s answers. The result of testing was shown below:
1) Ideal score of learning was 5,000, obtained from 5 x 10 x 100, where 5 was the highest score of Likert scale in this case; 10 was the sum of instruments’ learning; and 100 was the number of respondents.
2) Based on the collected and counted data, we found that the score of learning variable was 4,406. 3) So the level of consumer’s learning about halal concept was high, especially snack in halal labeling was 4,406 : 5,000 = 0.8812 = 88.12%, which was named interval score.
4) Based on the intrepretation of interval score according to Natsir (2013), interval score of 88.12% was considered very high.
Decision and conclusion making for every independent variable as an answer to the second to sixth hypothesis was done by using t-test. T-test was used to test the influence of the independent
Table 10. The result of reliability test variable
Variable Cronbach Alpha
Value Reliability Learning (X1) 0.840 Reliable
Attitude (X2) 0.860 Reliable
Subjective Norm (X3) 0.703 Reliable
Perveived behavioural
control (X4) 0.684 Reliable
Price (X5) 0.790 Reliable
Consumer Behaviour
(Y) 0.716 Reliable
Table 11. The result of reliability test variable
Model Unstandardized Coefficients B Std. Error 1 (Constant) 4972.907 1852.130
Learning (X1) .033 .054
Attitude (X2) .618 .139
Subjective Norm (X3) -.078 .164
Perceived behavioural
control (X4) .024 .137
Price (X5) .371 .099
Table 12. The result of F-test
Model Sum of Squares df Mean Square F Sig. 1 Regression 7.201E8 5 1.440E8 23.085 .000a
Residual 5.864E8 94 6238574.102
Total 1.307E9 99
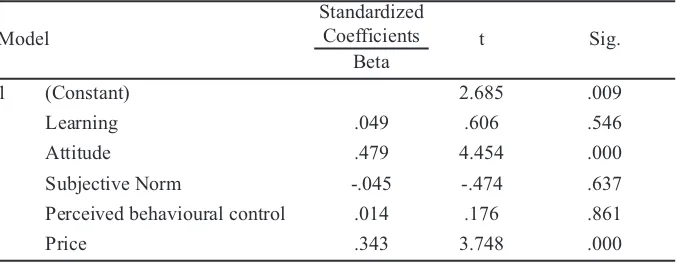
Table 13. Factors influenced consumer behaviour
Model
Standardized
Coefficients t Sig. Beta
1 (Constant) 2.685 .009
Learning .049 .606 .546
Attitude .479 4.454 .000
Subjective Norm -.045 -.474 .637 Perceived behavioural control .014 .176 .861
variable partially toward dependent variable. The t-table for significant level of 0.05 was 1.985. The value of t-count could be seen in the Table 13.
For learning variable, it was found that t-count (0.606) < t-table (1.985). Thus, null hypotheses was accepted and it could be concluded that learning did not influence the consumer behaviour. It meant that consumer behaviour in consuming halal labeled snack was not influenced by learning.
For attitude variable, it was found that the t-count (4.454) ˃ t-table (1.985). Thus, null hypotheses was rejected and it could be concluded that attitude influenced the consumer behaviour. It meant that consumer behaviour in consuming halal labeled snack was influenced by attitude.
For subjective norm variable, it was found that -t-count (-0.474) ˃ -t-table (-1.985). Thus, null hypotheses was accepted and the conclusion was that subjective norm did not influence the consumer behaviour. It meant that the consumer behaviour in consuming halal labeled snack was not influenced by subjective norm.
For perceived behavioural control variable, it was found that t-count (0.176) ˂ t-table (1.985). Thus, null hypotheses was accepted and it could be concluded that perceived behavioural control did not influence the consumer behaviour. It meant that consumer behaviour in consuming halal labeled snack was not influenced by the perceived behavioural control.
For attitude variable, it was found that t-count (3.748) ˃ t-table (1.985). Thus, null hypotheses was rejected and it could be concluded that attitude influenced the consumer behaviour. It meant that consumer behaviour in consuming halal labeled snack was influenced by price.
CONCLUSION
Learning consumers on a basic concept of halal in a halal label was very high that was indicated by knowledge gained by consumers about everything related to the concept of halal labeled snack. Learning is very high no effect on consumer behaviour in eating halal labeled snacks. Their attitudes indicated by attention to the halal label found in the packaged snack before they bought and ate was great. They also felt safe with the label halal, and halal labeled snack was always a priority to be purchased and consumed than unlabeled snack.
The prices were a positive influence in consumer behaviour, as long as it had a halal label. Subjective norms and perceived behavioural control had no
effect on consumer behaviour in consuming little food halal labeled snack. However, simultaneously learning, attitudes, subjective norms, perceived behavioural control, and price influenced the consumer behaviour.
REFERENCES
Agustian, E. H. dan Sujana. 2013. Pengaruh Labelisasi Halal terhadap Keputusan Pembelian Konsumen; Studi Kasus pada Produk Wall's Conello. Jurnal Ilmiah Manajemen Kesatuan, 1(2): 169-178. Ajzen, I. 1991. The Theory of Planned Behaviour,
In: Organizational Behaviour and Human Decision Process. Amherst: MA Elsevier, 50(2): 179-211.
Kamaruddin, R., I. Hadijah, and A. Shabudin. 2012. Willingness to Pay for Halal Logistics, The Lifestyle Choice. Procedia-Social and Behavioural Sciences, 50: 722-729. Kementerian Agama. 2013. Perilaku Komunitas
Muslim Perkotaan dalam Mengonsumsi Produk Halal. Jakarta: Puslitbang Kehidupan Keagamaan.
Muhammad, R. 2007. Branding Halal Food as Safe, Healthy and Clean. Halal Journal, [online] 635. Available at: http://www.halaljournal. com/article/635/branding-halalfood-as-safe,-healthy-and-clean [Accessed 11 October 2016].
Natsir, F. M. 2013. Cara Menghitung Skala Likert. [online] Available at: http://fathirphoto. wordpress.com/ [Accessed 11 October 2016]
Prasetijo, R. dan J. J. Lhalauw. 2005. Perilaku Konsumen. Yogyakarta: Penerbit Andi. Sanusi, A. 2013. Metodologi Penelitian Bisnis.
Jakarta: Salemba Empat.
Sekaran, U. 1992. Reseach Methods for Business; A Skill-Building Approach. 4th ed. New York: John Wiley and Sons.