Performance Evaluation and Optimum Portfolio Allocation for Stocks of
Agribusiness and Non-Agribusiness Companies in ILQ45
Azizatun Nurhayati*, Any Suryantini, Jamhari
Department of Agricultural Socio Economics, Faculty of Agriculture, Universitas Gadjah Mada Jln. Flora no. 1, Bulaksumur, Sleman, Yogyakarta 5528, Indonesia
*Corresponding email: [email protected]
ABSTRACT
Investors need fundamental aspects to allocate their fund in a set of efficient portfolio to maximize their yield. One of many fundamental aspecs is risk and return stocks price analysis. There were some agribusniness companies and non-agribusiness companies listed in ILQ45. This study was aimed to know stock performance of non-agribusiness companies compared with non-agribusiness companies which were listed in Index Liquid 45 in Indonesia Stock Exchange and to allocate optimum portfolio with cut off point method and randomly designed methode. Data of monthly from August 2011-December 2015 was used in this study. The result showed that range of return of agribusiness companies was -13.24% up to 20.098% and non-agribusiness was 49.50% up to 10.39%. Range of standard deviation for agribusiness companies was 6.43%-14.36% and 5.87-15.54% for non-agribusiness. Range of positive coefficient of variance (CV) for agribusiness was 3.59-18.61 and 5.47-59.19. Optimum portfolio formed by Unilever Indonesia (61.27%), Indofood ICBP (32.27%), BCA (3.81%), and BRI (2.65%). Return of optimum portfolio was 21.77% year on year and it was the highest return among portofolios which were formed randomly.
Received: 16
thFebruary 2016 ; Revised: 7
thMarch 2016 ; Accepted: 22
ndMarch2017
INTRODUCTION
Performance measurement is the process of developing measurable indicators that can be systematically tracked to assess progress made in achieving predetermined goals (Bryceson and Slaughter, 2010). Portfolio is basically related to how one allocates a number of stocks into various investment types that results on optimal profits. By making diversification, investor may reduce the rate of risk and at the same time optimize the rate of expected return (Eko, 2008). To form a portfolio in capital market, investors need some data relate to risk and return of stocks, obligation, and others. Risk and return represent companies performance, so that by identifying risk and return form each portfolio components, an investor can get maximum capital gain and minimun capital loss. This condition called as optimum portfolio. Natalia et al. (2014) said that an efficient portfolio is a portfolio that offers the lowest risk with a certain rate of return or offers the greatest return rate with a certain risk. Stock portfolio analysis is the analysis conducted by diversifying or
selective combining shares in investment, with a portfolio of risks to be minimized. Every sector of Indonesia Stock Exchange which includes shares of agribusiness companies, have an equal risk investments (Sugiartawan et al., 2013). Agriculture sector was a buffer sector when there was economic crisis in 1998 but there were few agriculture companies listed in Indonesia stock exchange. This research guided to a decision wheather agribusiness investment was profitable enough for investors.
Agribusiness sector in present scope includes comercial activities. The commercial activities were held by combinating labour, material, capital, and technology. Agribusiness system are formed by three prominent sectors, they are input, farm, and output. It means agribusinees system includes all of material input, on farm activities, all products which support input for on farm activities. Agribusiness is also mixed up with production process until distribution and delivering them to costumers. It can be concluded that modern definition of agribusiness overwhelms all of production system and food distribution
Keywords: DEA, Farming Efficiency, KRPL
Ilmu Pertanian (Agricultural Science)
Vol. 1 No. 3 December, 2016 : 115-122
(Downey and Erickson, 1987). Agribusiness economics is concerned with understanding how institutions, organizations, and markets affect vertical and horizontal coordination within the food system (King et al., 2010)
Agriculture sector in Indonesia capital market (BEI) showed a good performance. During 2005-2011 mean of stocks indices of agriculture and mining took the higher level among other sectors. On the other side, agriculture sector performed dynamic fluctuation which was showed by its indices (Kurniadi
et al., 2014).
Johnson et al. (2006) built a research about stocks in Australia. The research used mixed assets portfolio, including agribusiness stocks, others stocks, obligations, and property stocks. The conclusion of the research was agribusiness stocks gave diversified yield in mixed assets portofolios, as the result the stocks optimized portfolio. Based on Suryani and Herianti (2015), it was known that stocks return which were listed in ILQ45 during 2011-2014 distributed between 0.0371-0.6069. The lowest return was PT Timah and the highest one was Bank Negara Indonesia in 2010. The lowest standard deviation was (0.023) and the highest one was 0.0212. Beta as the parameter of systematic risk was (0.3817) up to 1.25837.
Based on market capitalization and liquidity, companies able to boost the value of the Composite Stock Price Index (IHSG) in the stock market are companies with large market capitalization. One of the indexes considering the largest number of transactions and the company's livelihood on the stock is the Liquid 45 Index (ILQ45). Companies included in the ILQ45 class are often incorporated into the portfolio by investors to maximize profits. According to Larasati (2013) ILQ45 controls nearly 70% equity ownership in the capital market. According to Chandra and Hapsari (2013) the shares which are included in the LQ45 list attract investors, make a portfolio diversification is necessary to minimize unsystematic risk.
Mutual fund is a set of portfolio which is dominated most (80%) by companies stocks to get capital gain for its benefit. Investment management combines blue chips stocks to optimize dividend share for investors. Mixed mutual fund contains various portfolio components such as obligation and stocks with various proportion(Widjaja dan Ramaniya, 2009).
Masloman (2013) held a research to arrange optimum portfolio in capital market in Manado in Februari 2011-Februari 2012. Masloman used single index methode (cut off point) to solve it. Based on the research, the result showed that four companies
from 9 companies which was used for sample, compatibel enough to form optimum portfolio. The companies were PT Astra Agro Lestari, Bahtera Adimina Samudera, Inti Agri Resources and Multibreeder Adiraman. Beside that, the stocks return of the companies were also higher than their risks. The companies used to form optimum portfolio because calculation of their excess return to beta was higher than their cut off point.
This study was aimed to know stock performance of agribusiness companies compared with non-agribusiness companies which were listed in Index Liquid 45 in Indonesia Stock Exchange and to allocate optimum portfolio with cut off point method and randomly designed methode
MATERIALS AND METHODS
ILQ45 is an index in Indoneis Stock Exchange which consists of 45 largest companies in capitalization. The companies which are listed in ILQ45 have the best performance during tha last 12 months. The index evaluated and updated regularly one time in a semester, in August and February. The companies which have not worked properly and the performance is getting worst and worst in a periode will be delisted from the index in the next periode and replaced by other companies which have the better performance one.
Secondary data were used in this research. They were stocks price data of companies which were listed in Indonesia Stock Exchange (BEI). They also called as go public companies. The definition of agribusiness companies in this research are general scope covering on farm activities and processing activities or agroindustries and all of supporting systems in agriculture including distribution. ILQ45 choosen for this object of research because most of ILQ45 are bluechips stocks in which investors interest much to choose them in their portfolios to optimize it.
Agribusiness companies which were used for sample were listed in Index Liquid 45 (ILQ45) August 2011-January 2016 periode. As the comparison, the resarch recorded stocks price from non-agribusiness companies which were also listed at the same periode with the agribusiness companies one. The periode of the research was started from August 2011 and ended up in fourth quarter of 2015 (December 2015). It was about 53 months data for 24 companies which were choosen as sample.
To calculte stocks return we used the formulas (Hartono, 2014):
Pt = companie stock price in t-periode (certain periode); Pt-1 = companies stock price in past (t-1). Historical return mean was calculated by geometric mean formula: Geometric mean (RG)= [(1+R1)(1+R2) ... (1+Rn)]1/n-1 in which R1, R2,... Rn = companies
stock return from 1st periode to n periode; n= periodes. Mean of expected return is known by using arithmatic mean formula:
R1, R2, .... Rn = companies stocks return from the 1st periode to n periode; n = periode
Standard deviation was calcutaled by:
Ri = stocks return in i periode; E(Ri) = expected return from arithmatic mean; n = periode
Coefficient of Variance (CV) was calculated by formula:
in which; σ = standard deviation; Ri = expected return Beta was calculated by regression analysis by which stocks return of each company regressed to market return:
(Ri-Rbr) = αi+βi.(Rm-Rbr) + ei
in which (Ri-Rbr) was dependent variable and the others were independent variables, with: Ri = stocks return of a company; αi = intercept;βi = beta, Rm = market return; ei = error; Rbr = risk free rate (composed from Bank Indonesia Rate August 2011 to December 2015)
The research formed optimum portfolio by cut off point methode. To use this methode, excess re-turn to beta (ERB) should be calculated for each company.
in which ERBi = ERB for each company; E(Ri) = expected return for each company; Rf =Risk Free Rate; βi = beta.
Cut off point(Ci) calculated using:
in which Ci = cut off point; σ²m = market varian; σ²ei = stocks varian of a company; Ri = arithmatic return for a company; Rf = Risk Free Rate; βi =beta. Note: If ERB of a company stock price is higher compared to Ci so the company compatibel enough to form optimum potfolio and vice versa, if ERB is lower than Ci, it should not be used to form optimum portfolio.
Alocated proportion fund for each company was formed by :
in which Xi = alocated propotion fund for a company; βi = beta; σ²ei = stock varian for each company; ERB = Excess Return to Beta;Ci = cut off point.
Percentage proportion for each company developed by:
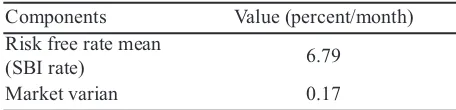
in which; Wi = percentage proportion for each company in an optimum portfolio; Xi = alocated proportion fund in an optimum portfolio of a company; ∑Xi = total slocsted proportion fund in sn optimum portfolio. Some additional data were used for completing the calculation. They were risk free rate dataand market varian data during the period of the research (Table 1).
RESULT AND DISCUSSION
Sample Characteristics
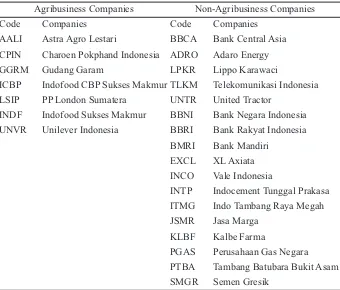
There were 17 companies which have been listed in ILQ45 in last 53 months and didn’t make any split stocks were composed in Table 2.
The agribusiness companies overwhelmed on farm activities and processing companies. Agribusiness companies which were dominated by on farm activities were Astra Agro Lestari and PP London Sumatera. Crude oil palm was the main commodity of both companies. On the other hand, agibusiness companies which were dominated by processing activities manufactured consumer goods such as food or household utilities or livestocks foods suppliers. The non-agribusiness companies consist of several business core, such as financial and bank, service, pharmacy, cement and cosntruction. They have been continually listed in ILQ45 till January 2016 from August 2011. It was used Table 3 to identify return and risk rate for each company. Information about risk and return rate are important to form an efficient portofolio randomly designed or using cut off point method.
Based on their geometric return mean, the companies had been descended from the highest up to the lowest
Table 1.Risk Free Rate Mean and Market Varian
Remarks: Source: www.bi.go.id andwww.idx.co.id, calculated.
Components Value (percent/month)
Risk free rate mean
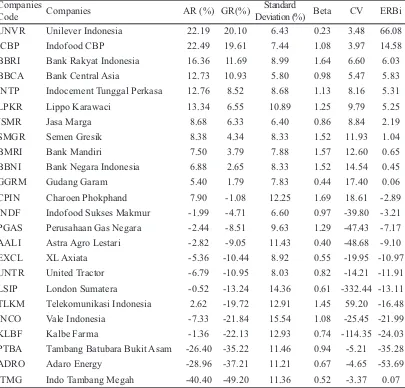
in Table 3. Geometric mean was used in this research because it let us know the grwoth of each company and suitable to evaluate historical stocks performance. Table 3 explained that the highest return and the runner up of return were agribusiness processing companies followed by non-agribusiness company, bank. The lowest return of agribusiness one was -13.237% and the highest one was 20.098% year on year.
Both of plantation companies, Astra Agro Lestari and PP London Sumatera got the negatif return in this periode of research. There were two from seven agribusiness processing companies which had the negatif return, they were Charoen Pokphand (CPIN) and Indofood Sukses Makmur (INDF). INDF had bad performance because it supervises some companies in a bad performa such as PP London Sumatera (LSIP) and Salim Ivomas which produces crude palm oil. INDF’s stocks price moved slowly as the effect of the decreasing of world palm oil price.
From the Table 3, range for non-agribusiness return were between -49.20% and 10.39%. Mining was the worst and financial companies like banks were the best one from non-agribusiness companies. Range of return of non-agribusiness companies in this periode of research was wider than range of return of agribusiness companies.Agroindustries or agribusiness based on food processing and houshelods was the best one because the company products so many utilities which are needed by most of people. The
product will be prosessed more and more when the population in a country is getting higher.
Financing companies like banks were dispossed to show us a good performance one. Bank management run the management so carefully to keep them in a good financial siatuation. In non-agribusiness companies, mining sector was the worst one, and Indo Tambang Megah was the one which faced this situation. Capital loss was highest since the return was negatif. Capital loss which was calculated from Indo Tambang Megah was higher than capital loss which was calculated from PP London Suamtera, which had the worst performance in August 2011-January 2016.
Total risk is sum of systematic risk and unsystematic risk and represented by standard deviation. One of many unsystematic risks is management performance. It can be reduced or vanished by diversifying activities or adding some emitens in a set of portfolio. Generally, investors give more atenttion in return and risk as the tools to choose the best emiten which is going to be combined with others emiten in portfolio. When the probability of losing out is higher than getting the gain, investor disposed to avoid the stocks.
Hartono (2014) said that based on its total risk, the condition when high risk and high return one and low risk, low return one will be happened in expected return. For realistic return, it may not be hapenned. It was proved by Unilever Indonesia, as the highest
ISSN 0126-4214 (print) ISSN 2527-7162 (online)
Table 2.The Companies Choosen for The Research
Agribusiness Companies Non-Agribusiness Companies
Code Companies Code Companies
AALI Astra Agro Lestari BBCA Bank Central Asia
CPIN Charoen Pokphand Indonesia ADRO Adaro Energy
GGRM Gudang Garam LPKR Lippo Karawaci
ICBP Indofood CBP Sukses Makmur TLKM Telekomunikasi Indonesia
LSIP PP London Sumatera UNTR United Tractor
INDF Indofood Sukses Makmur BBNI Bank Negara Indonesia
UNVR Unilever Indonesia BBRI Bank Rakyat Indonesia
BMRI Bank Mandiri
EXCL XL Axiata
INCO Vale Indonesia
INTP Indocement Tunggal Prakasa ITMG Indo Tambang Raya Megah JSMR Jasa Marga
KLBF Kalbe Farma
return of all companies. The highest return wasn’t followed by the highest standard deviation. Table 3 demonstrated that the lowest standard deviation in non-agribusiness comapanies was Bank BCA. It was 5.80% and the return was 10.93% year on year. Unilever Indonesia, had the higher return than Bank BCA that was 20.10% and had the higher standard
deviation than Bank BCA that was 6.43%. In this paired situation, high risk high return conducted well.
The stocks risk which measured by beta represents systematic risk. Beta also measures sensitivity of an emiten to market movement or composite index (Indeks Harga Saham Gabungan (IHSG)) in Indonesia
Table 3.Companies Performance During August 2011-December 2015
Remarks: AR: aritmatic return; GR: geometric return; ERB: Excess Return to Beta Source: Secondary data processed, 2016.
Companies
Code Companies AR (%) GR(%)
Standard
Deviation (%) Beta CV ERBi
UNVR Unilever Indonesia 22.19 20.10 6.43 0.23 3.48 66.08
ICBP Indofood CBP 22.49 19.61 7.44 1.08 3.97 14.58
BBRI Bank Rakyat Indonesia 16.36 11.69 8.99 1.64 6.60 6.03
BBCA Bank Central Asia 12.73 10.93 5.80 0.98 5.47 5.83
INTP Indocement Tunggal Perkasa 12.76 8.52 8.68 1.13 8.16 5.31
LPKR Lippo Karawaci 13.34 6.55 10.89 1.25 9.79 5.25
JSMR Jasa Marga 8.68 6.33 6.40 0.86 8.84 2.19
SMGR Semen Gresik 8.38 4.34 8.33 1.52 11.93 1.04
BMRI Bank Mandiri 7.50 3.79 7.88 1.57 12.60 0.65
BBNI Bank Negara Indonesia 6.88 2.65 8.33 1.52 14.54 0.45
GGRM Gudang Garam 5.40 1.79 7.83 0.44 17.40 0.06
CPIN Charoen Phokphand 7.90 -1.08 12.25 1.69 18.61 -2.89
INDF Indofood Sukses Makmur -1.99 -4.71 6.60 0.97 -39.80 -3.21
PGAS Perusahaan Gas Negara -2.44 -8.51 9.63 1.29 -47.43 -7.17
AALI Astra Agro Lestari -2.82 -9.05 11.43 0.40 -48.68 -9.10
EXCL XL Axiata -5.36 -10.44 8.92 0.55 -19.95 -10.97
UNTR United Tractor -6.79 -10.95 8.03 0.82 -14.21 -11.91
LSIP London Sumatera -0.52 -13.24 14.36 0.61 -332.44 -13.11
TLKM Telekomunikasi Indonesia 2.62 -19.72 12.91 1.45 59.20 -16.48
INCO Vale Indonesia -7.33 -21.84 15.54 1.08 -25.45 -21.99
KLBF Kalbe Farma -1.36 -22.13 12.93 0.74 -114.35 -24.03
PTBA Tambang Batubara Bukit Asam -26.40 -35.22 11.46 0.94 -5.21 -35.28
ADRO Adaro Energy -28.96 -37.21 11.21 0.67 -4.65 -53.69
ITMG Indo Tambang Megah -40.40 -49.20 11.36 0.52 -3.37 0.07
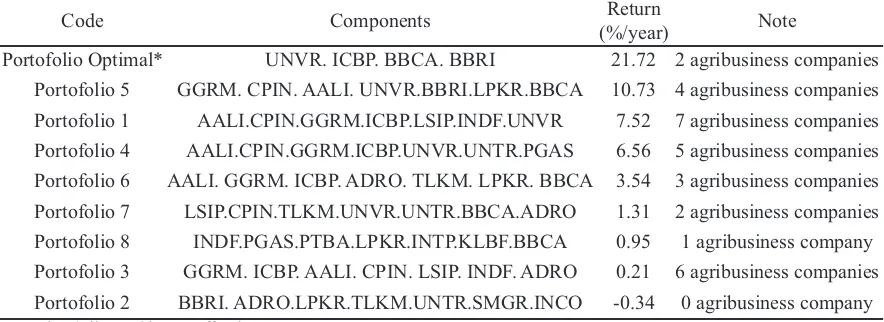
Table 4.Expected Return of Sets of Portfolio in Randomized Design
Source: Secondary data processed. 2016.
Code Components Return
(%/year) Note
Portfolio 1 AALI.CPIN.GGRM.ICBP.LSIP.INDF.UNVR 7.52 7 agribusiness companies
Portfolio 2 BBRI. ADRO.LPKR.TLKM.UNTR.SMGR.INCO -0.34 0 agribusiness company
Portfolio 3 GGRM. ICBP. AALI. CPIN. LSIP. INDF. ADRO 0.21 6 agribusiness companies
Portfolio 4 AALI.CPIN.GGRM.ICBP.UNVR.UNTR.PGAS 6.56 5 agribusiness companies
Portfolio 5 GGRM. CPIN. AALI. UNVR.BBRI.LPKR.BBCA 10.73 4 agribusiness companies
Portfolio 6 AALI. GGRM. ICBP. ADRO. TLKM. LPKR. BBCA 3.54 3 agribusiness companies
Portfolio 7 LSIP.CPIN.TLKM.UNVR.UNTR.BBCA.ADRO 1.31 2 agribusiness companies
Stock Exchange.When systematic risk equal to 1, it means the emiten has the same movement with the market moving, in the other side if beta more than 1, the emiten moves more responsif than market movement. Consequently, when market is getting worst, emitens which have beta more than 1 will get worst than market loss. Beta for agribusiness companies was between 0.23 and 1.69. Unilever was the lowest one, and it could be concluded that Unilever was dispossed to unresponsive to market movement. When market was getting bullish, the return of Unilever Indonesia increased 23% only. It would be a good news since market was getting bearish, Unilever Indonesia decreased lower than market. This situation brought stocks price of Unilever Indonesia into smooth movement and stabil. Based on beta, macro economic situation didn’t give any effect for Unilever Indonesia’s stocks price. Beta with 1.69 was Charoen Pokphand. The company would give more than composite marker return in a bullish environment, but actually, the company got negatif return on this periode.
Non-agribusiness companies group had 0.52 for the lowest beta and 1.64 for the highest beta. Range for beta in non-agribusiness companies was narrower than beta of agribusiness.It indicated that fluctuation of stocks prices of non-agribusiness was high compared to agribusiness. The logic reason of it, that manufacturing of agriculture commodity, since
for foods and beverages are primary and consumers goods, will be continued to be produced altough there are a lot of dynamic changes. Physiologycal needs is always the first priority for human being so that the systmatic risk of agribusiness was lower.
Coefficient of variance explouds relatif risk which is showed by standard deviation to erithmatic return. When calculation is used formula which is the standard deviation has the as weight as the return, it means we calculate the compared risk for risk neutral investors. The lower CV guides the better one since the emiten is not risky enough (Hartono, 2014). Negatif CV guides us nowhere, because negatif CV rises from negatif return. Range of CV for agribusiness was 3.48 up to 18.61 and 5.47 up to 59.19 for non-agribusiness. As similiar as beta, agribusiness had the narrower range than non-agribusiness so that it concluded that non-agribusiness was more rsiky than agribusiness.
In a simple way, to allocate some efficient sets of portfolio, risk and return were used to allocate randomized portfolio. The Table 4 explained sets of potfolio which were designed including their expected return. The return was calculated with the same weight for each emiten.
Table 4 demonstrated that efficent sets of portfolio in which the set of portfolio with highest return was the fifth portfolio. It was composed by 4 agibusiness companies, they were Gudang Garam, Charoen
ISSN 0126-4214 (print) ISSN 2527-7162 (online)
Table 5.Table 5. Optimum Set of Portfolio Composition*
Remarks: *based on their historical performance in August 2011-December 2015 Source: Secondary data processed. 2016.
Companies
Code Companies RA (%) Beta ERBi Ci Zi Percentage
UNVR Unilever Indonesia 22.190 0.233 66.076 1.439 34.213 61.275 ICBP Indofood CBP 22.487 1.076 14.584 4.826 18.019 32.272 BBCA Bank Central Asia 12.732 0.984 6.034 5.142 2.126 3.808
BBRI Bank Rakyat Indonesia 16.362 1.640 5.834 5.311 1.477 2.646
Table 6. Efficient Sets of Portfolio Ranking
Remarks: *allocated by cut off point
Code Components Return
(%/year) Note
Portofolio Optimal* UNVR. ICBP. BBCA. BBRI 21.72 2 agribusiness companies
Pokphand, Astra Agro lestari, Unilever and combined with non-agribusiness companies such as BRI, Lippo Karawaci, and BCA. The return of this set of protfolio was 10.73% year on year. Another way to form a set of efficient portfolio was by forming optimum portfolio with cut off point by calculating excess return to beta.
Excess return to beta was calculated by differencing aritmatic return and risk free rate return after divided with its systematic risk. Risk free rate of this research was Bank Indonesia rate which was collected since Agustus 2011-Desember 2015 from its website. An emiten has a good performance when it has the high ERB. When ERB is high, it drives us that emiten has the high expected return with its low systematic risk. Range of ERB in this research for agribusiness was 0.06 up to 66.08 and 0.45 up to 6.03 for non agribusiness. An emiten which had negative arithmatic return was automatically have negatif ERB. Negative ERB directs us that it is not good enough to be mixed in optimum set of portfolio.
ERB is a hint to form optimum set of portfolio. This research was also used ERB to compose and combine agribusiness and non-agribusiness companies in ILQ45 using historical closing price of stocks from a certain periode. Optimum set of portfolio,which was composed by cut off point, and their each proportion were declared in Table 5. The optimum portfolio was composed by four companies Ci was an akronim of cut off point. Each ERB of each companies was compared to Ci. Company which has higher or equal ERB than its Ci, is compatible to be mixed in set of portfolio. Based on the calculation, there were 2 companies from agribusiness group which caused an optimum set of portfolio. They were Unilever Indonesia and Indofood CBP. Among non-agribusiness companies, the choosen emitens were from financing companies. They were Bank Central Asia and Bank Rakyat Indonesia. Proportionof Unilever Indonesia was 61.27% and followed by Indofood CBP with 32.27%. They dominated portfolio in 93.6% .
It explained that agribusiness companies, in this case were Unilever Indonesia and Indofood CBP diversified optimum portfolio in a good way in this periode. The set of optimum portfolio expected to gain return up to 21.77% year on year with the total risk 6.22%. Compared with sets of portfolio which had been designed randomized, the optimum portfolio set was much better (Table 6).
From Table 5 above, set of optimum portfolio was the higehst of all. Set of non-agribusiness
companies was the worst one with negatif return. Sets of efficient portfolio give some alternatives for investors which the suitable one is. Components of optimum set also guided that combination between agribusiness and non agribusiness companies caused an optimum return.
CONCLUSION
Return of agribusiness companies were -13.24% up to 20.09% while non-agribusiness were -49.20% up to 10.39%. It means agribusiness companies had a better return than non-agribusiness on this periode of research. The lowest total risk for agribusiness was 6.43% and the highest one was 14.36%. Non-agribusiness companies’ total risk was 5.86% for the lowest and 15.54% for the highest one. Positive coefficient of variance for agribusiness was distributed between 3.48 to 18.61 and 5.47-59.19 for non agribusiness. The lowest coefficient of variance they have, the better performance they can be.
The optimum portfolio with cut off point method was constructed by Unilever Indonesia, Indofood CBP, BCA, BRI and agribusiness companies dominated 93.6% from the total proportion. In the other side, set of efficient portfolio composed by 7 non-agribusiness companies which designed randomly, gained negative return. The randomly designed portfolio of agribusiness companies was 7.52%. Optimum portfolio had the highest return among randomly designed portfolios.
ACKNOWLEDGEMENT
To advisors who help this research for the guidance and support, to Dr. Ir. Slamet Hartono, SU, M.Sc and Prof. Sri Widodo for the discussion and suggestions during the research.
REFERENCES
Bryceson, K. P. and G. Slaughter. 2010. Alignment of Performance Metrics in A Multi-Enterprise Agribusiness, Achieving Integrated Autonomy.
International Journal of Productivity and Performance Management, 59(4): 325-350. Chandra, L. dan L. Y. Hapsari. 2013. Analisis Pembentukan
Portofolio Optimal dengan Menggunakan Model Markowitz untuk Saham LQ45 Periode 2008-2012. Jurnal Manajemen: 141-65. Downey, W. D. dan S. P. Erickson. 1992. Manajemen
Agribisnis alih bahasa R. Ganda S, dan A. Sirait. Jakarta: Penerbit Erlangga.
ISSN 0126-4214 (print) ISSN 2527-7162 (online)
Administrasi dan Organisasi, 15(3): 178-187. Hartono, J. 2014. Teori Portofolio dan Analisis Investasi. Yogyakarta: Badan Penerbitan Fakultas Ekonomika dan Bisnis UGM.
Johnson, M., B. Malcolm, and I. O’Connor. 2006. The Role of Agribusiness Assets in Investments Portofolios. Australasian Agribusineess Review, 14(11): 1-35.
King, R. P., M. Boehlje, M. L. Cook, and S. T. Sonka. 2010. Agribusiness Economics and Management. Amer. J. Agr. Econ., 92(2): 554–570.
Kurniadi, A., N. A. Achsani, dan H. Sasongko. 2014. Kinerja Keuangan Berbasis Penciptaan Nilai, Faktor Makro Ekonomi, dan Return Saham Sektor Pertanian. Jurnal Manajemen dan Kewirausahaan, 16(2): 141-152.
Larasati, D., A. K. Irwanto, dan Y. Permanasari. 2013. Analisis Strategi Optimalisasi Portofolio Saham LQ 45 (pada Bursa Efek Indonesia Tahun 2009-2011). Jurnal Manajemen dan Organ-isasi, 2:165-171.
Masloman I., C. R. Dien, dan S. V. Rantung. 2013. Analisis Portofolio Optimum di Bursa Efek Indonesia. Jurnal Akulturasi, 1(1): 1-4.
Natalia, E., Darminto., dan M.G. Wi Endang N.P. 2014. Penentuan Portofolio Saham yang Optimal dengan Model Markowitz Sebagai Dasar Penetapan Investasi Saham. Jurnal Administrasi Bisnis (JAB), 9(1): 1-9.
Sugiartawan, P., I.W. Ramantha dan K.B. Susrusa. 2013. Analisis Portofolio Saham Perusahaan Agribisnis di Bursa Efek Indonesia. Jurnal Manajemen Agribisnis (Journal Of Agribusiness Management), 1(1):1-11.
Suryani, A and E. Herianti. 2015. The Analysis of Risk Adjusted Return Portfolio Performance Share for LQ45 Index in Indonesian Stock Exchange in 2010-2014 Periods. Science Direct: Procedia-Social and Behavioral Science, 211: 634-643.